The Sella Turcica and Parasellar Region
Sean P. Symons
Michael W. Chan
Richard I. Aviv
Aditya Bharatha
Paula Alcaide-Leon
Walter Kucharczyk
Normal Anatomy
The sella turcica is a spherical depression in the superior surface of the sphenoid bone. The sphenoid sinus is inferior and anterior to the sella turcica, the paired cavernous sinuses are lateral, the suprasellar cistern and its contents are superior, and the basilar artery and brainstem are posterior (Fig. 17.1). The pituitary gland, which weighs about 0.5 g in the adult, is the only structure of significance within the sella turcica. The dimensions of the pituitary gland are extremely variable, particularly its height. On average, it is 12 mm in width, 8 mm in anteroposterior diameter, and 3 to 8 mm in height. It achieves its greatest size in adolescent girls and pregnant women because of normal physiologic hypertrophy. At puberty, particularly in girls, the gland enlarges tremendously and may reach 10 mm in height. In boys the increase is more modest, with a height limit of about 8 mm. Even more marked changes occur in pregnancy. The gland increases progressively in size with gestation, reaching its maximum immediately postpartum. The maximum height may be as much as 12 mm, although usually not more than 10 mm. The gland height progressively decreases during the first 8 months after delivery, and the increased T1 signal intensity in the anterior gland normally seen in pregnancy progressively normalizes in the first 12 months after delivery. Termination of lactation has no effect on these changes.
The pituitary gland has anterior, intermediate, and posterior lobes. The intermediate lobe is vestigial in humans and serves no physiologic purpose, but it may be the site of small nonfunctional cysts (pars intermedia cysts). True vestigial pituitary gland cysts are found in 3% to 5% of autopsies (1). The anterior and posterior lobes are distinct organs functionally and embryologically. The anterior lobe, or adenohypophysis, originates from a superior invagination of the Rathke pouch from the fetal nasopharynx. Grossly, it is divided into three parts: the anterior lobe or pars distalis (the largest), the pars tuberalis surrounding the infundibulum, and the pars intermedia lying between the pars distalis and neurohypophysis. The anterior lobe loses all connections to the nasopharynx and develops into a true endocrine organ. The anterior lobe synthesizes many hormones under the influence of hypothalamic stimulatory and inhibitory controls. Adenohypophyseal cells have a definite topographic representation within the gland. Prolactin and growth hormone–secreting cells predominate laterally, whereas cells secreting corticotropin adrenocorticotropic hormone (ACTH), thyroid-stimulating hormone, and follicle-stimulating hormone/luteinizing hormone tend to be located centrally. This is a finding of some importance because the location of microadenomas parallels this distribution. The posterior lobe, or neurohypophysis, arises from the hypothalamus as a down growth into the sella turcica. The posterior lobe retains its connections to the hypothalamus throughout life via the pituitary stalk (the hypothalamohypophyseal tract) and functions only as a reservoir for the hormones, oxytocin and vasopressin (antidiuretic hormone). These hormones are synthesized in the hypothalamus and transported to the neurohypophysis down the axons of the pituitary stalk.
Although functionally distinct, the anterior and posterior lobes are anatomically closely related, apposed to one another within the confines of the sella turcica. The latter is the much smaller of the two lobes and occupies only 10% to 20% of the volume of the sella turcica, almost always in the midline and directly applied to the dorsum sella. The anterior lobe fills the anterior and central portions of the sella turcica and has two lateral wings that extend posteriorly, often to the dorsum sella. On rare occasions the lateral wings of the anterior lobe completely envelop the posterior lobe, so that the posterior lobe assumes a central location within the gland.
The pituitary gland receives its blood supply principally from the hypophyseal portal venous system. Small branches of the internal carotid artery—the inferior and superior hypophyseal arteries—also provide direct arterial supply. The inferior hypophyseal artery supplies the posterior lobe and the lateral surfaces of the anterior lobe, and the superior hypophyseal artery supplies the pituitary stalk and the superior surface of the gland. This combination of arterial and portal venous blood supply explains the differential rates of enhancement of the pituitary gland on dynamic scans after bolus administration of intravenous (i.v.) contrast agents (Fig. 17.2) (2). Within the gland, the vascular pattern is one of a loosely organized network of capillaries. The capillaries are lined by fenestrated endothelium, a characteristic feature of endocrine organs and one that is clearly visible in the pituitary gland. On the venous side, the gland is drained by the cavernous sinuses and afterward by the petrosal sinuses. There is preferential venous drainage of the gland to the ipsilateral cavernous sinus, but because there are extensive intercavernous venous connections anterior, posterior, and inferior to the gland without any valves to restrict directionality of flow, contralateral mixing of venous blood is possible. A variant large intercavernous sinus venous communication can occur along the floor of the sella, and should not be confused for an adenoma (Fig. 17.3A–C).
The anterior and posterior lobes of the pituitary gland are easily distinguished on magnetic resonance imaging (MRI) when typical, high-resolution studies of the pituitary region are obtained. With the exception of the neonate and in pregnancy, the anterior lobe is similar in signal intensity to cerebral white matter on all pulse sequences, whereas the posterior lobe is distinctly hyperintense on T1-weighted images (Figs. 17.1 and
17.2) (3). On administration of i.v. contrast, the anterior lobe, the posterior lobe, and the pituitary stalk all enhance intensely.
17.2) (3). On administration of i.v. contrast, the anterior lobe, the posterior lobe, and the pituitary stalk all enhance intensely.
 FIGURE 17.1 Normal anatomy. The anatomy of the sella turcica and parasellar region is illustrated in coronal (A–D) and sagittal (E) planes. A: High-resolution 3-T coronal T1 FLAIR sequence anterior to pituitary gland: 1, cavernous carotid artery; 2, ophthalmic division trigeminal nerve; 3, optic nerve; 4, oculomotor nerve. B: High-resolution 3-T contrast-enhanced T1-weighted spin-echo sequence through anterior pituitary: 1, A1 segment anterior cerebral artery; 2, supraclinoid internal cerebral artery; 3, oculomotor nerve; 4, abducens nerve; 5, normally enhancing adenohypophysis; 6, trochlear nerve; 7, ophthalmic division trigeminal nerve; 8, maxillary division trigeminal nerve. C: High-resolution 3-T noncontrast coronal T1 FLAIR sequence through posterior pituitary: 1, optic chiasm; 2, infundibulum; 3, intrinsically T1 hyperintense neurohypophysis; 4, precavernous internal carotid artery; 5, sphenoid sinus. D: High-resolution 3-T noncontrast coronal T1 FLAIR sequence at 3 T through hypothalamus: 1, third ventricle; 2, optic tract; 3, oculomotor nerve; 4, hypothalamus. E: Mid-sagittal image from a high-resolution 3-T noncontrast sagittal T1 FLAIR: 1, anterior commissure; 2, chiasmatic recess; *, infundibular recess; 3, optic chiasm; 4, infundibulum; 5, adenohypophysis; 6, neurohypophysis; 7, pineal gland; h, habenular commissure; 8, posterior commissure; 9, superior colliculus; 10, inferior colliculus; 11, cerebral aqueduct; 12, mamillary body; 13, hypothalamus. |
In neonates the anterior lobe has higher signal intensity on T1 weighting than in the adult (Fig. 17.4). At about 2 months of age, the intensity begins to diminish. By about 4 to 6 months of age, it resembles that of the adult (Fig. 17.4). In both pregnancy and in the neonate, lactotroph hypertrophy and increased protein synthesis in the pituitary gland have been proposed as explanations for the high signal.
The material within the posterior lobe responsible for the high signal intensity has long been debated (3,4). Various constituents of the neurohypophysis have been examined, including vasopressin, phospholipid, and neurophysin. The current thought is that the bright signal represents normal storage of vasopressin–neurophysin complex in the posterior lobe (4). One study demonstrated a strong correlation between vasopressin content in the posterior lobe and the signal intensity ratio between the posterior lobe and the pons. Furthermore, the hyperintensity
may not correspond precisely to the entire extent of the posterior lobe. Early postcontrast images in the sagittal plane show enhancement of an area in the posterior sella turcica larger than the posterior lobe hyperintensity visible on noncontrast images. This has led to the suggestion that the hyperintensity on noncontrast MR may only be located in the posterior portion of the posterior lobe, which contains more neurosecretory granules than the anterior part of the neurohypophysis (5). If the high signal on T1 MR is absent on high-resolution images, the list of possible causes includes central diabetes insipidus, persistent hypersecretion of ADH (as in dehydration), and a variety of stalk lesions interrupting the hypothalamic–neurohypophysial system (e.g., neoplasms like germinoma, inflammatory conditions, and in utero interruption with ectopic posterior lobe).
may not correspond precisely to the entire extent of the posterior lobe. Early postcontrast images in the sagittal plane show enhancement of an area in the posterior sella turcica larger than the posterior lobe hyperintensity visible on noncontrast images. This has led to the suggestion that the hyperintensity on noncontrast MR may only be located in the posterior portion of the posterior lobe, which contains more neurosecretory granules than the anterior part of the neurohypophysis (5). If the high signal on T1 MR is absent on high-resolution images, the list of possible causes includes central diabetes insipidus, persistent hypersecretion of ADH (as in dehydration), and a variety of stalk lesions interrupting the hypothalamic–neurohypophysial system (e.g., neoplasms like germinoma, inflammatory conditions, and in utero interruption with ectopic posterior lobe).
 FIGURE 17.2 Normal pituitary gland. Dynamic contrast-enhanced fast spin-echo T1-weighted images. After a bolus injection of intravenous gadolinium–diethylenetriamine penta-acetic acid, six consecutive sets of three images were obtained in the coronal plane every 10 seconds. The middle image of each of these six three-image sets is shown. The order of the images proceeds from top left to bottom right. Note that enhancement occurs first in the pituitary stalk and then in the pituitary tuft (the junction point of the stalk and gland), and, finally, there is centrifugal opacification of the entire anterior lobe. By 60 seconds the entire gland is enhanced. |
The sella turcica and the pituitary gland contained therein are covered by a fibrous sheet of dura, the diaphragma sella. The diaphragma sella is a normal dural structure composed of two layers forming a partial roof over the pituitary fossa. It extends from the tuberculum sella to the dorsum sella (6). The diaphragma sella has a small but variably sized opening (Fig. 17.5), the diaphragmatic hiatus, which allows passage of the pituitary stalk. Above the diaphragma sellae lies the suprasellar cistern. In the axial plane, the cistern resembles a six-pointed star: the interhemispheric fissure is anterior, the interpeduncular cistern is posterior, the paired sylvian fissures are anterolateral, and the ambient cisterns are posterolateral. The suprasellar cistern contains all the vascular anastomoses of the circle of Willis, the optic chiasm and nerves, the inferior hypothalamus, and the pituitary infundibulum with its investing venous plexus.
The pituitary stalk is the central landmark in the suprasellar cistern. It is approximately 2 mm thick, wider superiorly and tapering inferiorly. It slopes forward as it descends from the inferior hypothalamus, through the diaphragma sellae, to insert onto the superior surface of the pituitary gland at the junction of the anterior and posterior lobes. Above the infundibulum, the floor of the third ventricle tapers anteriorly to two pointed recesses: The infundibular recess converges toward the infundibulum, and the supraoptic (or chiasmatic) recess extends inferiorly to the chiasm (Fig. 17.1). In the setting of hydrocephalus, the infundibular recess may dilate and extend into the sella. A congenital dilation of the infundibular recess mimicking an infundibular stalk mass has been described (7). If thick sagittal or paramedian images are obtained, the stalk may appear thickened. On axial images, a thickened infundibulum with fluid attenuation centrally is seen. High-resolution sagittal and axial imaging will rule out a true mass. This normal variant can be distinguished from pathology by its smooth contour, the homogeneous enhancement and uniform thickness of the wall, the gradual downward tapering, and its communication with the third ventricle showing cerebrospinal fluid (CSF) attenuation on all pulse sequences. The optic chiasm is horizontally oriented and is immediately anterior to the pituitary stalk. When viewed from below, the chiasm resembles the letter “X.” Anteriorly, the chiasm divides into the optic nerves; these are closely applied to the inferior surface of the frontal
lobes. Posteriorly, the chiasm divides into the optic tracts. The paired optic tracts pass on either side of the midline stalk and paired mammillary bodies to enter the inferolateral aspect of the thalamus at the lateral geniculate bodies. The signal intensity of the optic chiasm, nerves, and tracts is similar to other compact white matter tracts on MR images.
lobes. Posteriorly, the chiasm divides into the optic tracts. The paired optic tracts pass on either side of the midline stalk and paired mammillary bodies to enter the inferolateral aspect of the thalamus at the lateral geniculate bodies. The signal intensity of the optic chiasm, nerves, and tracts is similar to other compact white matter tracts on MR images.
 FIGURE 17.3 A–C: Intrasellar venous sinus mimicking pituitary lesion. Sagittal T1, coronal T2, and coronal T1 MR images show a variant large intercavernous sinus venous communication (arrows) along the floor of the sella. |
The internal carotid artery (ICA) enters the suprasellar cistern on emerging from the cavernous sinus just medial to the anterior clinoid process. The carotid artery then gives off three medium-sized branches: ophthalmic anteriorly, posterior communicating, and anterior choroidal arteries posteriorly. Finally, the carotid artery terminally bifurcates into the anterior and middle cerebral arteries. The middle cerebral artery turns immediately laterally into the sylvian fissure, whereas the anterior cerebral artery turns medially and traverses the suprasellar cistern along the superior surface of the optic chiasm and nerves, and then anastomoses with the contralateral anterior cerebral artery via the anterior communicating artery. The internal carotid artery, middle cerebral artery, and anterior cerebral artery are easily visualized on MR because of their relatively large caliber and the absence of signal from the rapidly flowing blood in the vascular lumen (“flow void”) (Fig. 17.1). The smaller ophthalmic, anterior choroidal, and posterior communicating arteries are also often visible, particularly with newer high-resolution techniques and with MR angiography (MRA).
The paired cavernous sinuses are located immediately lateral to the sella turcica. These are venous structures that are functionally part of the dural venous system but anatomically are much more complex than any other dural sinus. They extend from the orbital fissures anteriorly to Meckel’s cave posteriorly and consist of an intricate network of small endothelial-lined spaces. They may communicate via a network of intercavernous connections through the sella turcica that are located anterior, inferior, and posterior to the pituitary gland (the “circular sinus”). Laterally, the cavernous sinuses are delineated by a well-defined dural reflection, separating the sinus from the middle cranial fossa. Medially, the dural reflection is weak, comprising only loose fibrous tissue or a thin, single layer of dura. Hence, it is not well visualized at imaging. It may be difficult to distinguish the exact boundary between cavernous sinus and the pituitary gland. On electron microscopy investigations, this medial dural wall is commonly incomplete even in normal subjects, so that normal pituitary tissue is found in the cavernous sinus in between 10% to 30% of subjects (8). The lateral wall of the cavernous sinus contains (from superior to inferior) cranial nerves III, IV, V1, and V2. These cranial nerves are typically recognizable on contrast-enhanced MR as nodular filling defects in the lateral cavernous sinus wall or adjacent to the cavernous carotid artery (Fig. 17.1). In fact, the absence of visualization of cranial nerve–related filling defects in the enhanced cavernous sinus should prompt suspicion of a lesion in the cavernous sinus. Within the sinus the ICA is easily recognized as the largest structure contained therein (Fig. 17.1). Cranial nerve VI is also within the sinus, directly beneath and intimately associated with the internal carotid artery. The appearance of the venous spaces is heterogeneous. Much of the sinus is gray, whereas some parts display a more typical flow void. Presumably, the latter is from larger channels with higher rates of blood flow and the former
from smaller channels with sluggish flow. The entire cavernous sinus, with the exception of the ICA and the cranial nerves, enhances intensely with i.v. contrast administration.
from smaller channels with sluggish flow. The entire cavernous sinus, with the exception of the ICA and the cranial nerves, enhances intensely with i.v. contrast administration.
 FIGURE 17.4 Normal pituitary gland in neonate, infant, and fetus. Sagittal T1-weighted images. A: One-month-old neonate. B: Five-month-old infant. C: Fetus (approximately 20 weeks gestation). The anterior lobe in the neonate (panel A) is isointense to the posterior lobe and much brighter than the brain. Beginning at about 2 months of age, the high signal intensity of the anterior lobe diminishes, and by 4 months (panel B) it is approximately isointense to brain. Note that in the fetus (panel C) the anterior lobe is also very hyperintense. This is expected because the metabolic activity of the fetal gland is similar to that of the neonate. |
Meckel’s cave is closely related to but anatomically distinct from the cavernous sinus. It is a dural invagination that arises from the vertical surface of the anterior wall of the posterior cranial fossa. The orifice through which it communicates with the basal cisterns is inferior to the petroclinoid ligament. It is immediately lateral to the posterior third of the cavernous sinus and houses the trigeminal ganglion. Cranial nerve V3 is identified passing inferolaterally from Meckel’s cave through the foramen ovale directly beneath and slightly lateral to the Meckel’s cave (Fig. 17.1).
 FIGURE 17.5 Neuroanatomy of diaphragma sella. Meningeal structure extends from dorsum to tuberculum sella and allows passage of pituitary stalk from hypothalamus to pituitary gland through an opening that varies in diameter among different patients. (Reprinted with permission from A Campero, AA Campero, C Martins, et al. Surgical anatomy of the dural walls of the cavernous sinus. J Clin Neurosci 2010;1:746–750.) |
Technique
Suspected abnormalities of the pituitary gland and sella turcica are among the most frequent indications for MR. An effective MR protocol that considers image contrast and spatial resolution requirements yet optimizes scanning time is necessary. As in all MR protocols, the overall objective is to obtain the most spatially detailed images in the appropriate plane, best possible signal-to-noise ratio, and highest image contrast within the shortest period of time. The most important goal in imaging a patient suspected of harboring pituitary or suprasellar pathology is most often the identification of the pituitary gland itself and the separation of it, if possible, from the lesion. Therefore, it is essential to use a high-resolution MR protocol that clearly demonstrates the anatomy of this specialized region.
It is generally accepted that the coronal plane is the most useful plane or section for imaging the pituitary gland. This plane allows visualization of the pituitary gland free of partial averaging effects from the carotid arteries, sphenoid sinus, and suprasellar cistern. Coronal images are virtually always considered in conjunction
with an imaging series in the sagittal plane, primarily for display of midline structures. Practically speaking, most scanning protocols start with a sagittal sequence for localization; for patients imaged for suspected pituitary pathology, this initial sagittal sequence should be performed with a high-resolution technique.
with an imaging series in the sagittal plane, primarily for display of midline structures. Practically speaking, most scanning protocols start with a sagittal sequence for localization; for patients imaged for suspected pituitary pathology, this initial sagittal sequence should be performed with a high-resolution technique.
Exact specifications of technique are not provided because the constantly improving capabilities of modern scanners require that technique is continually revised. However, high spatial detail is critical and should be achieved through the use of thin (3 mm or smaller) slices, a fine matrix size, and a relatively small field of view. Requirements for spatial detail need to be balanced against signal-to-noise ratio and imaging time. We prefer to limit individual sequences to 5 to 6 minutes, and certainly no longer than 10 minutes.
The pulse sequence for best tissue contrast and anatomic display in this region is generally accepted to be T1-weighted imaging, although there may still be some controversy as to what sequences are needed in addition to this. Spin echo (SE) methods were the first to gain widespread popularity and continue to be the most widely used. Several groups have shown that short-repetition-time, short-echo-time SE images (i.e., T1 weighted) generate very good contrast for visualizing pituitary pathology (9). Even though high-resolution T1-weighted images are now standard for pituitary pathology, they are not artifact free. An unusual artifact in the sella manifesting as focal T1 hyperintensity has been described in 14% of patients (10). Its presence could potentially obscure a lesion or could be mistaken for substances resulting in T1 shortening such as hemorrhage or protein. The artifact is secondary to focal susceptibility differences among the air-filled sphenoid sinus, bone, and the pituitary fossa soft tissue and is consistently related to the junction between the sphenoidal septum and sellar floor. Hyperintensity along the floor of the pituitary fossa posteriorly may also be due to the normal posterior lobe signal, a useful landmark to seek out for signs of lateral displacement by microadenomas. Compared with T1-weighted images, long–repetition time, long–echo time SE (i.e., T2-weighted) images have been less successful in demonstrating pituitary lesions, in particular small adenomas (9,11). However, there are occasional cases in which only the T2-weighted image has been positive (Fig. 17.6). Because fast spin-echo (FSE) methods are readily available and do not incur the time penalty of conventional T2-weighted SE sequences, T2-weighted FSE imaging is sometimes used as a supplementary sequence for pituitary imaging.
A variety of other pulse sequences have met with varying degrees of success, including inversion recovery and gradient-echo (GE) methods. Multislice inversion recovery sequences have not been widely available and have been infrequently used. Two-dimensional (2D) Fourier transform GE images have been unsuccessful primarily because of the marked susceptibility artifacts generated from the interface between the skull base and air-containing sphenoid sinus. On the other hand, 3D Fourier transform GE images have achieved greater success; these have been found to provide results comparable with T1-weighted SE methods (12). They have the advantage of thinner slices compared with conventional 2D Fourier transform SE methods, yielding better spatial resolution. In addition, the voxels are more nearly isotropic, and truly contiguous slices are possible. However, they are prone to motion and truncation artifacts in the two dimensions that are phase encoded. Patronas et al. (13) reported improved visualization of ACTH-secreting adenomas with the use of spoiled gradient recalled acquisition over SE T1 imaging.
Paramagnetic contrast-enhanced images are widely used and can be very helpful in this region. Although most adenomas are visible without the injection of i.v. contrast, several studies have shown that small adenomas may become visible only after contrast injection (14). Many radiologists, including ourselves, have reduced the amount of contrast used for the investigation of pituitary adenomas to half the usual dose (to 0.05 mmol/kg). It has been demonstrated that half-dose studies have comparable results to full-dose studies in terms of pituitary gland opacification and microadenoma detection (15). Although full-dose and double-dose studies have demonstrated a greater absolute signal intensity difference between gland and lesion, the ratio of gland to lesion signal is similar when comparing half-dose, full-dose, and double-dose results. The greater absolute gland to lesion signal differences may improve lesion detection and characterization, but whether this is clinically relevant is unknown. It can be argued, on the other hand, that the MR workup for hyperprolactinemia, the most common clinical impetus for imaging the pituitary, is mainly performed for the purpose of excluding disease other than pituitary microadenoma because at least in some centers the treatment of choice is medical rather than surgical. This would make the identification of the microadenoma less important, hence reducing the need for i.v. contrast for the pituitary gland itself. On the other hand, many institutions include post–gadolinium enhanced images of the brain, thereby
making it more important to use the full, standard dose of contrast agent.
making it more important to use the full, standard dose of contrast agent.
 FIGURE 17.6 Pituitary microadenoma. T1-weighted (A) and T2-weighted (B) images. In this case only the T2-weighted image was positive. Although it is unusual to detect microadenomas on T2-weighted images that are occult on T1-weighted images, these situations do occur. The widespread availability of T2-weighted fast spin echo images may make T2-weighted images a more common part of pituitary examinations to cover cases such as these. |
Because of the differential rates of contrast enhancement between adenomas and normal pituitary gland, lesion conspicuity can be optimized by scanning immediately after administration of the contrast agent. Immediately after contrast injection, most adenomas will appear as relatively nonenhancing (dark) lesions within an intensely enhancing pituitary gland. However, soon afterward this image contrast begins to dissipate, and the adenoma may no longer be detectable. The development of faster and faster imaging sequences has generated some renewed interest in “dynamic imaging” of the pituitary gland. Dynamic imaging sequences may have temporal resolution as fast as 1 to 2 seconds per set of images, although protocols range from images every second to images every minute (16,17,18). Our experience with dynamic scanning has shown that the contrast enhancement behavior of microadenomas is inconsistent from case to case. Some microadenomas display the most lesion-to-gland contrast on unenhanced scans. With these, the image contrast begins to diminish the moment the contrast-enhancing agent arrives in the pituitary gland. In about 20% of cases, the maximum image contrast between normal pituitary tissue and microadenomas is attained about 30 to 50 seconds after the bolus injection of i.v. contrast, whereas others have the best image contrast 1 to 2 minutes after contrast agent injection (16). Thus, the best images for microadenoma detection vary from the unenhanced images, the 30- to 50-second dynamic-enhanced images, to the conventional enhanced images. When we use dynamic imaging techniques, our preference for dynamic scanning is a modified T1-weighted FSE method with 10-second temporal resolution (16). We found an incremental yield in microadenoma detection of about 10% above and beyond that detected on a combination of plain and conventional contrast-enhanced MR (Fig. 17.7). Gao et al. (17) found that adding a sagittal dynamic study in addition to the traditional coronal study increased lesion detection, with an overall detection rate of 89%. Faster dynamic sequences with temporal resolution of 5 to 10 seconds have demonstrated an early component of enhancement in microadenomas not visible on sequences with slower resolution. These fast images have shown that some microadenomas have subtle enhancement early, at about the same time as the posterior lobe and long before the anterior lobe. This confirms earlier computed tomography (CT) work of Bonneville and supports the conclusion that these adenomas have a direct arterial supply from branches of the carotid artery and therefore would not be subject to the normal regulatory influences of the hypothalamus via the portal venous system (18). Dynamic imaging may also be helpful in characterizing lesions adjacent to the pituitary gland, such as meningiomas or cavernous malformations, due to the differential enhancement patterns.
Delayed scans (i.e., longer than 30 minutes after contrast injection) occasionally may demonstrate a reversal of this image contrast. As the contrast agent diffuses into the adenoma, the adenoma becomes hyperintense and the intensity of the normal pituitary gland fades, allowing the adenoma to stand out as a hyperintense focus. Unfortunately, delayed scans are not practical because they require that the patient either wait in the scanner or return for reexamination 30 to 60 minutes later. Thus, they are infrequently used.
Our current practice is to perform unenhanced T1-weighted SE sagittal and coronal sequences. If these are positive for an intrapituitary lesion, the examination stops. If they are negative or equivocal, a bolus of i.v. contrast is given synchronously with the beginning of a dynamic T1-weighted FSE sequence. At the completion of the dynamic study, we immediately proceed to a conventional T1-weighted SE sequence. If these are negative, equivocal, or discordant with one another or if there is evidence of a suprasellar or hypothalamic lesion, T2-weighted images are obtained; otherwise, the examination ends. In a less monitored situation, after high-resolution T1-weighted imaging through the pituitary fossa, the remainder of the brain is always scanned using T2-weighted imaging, and finally, postcontrast
T1-weighted coronal and sagittal images of the pituitary are obtained.
T1-weighted coronal and sagittal images of the pituitary are obtained.
 FIGURE 17.7 Microadenoma using dynamic contrast-enhanced magnetic resonance. Serial images of the pituitary during the passage of intravenous contrast only clearly demonstrate the focal microadenoma early after the contrast was given. Note that before contrast (first image) and late after contrast (last image), there is no clear evidence of a focal pituitary lesion. |
 FIGURE 17.8 Pituitary microadenoma, 3-T versus 1.5-T imaging. Note the left-sided microadenoma on 3-T T1-weighted (A) and T2-weighted (B) images. The lesion is less identifiable on 1.5-T images (C,D). |
Magnetization transfer techniques provide tissue contrast dependent mainly on the concentration of macromolecules, quantified by the magnetization transfer rate (MTR). The MTR of the normal pituitary varies with age. The MTR has been shown to be higher in prolactin-secreting or growth hormone–secreting adenomas compared to normals and lower in nonsecreting adenomas compared to normals (19).
The ultimate clinical role of 3-T pituitary and sellar imaging continues to evolve and further clarification of the use of newer sequences is required (Fig. 17.8). The images offer improved image quality and spatial resolution, which is important in conditions with subtle differences between normal and abnormal tissues, although there can be more magnetic susceptibility–related signal loss in proximity to air-filled sphenoid sinus. One study demonstrated better preoperative localization of pituitary of pituitary macroadenomas in Cushing’s disease with 3-T compared to 1.5-T MRI (20). Greater clarity of the intracavernous cranial nerves, assessment of the pituitary stalk, and subtle changes in gland volume have been demonstrated (21,22). Greater accuracy at detecting cavernous sinus invasion compared to 1.5-T imaging has been reported. Improved image quality with better definition of the borders of sellar lesions and delineation of cranial nerves was achieved with a 3D GE sequence compared to an SE sequence on contrast-enhanced T1-weighted image at 3 T (23).
Congenital Abnormalities
Pituitary Gland Hypoplasia
Congenital abnormalities of the pituitary gland and hypothalamus are often associated with anomalies of other midline cranial, orbital, and facial structures, such as the optic nerves, septum pellucidum, osseous skull base, and palate. In many cases there is a small, shallow sella turcica (Fig. 17.9). Pituitary and hypothalamic dysfunctions are most often recognized clinically by growth failure, which occur with variable frequencies in these conditions. The hypoplastic pituitary gland itself may be recognized on CT as a smaller than normal soft tissue intrasellar density, but it is otherwise normal in position and shape. MR displays the gland to better advantage and confirms the existence of a small but otherwise normal-appearing gland and pituitary stalk (Fig. 17.10).
A group of congenital pituitary deficiency disorders has become apparent with the widespread use of MR (24). A number of patients with short stature and growth hormone deficiency (GHD) have highly characteristic features on MR. Many of these patients have additional anterior pituitary hormone deficiencies. The MR findings consist of the following: small sella turcica, small anterior pituitary gland, absence of the usual high signal intensity from the posterior pituitary gland, absence or hypoplasia of the distal pituitary stalk, and an anomalous high-signal area in the proximal pituitary stalk (Fig. 17.11). Other findings that may be part of the midline anomaly spectrum include optic
nerve hypoplasia, Chiari I malformation, and medial deviation of the carotid arteries (25). Many of these patients have a history of breech presentation at birth, some have other intracranial midline anomalies, and some have both midline anomalies and a history of breech presentation. Patients with all of the foregoing findings tend to have multiple pituitary hormone deficiencies.
nerve hypoplasia, Chiari I malformation, and medial deviation of the carotid arteries (25). Many of these patients have a history of breech presentation at birth, some have other intracranial midline anomalies, and some have both midline anomalies and a history of breech presentation. Patients with all of the foregoing findings tend to have multiple pituitary hormone deficiencies.
 FIGURE 17.9 Undeveloped sella turcica. A: Sagittal T1-weighted image and (B) coronal T1-weighted image. A suprasellar enhancing mass was incidentally “discovered” on a computed tomography scan of this teenaged boy (not shown). A presumptive diagnosis of craniopharyngioma was made, and the boy was referred to magnetic resonance imaging before biopsy. The magnetic resonance image shows that the sella turcica is extremely shallow. The pituitary gland is situated in the suprasellar cistern but otherwise appears normal in morphology and is easily recognized on the sagittal images because of the characteristic high signal intensity in the posterior lobe. A diagnosis of a “normal suprasellar pituitary gland” was made, and the biopsy was canceled. |
Two theories have emerged to explain the MR findings and the associations with breech deliveries and midline anomalies. One theory presumes that the head “trauma” associated with breech delivery causes rupture of the pituitary infundibulum with its investing vascular plexus as the stalk is stretched between the pituitary gland (which is fixed to the skull base) and the more mobile brain. This theory does not adequately explain the associated midline anomalies because these develop long before birth. The alternate theory invokes early fetal maldevelopment of midline structures, including the fetal hypothalamic–pituitary axis, with failure of the neurohypophysis and its investing vascular plexus to descend completely into the sella turcica and come into contact with the adenohypophysis (26,27). Anterior lobe dysfunction results because the anterior lobe is deprived of part of its blood supply (via the portal veins) and also is deprived of hypothalamic-stimulating hormones (also normally transmitted via the portal veins). Proponents of the latter theory suggest that fetal position and the normal progress of labor require a normally functioning fetal pituitary gland. If the fetal gland is dysfunctional, breech presentation and delivery may result. Thus, this theory can explain the associations with both breech presentations and midline anomalies.
 FIGURE 17.10 Pituitary hypoplasia. Midline sagittal T1-weighted image. This young adult had a history of hypopituitarism dating from infancy. The sella turcica is shallow and reduced in anteroposterior diameter. The high signal intensity of the posterior lobe is easily identified in the posterior half of the sella turcica (arrow). The anterior lobe is a vestige of its normal size and is visible as a tiny remnant of tissue in the anteroinferior portion of the sella turcica (curved arrow). The semilunar high-intensity structure dorsal to the pituitary gland is the dorsum sella. The small sella turcica distinguishes pituitary hypoplasia from an “empty sella” wherein the sella is normal or large in size. |
Regardless of which etiology is correct, the resultant functional and morphologic derangement can be understood on the basis of the failure of hypothalamic axons and surrounding venous plexus to connect in the normal fashion with the adenohypophysis. With failure of this connection to develop, the anterior lobe is deprived of hypothalamic-stimulating factors and some of its blood supply. The deficiency of anterior lobe hormones is thus not surprising. On the other hand, posterior lobe function is preserved in this condition. The most plausible explanation is that the neurosecretory vesicles normally transported to the posterior lobe from their synthetic site in the hypothalamus are simply dammed up above the level of the stalk discontinuity, usually in the proximal portion of the stalk. This “ectopic” location functions as the posterior lobe and is represented on MR as the high-signal area. This “regeneration” of an ectopic posterior lobe is known to occur in animal experiments after distal stalk transection, and a similar high-signal nodule often becomes apparent after pituitary surgery (28). If an anatomically normal posterior lobe develops at all (i.e., within the sella turcica), it is depleted of neurosecretory vesicles and does not have its normal high signal. Diagnostically, these findings are specific for this disorder. The high signal intensity in the suprasellar cistern should not be misinterpreted as a craniopharyngioma or other suprasellar or hypothalamic mass. Note that this high signal is distinct on MR from other high signal lesions on T1, like fat in hypothalamic lipoma (Fig. 17.12), since ectopic posterior lobe signal does not diminish with fat suppression and does not show chemical shift artifact. Pathologic confirmation of the nature of the tissue in the bright nodule was described in a report by Kaufman et al. (29). In this case a patient with anterior pituitary deficiencies was discovered
to have a retrochiasmatic mass and no tissue in the sella. Biopsy of the mass revealed normal pituitary stalk tissue. Those authors recommend that the term “posterior pituitary ectopia” should not be used to describe the suprasellar tissue because the tissue more closely resembles the pituitary stalk than the posterior lobe.
to have a retrochiasmatic mass and no tissue in the sella. Biopsy of the mass revealed normal pituitary stalk tissue. Those authors recommend that the term “posterior pituitary ectopia” should not be used to describe the suprasellar tissue because the tissue more closely resembles the pituitary stalk than the posterior lobe.
 FIGURE 17.11 Ectopic posterior pituitary in growth hormone–deficient dwarfism (two cases). A: Sagittal T1-weighted image. The sella turcica is extremely small and contains virtually no pituitary tissue. The entire pituitary stalk is absent. There is a focal area of high intensity at the proximal infundibulum demarcating the ectopic location of the posterior pituitary lobe. This combination of findings is specific for this diagnostic entity. B: Coronal T1-weighted image. The high-intensity nodule is visualized at the level of the infundibular recess directly between the optic tracts. The distal stalk is absent, and the sella turcica is small and shallow. C,D: A second example of the same disorder. |
 FIGURE 17.12 Nodular hypothalamic lipoma with extension posteriorly is fat signal on both T1 (A) and T2 (B), and confirmatory chemical shift artifact is also present (B), a distinguishing this high signal from that seen in ectopic posterior pituitary. After contrast, relationship of lipoma to enhancing, normal pituitary stalk is clear (C). |
A classification scheme has been proposed that divides GHD patients into three groups based on morphology as defined on MR (27). The first group in this scheme has the most severe morphologic derangement, consisting of posterior lobe “ectopia,” aplasia of the stalk, and hypoplasia of the anterior lobe. These patients are most likely to have or to develop multiple pituitary hormone deficiencies. It is proposed that the underlying cause is developmental, probably early in fetal life. The second group demonstrates only anterior lobe hypoplasia. The cause may be a perinatal event or birth trauma or a less severe developmental defect. The third group has normal morphology on MR and the mildest clinical and biochemical deficits; derangement of neuroendocrine mechanisms controlling growth hormone (GH) secretion is the proposed mechanism. MR may also have a role in determining the prognosis of patients with GHD by establishing which patients are at risk for developing multiple pituitary hormone deficiencies versus those who are likely to have only isolated GHD.
Patients who have received radiation treatment to the sella region may develop acquired GHD (30). This may be reflected as a significant decrease in the normal height of the pituitary gland. The cause is unknown, but several theories have been proposed. It may be secondary to sublethal damage affecting the cells undergoing mitosis and consequent death. Alternatively, radiation therapy may interfere with the vascular supply to the pituitary, which could subsequently cause hormonal deficiencies.
Pituitary Duplication
Rarely, the pituitary gland and infundibulum may be duplicated. It may arise as part of the median cleft-lip syndrome or may be secondary to partial twinning. The median cleft-lip syndrome, also known as frontonasal dysplasia, consists of hypertelorism, various forms of midfacial clefting, broad nasal root, low V-shaped frontal hairline, and cranium bifidum occultum frontale (31). The MR appearance has been documented in case reports demonstrating duplicated infundibula, pituitary bright spots, and anterior lobes (32). Associated malformations are numerous (Fig. 17.13) and include development abnormalities of the tongue, hydrocephalus, abnormalities of the circle of
Willis, posterior cranial fossa abnormalities, agenesis of the corpus callosum, spinal abnormalities, thickening or hamartoma of the hypothalamus, nasopharyngeal and oral dermoids, absence of the anterior commissure, absence of the olfactory bulbs and tracts, and basilar artery duplication or fenestration (33,34).
Willis, posterior cranial fossa abnormalities, agenesis of the corpus callosum, spinal abnormalities, thickening or hamartoma of the hypothalamus, nasopharyngeal and oral dermoids, absence of the anterior commissure, absence of the olfactory bulbs and tracts, and basilar artery duplication or fenestration (33,34).
 FIGURE 17.13 Sagittal T1 (A,B) shows absence of identifiable sella and no evidence of midline pituitary stalk or gland. Also note linear pericallosal lipoma, nodular hypothalamic mass, absence of midline basilar artery, abnormal configuration of clivus and cervical vertebrae, and cleft palate with heterogeneous fatty tissue going through palatal defect (double arrows). Coronal T1 images (B1–B4 from anterior to posterior) clearly define cleft palate (double arrows) with duplicated pituitary infundibulae going to laterally situated and separated duplicated pituitary glands (single arrows) with abnormally wide separation of cavernous carotid arteries. Axial T2 images (C1,C2) redemonstrate separated duplicated pituitary glands with their stalks (arrows). Also note midline septum from pons and midbrain (highlighted by CSF in interpeduncular cistern) separating the long fenestration or partial duplication of the basilar artery, also shown by coronal T2 (D). Nodular hypothalamic mass best seen on coronal (B and D). |
“Empty Sella Turcica”
The “empty sella turcica” refers to an anatomic finding of a severely flattened but still present pituitary gland (Fig. 17.14). The term “empty sella” arises because the superior portion of the sella turcica appears empty (it is actually filled with CSF). The diaphragma sella is thin, and the diaphragmatic hiatus is enlarged. In many cases the volume of the sella turcica is expanded. It is the deficiency of the diaphragma that is the primary defect. This allows the suprasellar cistern to herniate into the sella, exposing it to CSF pulsation and eventually resulting in enlargement of the sella turcica.
Patients with an empty sella may have symptoms referable to the area of the sella turcica such as endocrine dysfunction, CSF
rhinorrhea (35), or visual field loss (36). However, these clinical findings are all rare compared with nonspecific complaints such as headache, memory loss, and dizziness. Most frequently, the empty sella is an incidental finding of little or no clinical significance. It may also follow ischemic necrosis of the pituitary, such as in Sheehan syndrome (Fig. 17.15).
rhinorrhea (35), or visual field loss (36). However, these clinical findings are all rare compared with nonspecific complaints such as headache, memory loss, and dizziness. Most frequently, the empty sella is an incidental finding of little or no clinical significance. It may also follow ischemic necrosis of the pituitary, such as in Sheehan syndrome (Fig. 17.15).
 FIGURE 17.14 Empty sella turcica. On necropsy specimen, a midline sagittal section through the sella turcica shows the pituitary gland compressed into a semilunar-shaped layer of tissue along the floor of the sella turcica. |
The finding of an empty sella turcica is particularly common on MR, in no small part because of the frequent use of T1-weighted sagittal images and the ease of visualization of the pituitary gland, stalk, and sella turcica. Moreover, this “diagnosis” varies in frequency with the radiologist because it is a judgment call as to when the pituitary fossa appears “empty.” In these cases, the pituitary gland is variably flattened; frequently, it is only a thin rim of tissue along the sella floor (Fig. 17.16). The only differential diagnosis is that of an arachnoid cyst occupying the superior portion of the sella turcica. It is important to determine the position of the pituitary stalk to distinguish these entities. In the empty sella, the stalk is normal in position, whereas space-occupying cysts cause it to be obliterated or displaced.
 FIGURE 17.15 Empty sella turcica, panhypopituitarism after Sheehan syndrome. Sagittal (A) and coronal (B,C) T1-weighted images show an enlarged pituitary fossa with no evidence of anterior pituitary tissue. Note that the posterior lobe is still identifiable (panel B). |
 FIGURE 17.16 Empty sella turcica, incidental finding. Sagittal T1-weighted image. The sella turcica is enlarged and filled with cerebrospinal fluid from the suprasellar cistern. The pituitary gland is flattened along the floor of the sella turcica. Of importance is that the pituitary stalk can be visualized in its entire course from the hypothalamus to the floor of the sella, thereby excluding the presence of an intrasellar cyst. Incidental sphenoid sinus mucus retention cyst below the sella. |
Cephaloceles
Cephaloceles are herniations of the meninges (“meningocele”) or of the meninges and brain (“meningoencephalocele” or simply “encephalocele”) through a developmental defect in the cranium. Cephaloceles in the sellar region, or “trans-sphenoidal encephaloceles,” are very rare; their estimated incidence is 1 per 700,000 live births. Most of these are associated with other midline anomalies, particularly agenesis of the corpus callosum. Children with trans-sphenoidal encephaloceles present with craniofacial deformities, CSF rhinorrhea, or meningitis;
patients reaching adulthood experience hypothalamic–pituitary dysfunction or chiasmatic syndromes because of herniation of the pituitary gland and/or optic chiasm into the hernial sac (37).
patients reaching adulthood experience hypothalamic–pituitary dysfunction or chiasmatic syndromes because of herniation of the pituitary gland and/or optic chiasm into the hernial sac (37).
 FIGURE 17.17 Sagittal T1 (A) and axial T2 images (B) demonstrate absence of normal pituitary region with herniation of optic chiasm, thin pituitary stalk, brain, and surrounding CSF through expected sphenoid sinus and palatal defect. Also note dysgenesis of corpus callosum splenium and rostrum. |
MR clearly demonstrates the aberrant anatomy particularly well because of the ability to distinguish solid and fluid components within the hernial sac and identifies the specific structures within the sac (Fig. 17.17). With MR, it is important to assess accurately the position of the optic chiasm, pituitary gland, and aberrant vessels in patients that develop CSF leaks or progressive visual loss—these patients require surgical repair of their skull base defects, and it is essential to have knowledge of the position of these vital structures preoperatively. High-resolution T1-weighted and T2-weighted images outline the CSF component, the contents of the cephalocele, and in defining the composition of the herniated tissue as brain parenchyma.
Tumors
Pituitary Microadenoma
Pituitary adenomas are slow-growing benign neoplasms of epithelial origin that arise from the adenohypophysis. They are the most common tumors of the sella turcica. In clinical series they represent 10% to 15% of all intracranial neoplasms. Their estimated incidence of pituitary adenomas varies between 1.5% and 31% at biopsy, with an average frequency of 10.7% in studies which examined a total of 18,907 pituitaries (38). A meta-analysis involving 3,577 patients from 10 studies revealed an overall pituitary adenoma prevalence of 16.7%: 14.4% at autopsy and 22.5% at imaging studies (CT and MRI) (39). Imaging studies yielded a pituitary macroadenoma prevalence of 0.16 to 0.20% (39). In distinction from Rathke cleft cysts, pituitary adenomas are predominantly tumors of adulthood. Virtually all pituitary tumors are benign adenomas, but on rare occasions adenohypophyseal cells give rise to carcinoma. The histologic criteria of malignancy are not well established, and the morphologic diagnosis is often difficult. Cellular pleomorphism and mitotic figures indicate a rapid growth rate but can be apparent also in benign tumors. Invasion of adjacent tissue is not regarded as unequivocal proof of malignancy. Conventionally, the diagnosis of carcinoma is used only when distant metastases occur (39).
Pituitary adenomas are usually well-demarcated lesions that are separated from the normal pituitary gland by a pseudocapsule of compressed tissue containing condensed reticulin; there is no true fibrous capsule (Fig. 17.18). In some instances the margins of the adenoma are poorly defined, the pseudocapsule is not well formed, and nests of adenoma cells extend into the “normal” gland adjacent to the lesion. Of incidentally discovered pituitary adenomas larger than 2 mm at autopsy, 85% were situated in the lateral wings of the gland (Fig. 17.19) (39). Furthermore, of all laterally situated masses in that study, 74% were pituitary adenomas.
 FIGURE 17.18 Pituitary microadenomas. A: This 3- to 4-mm microadenoma is located just to the right of the midline. Its coloration is different from that of normal anterior lobe tissue, thereby clearly demarcating it from the normal anterior lobe. However, the external contours of the gland are not deformed in any way; therefore, the detection of an adenoma of this size usually requires an imaging method that provides good image contrast between normal and abnormal tissue. (Courtesy of Dr. Sylvia Asa, Mount Sinai Hospital, Toronto, Canada.) B: This is a larger adenoma, approximately 9 mm in diameter and occupying about 60% of the volume of the pituitary gland. Although the lesion does not have a true capsule around it, compression of pituitary tissue by the tumor creates an apparent pseudocapsule. Lesions of this size almost always distort the external contours of the gland, as is apparent in this case. |
Pituitary adenomas are conveniently classified by size; those less than 10 mm in diameter are considered micro adenomas (Fig. 17.18), and those over 10 mm are macro adenomas (Fig. 17.20). Clinically, it has become the convention to subdivide each of these according to the presence or absence of and type of hormonal activity with terms such as “prolactin microadenoma” and “nonfunctional macroadenoma.” The use of electron microscopy and immunocytology has enabled an even more refined classification scheme based on hormone production, cell of origin, and fine subcellular structural features.
The clinical presentation of pituitary adenomas depends on the size of the lesion, the presence or absence of hormonal activity, the type of hormone produced, and the degree of extrasellar extension. Approximately 25% of patients with pituitary adenomas have “nonfunctioning tumors”; the remaining 75% display clinical signs or symptoms of hormone excess. In general, hormonally active adenomas usually present earlier in the course of their evolution with signs and symptoms of endocrine hyperfunction. The most common of these is the prolactinoma, a tumor that originates from prolactin-secreting cells (lactotrophs) of the adenohypophysis and accounts for approximately 50% of hormonally active adenomas. Prolactin hypersecretion may result in amenorrhea, galactorrhea, infertility, loss of libido, or impotence. In men and postmenopausal women, the effects of elevated prolactin levels are less conspicuous. The tumors often present only when they are large and cause dysfunction of the normal pituitary gland or optic tract through compression.
 FIGURE 17.19 Incidental pituitary microadenoma at autopsy with cystic degeneration is seen within the lateral wing of the gland. (From Teramoto A, Hirakawa K, Sanno N, et al. Incidental pituitary lesions in 1000 unselected autopsy specimens. Radiology 1994;193:161–164, with permission.) |
Elevated prolactin levels are not always due to increased production by a hormonally active adenoma. Any process that interferes with the production, release, or pituitary portal venous transport of prolactin-inhibiting factors from the hypothalamus will result in hyperprolactinemia because of disinhibition of normal prolactin cells. This is most commonly due to suprasellar tumors that compress the hypothalamus or pituitary stalk (“stalk section effect”), certain drugs (particularly phenothiazines), and primary hypothyroidism. Nevertheless, the degree of hyperprolactinemia caused by these latter processes is at most moderate; serum prolactin levels above 150 ng/mL are almost always due to an underlying autonomously secreting adenoma (normal serum prolactin less than 20 ng/mL). However, the converse is not true because many patients with prolactinomas have serum prolactin levels between 20 and 150 ng/mL.
The next most prevalent hormonally active adenomas are those that produce GH and ACTH. They are of approximately equal incidence. Tumors arising from growth hormone–secreting cells (somatotrophs) cause acromegaly in adults and gigantism in children; those arising from ACTH-producing cells (corticotrophs) produce Cushing disease, the most serious of the endocrinopathies. Cushing disease is more common in women (75%), and the high morbidity is usually due to the complications of prolonged hypercortisolism. Nelson syndrome is also caused by ACTH hypersecretion; it results from continued growth of an ACTH-producing pituitary adenoma in an adrenalectomized patient. Continued secretion of ACTH results in stimulation of cutaneous melanocytes with resultant hyperpigmentation. Adenomas causing Nelson syndrome are often large and extend outside the sella when discovered (Fig. 17.21). Rarely, adenomas arise from thyrotrophs (thyroid-stimulating
hormone secreting) or gonadotrophs (follicle-stimulating hormone and/or luteinizing hormone secreting). In addition, approximately 10% are plurihormonal adenomas that secrete more than one type of pituitary hormone. The prolactin–GH adenoma is the most common of the plurihormonal adenomas.
hormone secreting) or gonadotrophs (follicle-stimulating hormone and/or luteinizing hormone secreting). In addition, approximately 10% are plurihormonal adenomas that secrete more than one type of pituitary hormone. The prolactin–GH adenoma is the most common of the plurihormonal adenomas.
 FIGURE 17.20 Pituitary macroadenomas on necropsy examination. A: A view of the intracranial surface of the skull base with the brain removed. A large adenoma is spilling out of the sella turcica with compression of adjacent structures. B: Coronal section (different case). This large adenoma is compressing the optic chiasm. |
In contrast to hormonally active tumors which typically present with signs and symptoms related to elevated levels of specific hormones, nonfunctional pituitary adenomas present because of compression or invasion of structures adjacent to the adenoma. These adenomas are usually large and have grown superiorly into the suprasellar cistern, laterally into the cavernous sinus, or inferiorly into the sphenoid sinus by the time of clinical presentation. Compression of the optic nerve, chiasm, or optic tract produces visual disturbances. Further growth superiorly compresses or distorts the third ventricle. Obstruction at the foramen of Munro results in hydrocephalus. Lateral extension with invasion or compression of the cavernous sinus can result in cranial nerve palsies with diplopia and facial sensory disturbances, but this is infrequent. Compression of normal pituitary tissue causes anterior pituitary gland failure. Interference with neurohypophyseal function can cause diabetes insipidus, but this is a very rare and late finding in pituitary adenomas (H.S. Smyth, personal communication). Rarely, a pituitary adenoma may present acutely with pituitary apoplexy because of intratumoral hemorrhage (see Pituitary Apoplexy).
 FIGURE 17.21 Nelson syndrome. Contrast enhanced coronal T1-weighted image. This patient had both adrenal glands resected several years before this scan for uncontrolled hypercorticalism. Increasing skin pigmentation was documented. Recurrent adenoma after repeated transsphenoidal surgeries. This image demonstrates the presence of a recurrent right-sided adenoma extending laterally toward the cavernous sinus (arrows). |
The MR image of the pituitary adenoma is characterized by evidence of a lengthening of both T1 and T2 relaxations when compared with normal pituitary tissue. In 80% to 95% of cases, T1-weighted images of pituitary microadenomas show a focal hypointense lesion within an otherwise homogeneous adenohypophysis (Figs. 17.22–17.24) (9). The remainder is isointense or hyperintense. Small isointense adenomas constitute the majority of false-negative MR examinations. Many of these can be detected on contrast-enhanced MR studies (Fig. 17.25). Hyperintensity reflects the presence of old blood in the tumor (Fig. 17.26). About one-third to one-half of microadenomas are hyperintense with T2 weighting; most of the remainder are isointense (Fig. 17.22) (9).
The T1-weighted sequence is the more reliable for microadenoma detection than the T2-weighted sequence. On both T1- and T2-weighted images the differential signal intensity between normal and abnormal tissues is often subtle. It is, therefore, important to scrutinize the gland at narrow display windows to avoid overlooking the abnormality (Fig. 17.27). As a general rule, the contrast between adenoma and normal tissue is equal to that between gray and white matter; on T1-weighted images the adenomatous tissue is isointense to adjacent temporal lobe gray matter, whereas normal pituitary tissue is isointense with temporal lobe white matter.
There are no imaging features definitively to distinguish the various types of microadenomas from each other, although one can often suggest the diagnosis in the presence of certain findings. ACTH-secreting microadenomas are on average the smallest of all adenomas (mean size, 3 mm) (Fig. 17.28). All hormonally active adenomas have a certain topographic bias within the gland that parallels the distribution of the normal secretory cells. Therefore, prolactin and GH microadenomas have a predilection to a lateral position within the gland, whereas ACTH, thyroid-stimulating hormone, and luteinizing hormone/follicle-stimulating hormone microadenomas tend to be centrally located (Figs. 17.29 and 17.30). GH microadenomas tend to demonstrate infrasellar extension rather than suprasellar extension (40). GH-secreting adenomas are histologically classified as densely or sparsely granulated. T2 hypointensity is seen more commonly in GH-secreting adenomas, and this finding is almost exclusive to the densely granulated type
(Fig. 17.31) (40). Laterally placed lesions are often accompanied by unilateral contour deformities of the gland such as an eccentric bulge of the superior or inferior surface of the gland and contralateral deviation of the pituitary stalk (Fig. 17.32). A more reliable sign, however, is the internal change in signal intensity of the gland relative to the microadenoma. On occasion, the stalk may actually deviate toward the side of the adenoma (Fig. 17.33). Almost half of all patients undergoing MR have tilt of the pituitary stalk, even those without any symptoms referable to the pituitary gland. Tilt of the stalk is, therefore, a poor lateralizing sign of intrapituitary pathology. The tilt of the stalk is usually due to developmental lateral eccentricity of the pituitary gland in relationship to the midline of the brain. Some cases of tilt are due to eccentric insertion of the infundibulum off the midline of the gland.
(Fig. 17.31) (40). Laterally placed lesions are often accompanied by unilateral contour deformities of the gland such as an eccentric bulge of the superior or inferior surface of the gland and contralateral deviation of the pituitary stalk (Fig. 17.32). A more reliable sign, however, is the internal change in signal intensity of the gland relative to the microadenoma. On occasion, the stalk may actually deviate toward the side of the adenoma (Fig. 17.33). Almost half of all patients undergoing MR have tilt of the pituitary stalk, even those without any symptoms referable to the pituitary gland. Tilt of the stalk is, therefore, a poor lateralizing sign of intrapituitary pathology. The tilt of the stalk is usually due to developmental lateral eccentricity of the pituitary gland in relationship to the midline of the brain. Some cases of tilt are due to eccentric insertion of the infundibulum off the midline of the gland.
 FIGURE 17.22 Pituitary microadenoma with focal hypointensity and mass effect. A,B: Coronal T1-weighted images. There is a distinct 6-mm hypointense lesion in the right side of the pituitary gland (small arrows). There is also distortion of the gland contour and displacement of the stalk and posterior lobe to the opposite side (panel B). This is the typical appearance of a pituitary microadenoma. Most adenomas are not high-contrast lesions, and relatively narrow windows must be used to demonstrate the margins of the adenoma. |
 FIGURE 17.23 Prolactinoma with a normal superior contour of the pituitary gland. Coronal (A) and sagittal (B) T1-weighted images show focal 4-mm lesion in the far right side of the pituitary fossa (arrows). Hypointensity relative to the normal gland is typical. |
 FIGURE 17.24 Prolactinoma with a normal contour of the gland on both precontrast and postcontrast images. Coronal precontrast (A) and postcontrast (B) T1-weighted images show a focal 3-mm lesion in the lateral aspect of the gland (arrows) with normal morphology of the pituitary gland. The lesion shows relative lack of enhancement (panel B) but is clearly visible before contrast administration (panel A). |
 FIGURE 17.25 Prolactinoma with an abnormal contour of the gland but a normal signal on T1- and T2-weighted images. Coronal precontrast T1-weighted (A) and T2-weighted (B) images demonstrate a focal 7-mm mass in the left side of the pituitary gland. The lesion is isointense to the rest of the gland. Postcontrast T1-weighted image (C) shows a clear nonenhancing adenoma in the pituitary gland. |
 FIGURE 17.26 Prolactinoma with hemorrhage. Coronal T1-weighted image (A) shows a focal left-sided pituitary hyperintense mass (arrow). This patient presented with hyperprolactinemia. There was no clinical episode suggestive of a hemorrhagic event. A T2-weighted image (B) shows a subtle partial rim of hemosiderin, an inconsistent feature of intrapituitary hemorrhage due to the lack of a blood–brain barrier. After contrast (C), the lesion is obscured by enhancing normal gland. |
 FIGURE 17.27 Prolactin microadenoma using photography at regular and narrow windows. A: Coronal T1-weighted image. The right-sided adenoma is barely visible when photographed at regular window widths (small arrows). B: Extremely narrow window displays are at times required to demonstrate adenoma convincingly. Although this image is extremely noisy, the adenoma is distinctly visible on the right side of the gland. |
 FIGURE 17.28 Proven corticotropin-secreting microadenoma best seen after contrast enhancement. A: Coronal T1-weighted image, noncontrast study. The pituitary gland signal appears normal, but there is a subtle alteration in the superior contour of the left side of the gland. B: Coronal T1-weighted image after intravenous contrast enhancement. A distinct 4-mm hypointense abnormality is seen on the left side of the gland. |
The excellent sensitivity of unenhanced T1-weighted SE MR for microadenomas has made it the primary sequence for imaging the pituitary gland. We reserve contrast enhancement for those cases in which there is good clinical and biochemical evidence of a pituitary adenoma with a negative or equivocal plain MR. In these circumstances gadolinium–diethylenetriamine penta-acetic acid (Gd-DTPA) enhancement has been documented to detect adenomas that would otherwise have remained occult. This is especially important in Cushing disease because ACTH-secreting adenomas are the smallest and the most difficult to detect, yet accurate documentation of the presence and the position of these tumors is essential because surgical removal is the only effective means of therapy. Enhanced MR is the best available means of detecting these tumors. In most cases the best imaging routine is to perform a plain scan followed by a repeat T1-weighted coronal sequence immediately after i.v. injection of contrast. Because of the differential rates of enhancement between normal pituitary tissue and adenomas, the adenoma will stand out as a hypointense focus within the enhancing gland (Fig. 17.28). Dynamic scanning of the pituitary gland may be temporally interposed between a bolus injection of i.v. contrast and the regular postcontrast scan. In a small number of cases, the dynamic study will demonstrate an adenoma that is otherwise occult (Fig. 17.7). If these images are all negative or equivocal, delayed images (30 to 60 minutes after injection) can in some instances demonstrate reversal of this image contrast because of the accumulation of Gd-DTPA in the adenoma and washout from the normal gland.
 FIGURE 17.29 Cushing disease. Coronal T1-weighted image. There is a 10-mm microadenoma centrally located in the gland, causing a prominent bulge of the gland into the suprasellar cistern. A central location is typical for corticotropin-secreting microadenomas. The size is atypically large in this case, in that most are detected very early and are therefore small, with a mean size of 3 to 4 mm. |
The accuracy of MR for the diagnosis of pituitary microadenomas is difficult to establish, particularly because of the high incidence of incidental lesions found in pituitary glands (39). Our experience correlating MR with surgical findings has been excellent. In an early report of histologically proven cases, more than 90% of microadenomas were detected and accurately localized with MR (9). This early report continues to reflect accurately our experience. Less favorable statistics have also been published, but generally results have improved as the use of high–field strength scanners has become more prevalent, finer spatial resolution has been achieved, and experience
with technique and interpretation has increased. Most published studies (including ours) suffer from small numbers of patients and the inability to ascertain the true number of false negatives. There has not been a large prospective, blinded study of MR of pituitary adenomas nor any large series comparing MR and CT in the same group of patients (41). It seems apparent, however, that MR has for the most part replaced CT as the preferred method of investigation, and in our opinion it is the superior technique. The major limitations are in the detection of very small adenomas (3 to 4 mm), particularly in Cushing disease.
with technique and interpretation has increased. Most published studies (including ours) suffer from small numbers of patients and the inability to ascertain the true number of false negatives. There has not been a large prospective, blinded study of MR of pituitary adenomas nor any large series comparing MR and CT in the same group of patients (41). It seems apparent, however, that MR has for the most part replaced CT as the preferred method of investigation, and in our opinion it is the superior technique. The major limitations are in the detection of very small adenomas (3 to 4 mm), particularly in Cushing disease.
 FIGURE 17.30 Thyroid-stimulating hormone adenoma. Coronal T1-weighted image. There is a 5-mm, centrally positioned adenoma associated with a focal deformity in the sella floor (small arrows). Thyroid-stimulating hormone adenomas are one of the rarest types. Their appearance is identical to that of other microadenomas, except that their position is more frequently central than lateral. |
 FIGURE 17.31 Densely granulated growth hormone pituitary adenoma. A: Coronal T1-weighted image with contrast demonstrates a left pituitary adenoma, which is hypointense compared to the normally enhancing pituitary gland. B: Coronal T2-weighted image demonstrates that the adenoma is hypointense on T2 as seen with densely granulated growth hormone adenomas. |
The discussion of the modern radiologic investigation of pituitary microadenomas would not be complete without considering petrosal venous sampling. This procedure is a useful adjunct in localizing the source of ACTH secretion when the preoperative imaging workup of patients with Cushing disease has failed to reveal a pituitary adenoma (42). Petrosal sinus sampling is an extremely reliable test for distinguishing Cushing disease from ectopic ACTH syndrome and autonomous adrenal disease, with accuracy close to 100% (43), with a reported accuracy greater than 95% for Cushing disease (44). One study suggested further reduction of false negatives with measurement of prolactin in addition to ACTH during inferior petrosal sampling in patients with corticotropin-dependent Cushing syndrome (45). The same accuracy is not achieved in lateralizing an adenoma within the pituitary gland. In 128 patients, the higher level of ACTH was on the side of the tumor in only 70% of cases, whereas it was opposite the tumor in 23% and nonlateralizing in 6%. However, the contralateral gradients occurred most commonly with larger microadenomas (greater than 6 mm), probably because the low-pressure valveless intercavernous sinuses are compressed by tumors of this size. On the other hand, lateralization is most reliable for the smallest lesions (less than 4 mm), the very cases in which MR is likely to be negative and lateralization is otherwise most difficult. Superselective bilateral cavernous sinus venous sampling with hypothalamic-stimulating hormone administration can provide accurate localization (93%) of the responsible lesion in patients with ACTH-producing pituitary adenomas (46).
 FIGURE 17.32 Pituitary microadenoma. Coronal T1-weighted image. Typical of most microadenomas, this left-sided microadenoma is hypointense in comparison with the normal pituitary gland. The degree of signal difference is greater than that found in most microadenomas, and in this way this lesion almost mimics the appearance of a cyst. In addition, this lesion is associated with contour deformities in both the superior and inferior surfaces of the gland. These signs of a “mass” aid in the confirmation of an intrapituitary tumor. |
 FIGURE 17.33 Adenoma with ipsilateral stalk movement. Coronal T1-weighted image. There is a microadenoma present on the left side of the gland extending inferiorly and laterally (small arrows). This case is unusual, in that the stalk is displaced toward the side of the adenoma, illustrating that the position of the stalk is not as reliable a finding as focal abnormalities in signal intensity within the gland. |
Before we proceed to macroadenomas, there are two practical issues that warrant comment: “pituitary incidentalomas” and the appropriate interval for follow-up of microadenomas. With respect to the first matter, it is well known that focal abnormalities may be seen incidentally in the pituitary gland. This is increasingly true on MR as ever better resolution is achieved. The discovery of these focal abnormalities may be due to several factors, such as the presence of asymptomatic cysts or microadenomas or artifactual hypointensities caused by magnetic susceptibility–induced signal distortions in the gland that mimic pathology (47). Most of these incidental “lesions” are small—usually less than 3 mm in size. It should be noted that incidental pituitary lesions greater than 2 mm are nearly always either pituitary adenomas or Rathke cleft cysts from autopsy studies (39). Focal susceptibility artifacts are particularly common near the junction of the sphenoid sinus septum and the sellar floor. Thus, the interpretation of pituitary MR must be related to knowledge of typical imaging artifacts in the sella turcica and must be closely tied to the clinical and biochemical findings.
The other practical clinical issue is the question of the appropriate interval between MR scans for microadenomas. We are often asked to repeat MRI of microadenomas at annual intervals. It has been our experience that there is rarely any
significant change in tumor size over such intervals. The literature supports our observations, particularly with microprolactinomas. One systematic review of 11 observational cohort studies using CT or MRI for imaging evaluation demonstrated a tumor growth rate of 3.3 per 100 person-years with microadenomas and 0.05 per 100 person-years for cystic lesions. Macroadenomas and solid lesions demonstrated a greater tendency for growth. The implication is that the imaging follow-up interval for microprolactinomas should probably not be any more often than every several years.
significant change in tumor size over such intervals. The literature supports our observations, particularly with microprolactinomas. One systematic review of 11 observational cohort studies using CT or MRI for imaging evaluation demonstrated a tumor growth rate of 3.3 per 100 person-years with microadenomas and 0.05 per 100 person-years for cystic lesions. Macroadenomas and solid lesions demonstrated a greater tendency for growth. The implication is that the imaging follow-up interval for microprolactinomas should probably not be any more often than every several years.
 FIGURE 17.34 Macroadenoma presenting with endocrine dysfunction. Intrinsic pituitary mass with compression of the right side of the optic chiasm and marked enlargement of the sella is identified on both T1-weighted (A) and T2-weighted (B–D) images in this patient with hyperprolactinemia, an unusual clinical setting for a diagnosis of macroadenoma. Also note subclinical intralesional hemorrhage on coronal (panel B) and axial (panel C) T2-weighted images. |
Pituitary Macroadenoma
Pituitary macroadenomas become clinically significant when they reach the size large enough to cause symptoms due to mass effect (Fig. 17.34) because most, but not all, macroadenomas are nonfunctioning tumors. Therefore, these lesions present late and can achieve quite remarkable volumes. Macroadenomas share some of the MR characteristics of their smaller counterparts. MR typically demonstrates a mass arising from the pituitary fossa, hypointense on T1-weighted images, compressing the higher-intensity normal pituitary tissue (Fig. 17.35). Macroadenomas are more often hyperintense on T2-weighted images than are microadenomas. Hyperintensity on the T2-weighted images may be useful in predicting that a macroadenoma is soft or partially necrotic and thus easily removed by suction and curettage. Snow et al. (48) found 32 of 35 “soft” macroadenomas to be hyperintense, whereas 7 of 7 “firm” macroadenomas were isointense. Our experience with assessing tumor consistency by signal intensity has not yielded such a strong correlation with T2-weighted images. Bahuleyan et al. (49) similarly found that the consistency of pituitary macroadenomas could not be accurately predicted based on MR signal intensities. However, a significant direct correlation has recently been shown between tumor consistency (hardness) and apparent diffusion coefficient (ADC) values (50). A recent study demonstrated improved diagnostic accuracy using contrast-enhanced FIESTA sequences in predicting tumor consistency, with a mean sensitivity of 100% and specificity of 90% for predicting hard adenomas (51). In most instances the
macroadenoma completely fills the sella; the normal tissue is so compressed that it is virtually obliterated and cannot be identified (Fig. 17.36). The posterior pituitary bright spot is seen in an ectopic location or not at all in the majority of cases. The essence of the diagnosis of macroadenomas is the definition of the lesion as intrinsic to the pituitary gland. Therefore, the most important task of the radiologist when a mass is present in the sella with suprasellar extension is to determine if the lesion is intrinsic or extrinsic to the gland. Once the lesion is identified as being intrinsic to the gland, then the differential diagnosis becomes quite limited. The second feature to be sought is enlargement of the sella, because large pituitary adenomas virtually always enlarge the sella due to their slow growth and late presentation, whereas other intrinsic pituitary lesions such as pituitary metastasis and inflammatory lesions do not.
macroadenoma completely fills the sella; the normal tissue is so compressed that it is virtually obliterated and cannot be identified (Fig. 17.36). The posterior pituitary bright spot is seen in an ectopic location or not at all in the majority of cases. The essence of the diagnosis of macroadenomas is the definition of the lesion as intrinsic to the pituitary gland. Therefore, the most important task of the radiologist when a mass is present in the sella with suprasellar extension is to determine if the lesion is intrinsic or extrinsic to the gland. Once the lesion is identified as being intrinsic to the gland, then the differential diagnosis becomes quite limited. The second feature to be sought is enlargement of the sella, because large pituitary adenomas virtually always enlarge the sella due to their slow growth and late presentation, whereas other intrinsic pituitary lesions such as pituitary metastasis and inflammatory lesions do not.
 FIGURE 17.35 Pituitary macroadenoma. Coronal T1-weighted image. There is an adenoma originating on the left side of the pituitary gland, extending superiorly into the suprasellar cistern and laterally through the medial cavernous sinus wall into the cavernous sinus and encircling but not narrowing the carotid artery (curved arrow). The lateral wall of the left cavernous sinus is displaced and has a distinct lateral convexity (large arrows). Note the clear visualization of the lateral cavernous sinus dura on the right and the left. The lateral walls are relatively thick dural structures that are clearly visualized on magnetic resonance image examinations, forming a useful landmark. The medial cavernous sinus wall, on the other hand, is too thin to be reliably visualized, making subtle degrees of cavernous sinus invasion difficult to assess. Note also the clear distinction between normal and abnormal pituitary tissue (small arrows). |
 FIGURE 17.36 Pituitary macroadenoma with displacement of posterior lobe. A: Sagittal T1-weighted image. There is a large soft-tissue mass in the sella turcica and suprasellar cistern. The sella turcica itself is expanded—a good sign that the tumor originated from within the sella rather than above it. The optic chiasm and third ventricle are elevated. Note the high-intensity band along the posterior margin of the superior aspect of the tumor (curved arrow). This is thought to represent the material normally present in the posterior lobe; however, because of the large size of the tumor, this material cannot descend all the way through the stalk to the normal intrasellar position and remains at the site of “stalk obstruction.” Within the tumor there is a focal necrotic area of low intensity (small arrows). B: After contrast enhancement, the entire tumor enhances rather intensely but not completely homogeneously. In particular, the area of necrosis shows no enhancement. |
Intratumoral hemorrhage occurs in 20% to 30% of pituitary adenomas, most often in macroadenomas (Figs. 17.37 and 17.38). Although pituitary infarction and/or hemorrhage
may result in the clinical syndrome of pituitary apoplexy, more frequently hemorrhage is subclinical and is discovered only incidentally on MR (52). In fact, only a small fraction of these patients have clinical findings of pituitary apoplexy (see Pituitary Apoplexy) (52). The incidence of bleeding is much higher in patients receiving bromocriptine. Yousem et al. (53) reported a 45% incidence of hemorrhage in patients treated with bromocriptine, compared with 13% in those who did not receive the drug. Larger pituitary adenomas may be accompanied by cystic degeneration with or without hemorrhage. Cystic degeneration in an adenoma is evident as sharply defined regions of very low signal intensity on T1-weighted images that are markedly hyperintense on the T2-weighted sequence. A fluid-debris level is a more specific sign of cystic degeneration but is infrequently present. Rarely, noncystic adenomas possess similar signal characteristics and mimic a cyst (Fig. 17.32).
may result in the clinical syndrome of pituitary apoplexy, more frequently hemorrhage is subclinical and is discovered only incidentally on MR (52). In fact, only a small fraction of these patients have clinical findings of pituitary apoplexy (see Pituitary Apoplexy) (52). The incidence of bleeding is much higher in patients receiving bromocriptine. Yousem et al. (53) reported a 45% incidence of hemorrhage in patients treated with bromocriptine, compared with 13% in those who did not receive the drug. Larger pituitary adenomas may be accompanied by cystic degeneration with or without hemorrhage. Cystic degeneration in an adenoma is evident as sharply defined regions of very low signal intensity on T1-weighted images that are markedly hyperintense on the T2-weighted sequence. A fluid-debris level is a more specific sign of cystic degeneration but is infrequently present. Rarely, noncystic adenomas possess similar signal characteristics and mimic a cyst (Fig. 17.32).
Related posts:
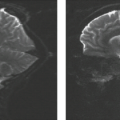
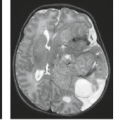
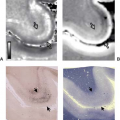
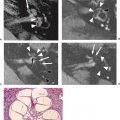
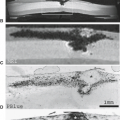
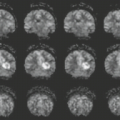
Stay updated, free articles. Join our Telegram channel

Full access? Get Clinical Tree


