Normal Aging, Dementia, and Neurodegenerative Disease
Kejal Kantarci
David J. Irwin
John Q. Trojanowski
Clifford R. Jack Jr.
Introduction
Elderly population around the world is rapidly increasing. With increasing life expectancy, the importance of understanding normal aging, dementia, and neurodegenerative diseases has become more critical than ever. The social and economic impacts of the aging population are felt worldwide, affecting both the developed and less developed regions. Projections by the United States Census Bureau demonstrate that the numbers of both the elderly (those older than 65 years of age) and the “oldest old” (those older than 85 years of age) will continue their dramatic rise in the United States. Other data demonstrate that life expectancy is increasing for both women and men, likely due to a variety of factors, not the least of which is technology-based advances in medical care. While age-specific incidence for dementia is not different among women and men, a larger proportion of older women living with Alzheimer disease (AD) is explained primarily by the fact that women live longer, on average than men (1).
Beyond the overall demographics of the population, a significant proportion of the elderly show moderate or severe cognitive impairment. This proportion increases with the age group. An estimated 36 million people worldwide are living with dementia in 2010 and this is expected to nearly double every 20 years, to 66 million by 2030 and 115 million by 2050. By 2040, the World Health Organization predicts that as a result of a growing, aging population, neurodegenerative diseases will have overtaken cancer to become the world’s second-leading cause of death, after cardiovascular disease.
An additional remarkable demographic of importance in developed nations is the level of education of the aging population. As the aged population has been increasing, so has the proportion of highly educated elderly. With this increased level of education come a higher awareness of screening and the potential importance of health-related technology advances. Particularly in the United States, consumer data show more proactive medical care behavior by such populations, prompting increased use of imaging procedures as well as necessitating better proof of the benefits of imaging for screening and diagnosis.
The second fundamental reason for understanding the imaging findings in aging and cognitive disorders is the unsurpassed opportunity for impact. Aside from the obvious impact of focusing on diseases affecting an ever-increasing proportion of the population, there are a number of other reasons to believe that advances in magnetic resonance imaging (MRI) have a tremendous and unique opportunity for significant impact on health.
First, it is widely recognized that diagnostic tools for brain disorders associated with cognitive decline have been severely deficient. Despite the high incidence of these disorders, representing the second-greatest cause of disability among adults in the developed world (second only to cardiovascular disease) and the severe morbidity associated with them, it is striking that the mainstay of their diagnosis remains subjective clinical examination, a rather crude assessment of the brain. Conventional imaging has traditionally played little role in the diagnosis of Alzheimer dementia, as well as the vast majority of other neurodegenerative disorders, including Parkinson disease, despite their late clinical stages. Conventional imaging studies have only been useful to exclude “treatable” causes of these disorders. Highly technical and sophisticated tools have only recently been shown to have the potential for making these diagnoses and for predicting cognitive decline as opposed to healthy aging.
Second, the opportunity to impact the still nascent therapeutic arm for cognitive decline and cognitive disorders is vast. The pharmacologic and minimally invasive neurosurgical options for treatment of the disorders in this broad category are just beginning to emerge. The overall neurodegenerative market is growing at over 5.4% a year. In 2010, the global drug market for neurodegenerative disorders was valued at US$16.8 billion. The global AD market alone is expected to grow to reach US$19 billion by 2015. There is little question that sophisticated imaging, particularly targeted imaging methods coupled with novel contrast agents, will become highly valuable in guiding and further developing new treatments and identifying the at-risk populations that may benefit from these treatments at the earliest disease stages.
Third, this area of disease represents an opportunity for impact on disorders of high concern to the public. There is no question that memory loss, cognitive disorders of aging, and mental health constitute a highly visible group of disorders that are of great concern. A high percentage of families have family members with disorders affecting cognition. Although the annual prevalence of mental disorders in children and adolescents is not as well documented as that for adults, it is estimated that about 20% of children have disorders with at least mild functional impairment. In the pediatric population, compelling data show that the foremost causes of limitation of activity among children older than 5 years of age include cognitive and neuropsychiatric disorders. In particular, recent marketing and news presented in the media have greatly increased awareness of this set of disorders.
There continues to be remarkably active and productive research into the mechanisms that lead to the death of both
individual neurons and networks of interconnected neurons. Despite this and the notable progress in advanced MRI techniques to detect many of the events that underlie the common themes of cellular dysfunction and neuronal degeneration seen in aging and neurodegenerative disease, the diagnosis of many of these entities remains elusive in individual patients, notwithstanding group data studies demonstrating differences from normal controls. Indeed, it is frustrating to clinicians and radiologists alike that diagnosing degenerative disorders of the brain and distinguishing their features from normal aging are difficult or impossible in most cases.
individual neurons and networks of interconnected neurons. Despite this and the notable progress in advanced MRI techniques to detect many of the events that underlie the common themes of cellular dysfunction and neuronal degeneration seen in aging and neurodegenerative disease, the diagnosis of many of these entities remains elusive in individual patients, notwithstanding group data studies demonstrating differences from normal controls. Indeed, it is frustrating to clinicians and radiologists alike that diagnosing degenerative disorders of the brain and distinguishing their features from normal aging are difficult or impossible in most cases.
This chapter addresses changes in the appearance of the brain on MR that are associated with normal aging and with conditions that produce dementia in the elderly. After briefly addressing aging brain on MRI, the focus will be on those neurodegenerative disorders, in which dementia is a cardinal feature of the clinical presentation.
MRI Brain Changes Associated with Aging
The three most common MRI-detectable abnormalities typically ascribed to “normal” aging are atrophy, hyperintense areas on T2 or fluid-attenuated inversion recovery (FLAIR) images in the hemispheric white matter, and decrease in the signal intensity of the extrapyramidal nuclei attributed to iron deposition. One view of “normal” aging is that these changes in the brain that are detectable by MRI are an inevitable part of aging and thus “normal.” A contrary view, however, is that none of these age-related changes on MRI are normal or are inevitable consequences of aging; all are imaging manifestations of pathologic insults to the brain that increase in prevalence with age. It is certainly true that some individuals can display significant cerebral atrophy or a significant burden of white matter hyperintensities without apparent ill effects in cognitive performance, just as it is true that certain individuals have extensive Alzheimer pathology at autopsy without having displayed obvious clinical symptoms in life. However, neither the abnormal findings at autopsy nor very common age-related lesions on imaging should be considered normal.
Atrophy
Numerous autopsy and imaging studies have documented the fact that cerebral atrophy occurs as a feature of usual aging. A wide variety of mechanisms have been invoked to explain the senescence and death of cells in normal aging, including loss of hormonal stimulation, accumulation of toxins, genetic errors, and internal cellular clocks that program death. In neurodegenerative disorders, brain parenchymal loss occurs prematurely. Loss of neural tissue leads to the neuroimaging findings of focal and/or diffuse atrophy. As the brain shrinks, the cerebrospinal fluid (CSF) spaces appear capacious with prominence of the ventricles, cisterns, and sulci. It should be noted that prominence of the subarachnoid spaces, including ventricles and sulci, can also be a transient phenomenon due to treatment effects (Fig. 15.1). This is especially true in children on steroids, and so, although it is infrequent, it is wise to avoid the term “atrophy” in pediatric brain MRI, a term that implies irreversible loss of brain tissue.
Although atrophy in gray matter has been noted with senescence (2,3), the longstanding belief that selective loss of neurons occurs in the neocortex (4,5) has been challenged by recent studies showing that total neuron populations are preserved in the frontal and temporal lobes where atrophy is grossly detectable (6). Metabolic imaging studies also have found decreases with age, also most prominently in the frontal region (7,8). Several investigators suggested on autopsy (9) and by MR segmentation techniques (10) that selective atrophy of white matter, rather than gray matter, predominates in aging. This white matter atrophy is a result of fewer myelinated fibers, which is accompanied by an increased extracellular space (9). Capillary walls in the white matter also change with aging and become thinner as a result of loss of pericytes and thinner endothelial cytoplasm (11). These and further studies (7,12) suggest that age-related atrophy is more reflective of changes in the white matter rather than in the cortex.
 FIGURE 15.1 Enlarged ventricles and subarachnoid spaces, transient, due to steroids. A young adult with central nervous system lupus on steroid treatment showed enlarged ventricles and diffusely enlarged sulci over hemispheres and in the posterior fossa (A), all of which reverted to normal 2 years later (B). Whereas “atrophy” is almost never a difficult or controversial diagnosis, one should be aware that significantly enlarged ventricles and sulci can merely represent treatment effects and do not necessarily imply irreversible brain damage. |
The rate of cerebral atrophy in usual aging also has been somewhat of a source of controversy. Most studies report a linear decline in brain volume with advancing age beginning sometime in middle to old age. Others report a nonlinear age effect on brain volumes (13) or a mixture of regional accelerating and decelerating changes across human lifespan (14). Furthermore, nonlinear trends have been observed in gray and white matter volume loss, contrary to a linear trend of increase in CSF spaces. The “knee” of the volume versus age curve has been variably located in the fifth, sixth, or seventh decade (2,3,4,5,6,7,8,9,10,11,12,15,16,17,18,19,20,21). The rate of age-related brain atrophy was noted to be different in men than in women (17,18,22). Although most studies have assessed global/hemispheric atrophy with advancing age, recent studies indicate that different portions of the brain may be more susceptible to age-related atrophy than others (2,13,14,15,16,17,20,22,23,24,25).
It also should be noted that microstructural changes in brain parenchyma can be detected with diffusion tensor imaging (DTI) that are otherwise occult on conventional MR through the adult lifespan (26). These changes may account for atrophy, as well as cognitive alterations in the old age (27). DTI alterations associated with aging are characterized by decreased fractional anisotropy (FA) in the white matter and increased mean diffusivity (MD) in both the gray and white matter. Aging-related DTI changes typically involving the frontal lobe white matter more than other white matter regions (28,29,30,31,32). Although the biologic basis of diffusivity changes in the aging brain is yet unclear, the association between frontal lobe white matter FA and executive function (29,30,31) underscores the importance of FA reductions in cognitive aging.
Focal Hyperintensities on T2-Weighted Images
Increasing prevalence of focal and confluent areas of increased signal intensity on conventional T2-weighted and FLAIR MR in the white matter and central nuclei of individuals with
advancing age is a widely recognized phenomenon. Focal areas of high signal intensity are in fact seen routinely in several characteristic locations in the normal brain; they can be scattered within the deep white matter during normal aging; and they are much more widespread and prominent in a variety of pathologic disorders. The interpretation of these foci of high signal intensity requires analysis of size, shape, location, and overall number. Given the correlation of size and severity of these periventricular hyperintense lesions with age, the radiologist needs to cultivate an overall sense of how much is allowable before invoking superimposed pathology—particularly clinically significant changes—at a given age.
advancing age is a widely recognized phenomenon. Focal areas of high signal intensity are in fact seen routinely in several characteristic locations in the normal brain; they can be scattered within the deep white matter during normal aging; and they are much more widespread and prominent in a variety of pathologic disorders. The interpretation of these foci of high signal intensity requires analysis of size, shape, location, and overall number. Given the correlation of size and severity of these periventricular hyperintense lesions with age, the radiologist needs to cultivate an overall sense of how much is allowable before invoking superimposed pathology—particularly clinically significant changes—at a given age.
 FIGURE 15.2 Normal regions of hyperintensity on fluid-attenuated inversion recovery (FLAIR) images, 30-year-old volunteer. FLAIR images show subtle signal increase in the posterior limb of internal capsules bilaterally (small arrow). Also, note the minimal hyperintensity adjacent to the tips of the frontal horns of the lateral ventricles (large arrow), termed “ependymitis granularis.” These regions are a normal finding and not to be confused with pathology. |
The Parietopontine Tracts of the Posterior Limb of the Internal Capsule
In certain locations, elevated signal intensity on conventional and FLAIR T2-weighted images (Fig. 15.2) is a normal finding even in young individuals (33). The posterior portion of the internal capsule shows focal areas of variable signal intensity compared to the remainder of the internal capsule. In one report, approximately one-half of normal patients demonstrated this finding. These foci were well circumscribed, round or oval, and symmetric, and they appeared comparable to cortical gray matter on T2 and iso- or hypointense on proton-density images. Histopathologic correlation suggests that this corresponds to the parietopontine tracts with less intense myelin staining (33). The presence of the pars retrolenticularis of the optic tract (34) and absence of iron (35) are other postulated contributors.
On axial images at the level of the velum interpositum, these foci are consistently medial to the distal putamen near the junction of the posterior limb and retrolenticular portion of the internal capsule. They do not demonstrate intravenous contrast enhancement (33). They are not seen in patients younger than the age of 10 years; otherwise they show no definite relation to age (33). Pathologic lesions are more variable in size, shape, and location; are more inhomogeneous and ill defined; uncommonly are bilaterally symmetric; and may enhance with gadolinium-diethylenetriamine penta-acetic acid (33).
The Trigone: Terminal Areas of Myelination
Triangular-shaped regions posterior and superior to the trigones that are variably hyperintense on T2-weighted images are normal in patients in their first and second decades (Fig. 15.3) (36). They are believed to represent the known delayed myelination of the fiber tracts involving the association areas of the convexities of the posterior and inferior parietal and posterolateral temporal cortex, that is, the “terminal areas” (36,37). Occasionally, some of these regions lack myelin staining until the fourth decade or later in adulthood (37).
The Frontal Horns: Ependymitis Granularis
Hyperintense foci on T2-weighted images exist in virtually all normal patients anterior and lateral to the frontal horns (Fig. 15.2) (38). These may be punctate or up to 1 cm in width (38). They are of uniform triangular shape, with the base resting on the tops of the frontal horns and with the apex pointing anteriorly into the adjacent white matter. The medial aspect of the triangle is defined by the genu of the corpus callosum, whereas the lateral border extends along the white matter, terminating posteriorly at the head of the caudate in the most prominent cases (38).
Several mechanisms may contribute to the hyperintense signal seen in this location (38). First, the myelin content is decreased. Second, this region displays ependymitis granularis, which refers to a focal breakdown of the ependymal lining with adjacent astrocytic gliosis. Third, periependymal and extracellular fluid is increased. Interstitial fluid in the brain preferentially drains to the subependymal region, especially to the dorsolateral angle of the lateral ventricle. This region serves as a natural funnel for extracellular fluid produced in the brain interstitium, an organ that lacks hemispheric lymphatics (38).
 FIGURE 15.3 Terminal areas of myelination. Axial plane, long repetition time, short (A) and long (B) echo time. The mild, hyperintense signal of the white matter (arrows) posterosuperior to the trigones is normal and is believed to represent the terminal areas of myelination. |
TABLE 15.1 New Pathologic Classification of Cerebral Lacunae | ||||||||||||||||||||
|---|---|---|---|---|---|---|---|---|---|---|---|---|---|---|---|---|---|---|---|---|
| ||||||||||||||||||||
Perivascular Spaces of Virchow and Robin
Pestalozzi (see 39) and later Virchow in 1851 (40) and Robin in 1859 (41) characterized what is now referred to as the perivascular space of Virchow–Robin (VRS). This is an extension of the subarachnoid space that accompanies penetrating vessels into the brain to the level of the capillaries (39,42). The word “lacunae” carries with it many connotations and has created some semantic confusion. One classification system is shown in Table 15.1 (43,44) Type I lacunae are small infarcts, type II are small hemorrhages, and type III are dilated VRS. Computed tomography (CT) studies can demonstrate large dilated VRS (20) whereas MRI permits the routine visualization of normal VRS because of greater resolution and contrast (39,42,45).
On MR, VRSs are typically small foci that remain isointense to CSF on all pulse sequences and conform to the path of penetrating arteries (39,42,45). They lack mass effect and are round, oval, or curvilinear with well-defined, smooth margins. The VRS at the base of the brain follows the lenticulostriate arteries as they enter the basal ganglia through the anterior perforated substance. On axial images they are typically adjacent to the anterior or posterior surface of the lateral portion of the anterior commissure (Fig. 15.4) (45). In the coronal or sagittal plane they are adjacent to the superior surface of the commissure or just lateral to the putamen. Those in the high convexity (Fig. 15.5) follow the course of the penetrating cortical arteries and arterioles from the high-convexity gray matter into the centrum semiovale (39). High signal intensity (i.e., higher intensity than CSF, most notably on proton density–weighted or FLAIR images) foci in the midbrain also can be seen from enlarged perivascular spaces, in this case from branches of the collicular and accessory collicular arteries (46).
Small VR spaces (less than 2 mm) are found in all age groups and probably represent a normal anatomic finding (39). With advancing age, VR spaces are found with increasing frequency and larger apparent size (39). In one report, lenticulostriate VR spaces had a mild correlation with age, whereas high-convexity VR spaces, although more rare, had a much stronger correlation with age (39). Age, hypertension, dementia, and incidental subcortical white matter lesions were significantly associated with large (greater than 2 mm) VR spaces (39). More detailed analysis using logistic regression showed age to be the significant variable (39). Two mechanisms can account for this age-related increase in size. First, aging is associated with enlargement of ventricles and sulci. The VRS, an extension of the subarachnoid space, enlarges as the subarachnoid space does elsewhere in the brain with aging (39,43,47). Second, age-related vascular changes may play an important role. Atherosclerotic changes in the brain are common in elderly patients, occurring in greater than 50% of patients older than 50 years of age (48). This can be found in normotensive patients but is more diffuse and widespread in hypertensive individuals (49). Even without atherosclerosis, vessels become larger and more tortuous with aging (49). The unfolding of these tortuous vessels may account for the vacuolated parenchyma around the vessels and ultimately lead to increased prominence of the perivascular space (43,47). Migraine patients also have been reported to show prominent perivascular spaces.
Distinction between dilated perivascular spaces and lacunar infarction is a common problem on clinical MR images. Three criteria must be assessed by the radiologist in these cases: location, morphology, and signal intensity. Generally useful guidelines are that lacunar infarctions often are larger than 3 mm, are not symmetric, are located in the upper two-thirds of the putamen, and have a hyperintense rim unless they have undergone complete cystic change, which occasionally occurs. Conversely, dilated perivascular spaces usually are isointense to CSF on all pulse sequences, bilaterally symmetric, less than 3 mm in diameter, and located in the inferior one-third of the putamen and do not have a hyperintense rim (39,45,50,51). Size is certainly the weakest discriminator of those mentioned.
Iron Deposition
A third obvious change in the brain associated with usual aging that is apparent on MR is progressive decrease in signal intensity of the extrapyramidal nuclei on T2-weighted images (52). The changing signal intensities of the deep gray matter nuclei with normal aging have been well documented at 1.5 Tesla (T) (Figs. 15.6–15.8) (35,53). During the first 10 years of life, the
extrapyramidal nuclei studied are isointense to cortical gray matter (Fig. 15.6) (53). In most patients by age 25 years, the globus pallidus, followed by the red nucleus and pars reticulata of the substantia nigra, becomes hypointense relative to cortical gray matter and to white matter on the long–repetition time (TR)/echo time (TE) sequence (Fig. 15.7) (53,54). The dentate nucleus decreases in signal intensity more slowly and inconsistently; only one-third of patients’ dentate nuclei are hypointense relative to white matter by age 25 years (53). With further aging, hypointensity in the caudate and putamen progresses and may equal that in the globus pallidus in individuals in their eighth decade (Fig. 15.8) (52). Low-intensity changes in the cortical ribbon, particularly in the motor cortex, presumably from iron deposition also have been correlated with usual aging as well as certain neurodegenerative disorders such as amyotrophic lateral sclerosis (ALS) (55).
extrapyramidal nuclei studied are isointense to cortical gray matter (Fig. 15.6) (53). In most patients by age 25 years, the globus pallidus, followed by the red nucleus and pars reticulata of the substantia nigra, becomes hypointense relative to cortical gray matter and to white matter on the long–repetition time (TR)/echo time (TE) sequence (Fig. 15.7) (53,54). The dentate nucleus decreases in signal intensity more slowly and inconsistently; only one-third of patients’ dentate nuclei are hypointense relative to white matter by age 25 years (53). With further aging, hypointensity in the caudate and putamen progresses and may equal that in the globus pallidus in individuals in their eighth decade (Fig. 15.8) (52). Low-intensity changes in the cortical ribbon, particularly in the motor cortex, presumably from iron deposition also have been correlated with usual aging as well as certain neurodegenerative disorders such as amyotrophic lateral sclerosis (ALS) (55).
 FIGURE 15.4 Prominent space of Virchow–Robin (VRS). T1-weighted (A), T2-weighted (B), and fluid-attenuated inversion recovery (FLAIR) (C) images show multiple VRS, which are very small, round or linear, and isointense to cerebrospinal fluid. Note the relationship of VRS to the anterior commissure. The larger left-sided cystic region is likely a lacunar infarction rather than a VRS because there is subtle hyperintensity most evident on FLAIR (C) posterolaterally. T2-weighted (D) and FLAIR (E) images at the level of the midbrain depict another characteristic location for VRS—at the level of the cerebral peduncles. These VRS are typically bilateral, and their signal suppresses with FLAIR. (F–H) Gross pathology. Dilated VRS in the putamen (F) and cavitated, round infarct (G). Stained section (H,E) of the basal forebrain of a different elderly patient illustrates the degree of perivascular spaces frequently occurring in these individuals. (F–H: From Braffman BH, Zimmerman RA, Trojanowski JQ, et al. Brain MR: pathologic correlation with gross and histopathology. I. Lacunar infarction and Virchow-Robin spaces. AJNR Am J Neuroradiol 1988;9:621–628, with permission.) |
 FIGURE 15.5 High-convexity space of Virchow-Robin (VRS). A: Sagittal plane, repetition time (TR)/echo time (TE) 600/20. Axial (B,C) and coronal (D,E) planes. TR/TE 2500/30 (B,D) and TR/TE 2500/80 (C,E). Dilated VRS are well-defined small foci isointense to cerebrospinal fluid (CSF) on all pulse sequences. In this patient, they appear round (A) and curvilinear (B–E). On the first echo of the long-TR sequence, in which CSF is nearly isointense to white matter, the VRS are virtually undetectable (B,D). Note that the subcortical lesion (arrow) (D,E), in contrast, is hyperintense on both the first and second echoes of the long-TR sequence. |
 FIGURE 15.6 Age-related signal intensity on long–repetition time/echo time sequences at 1.5 T of dentate nuclei (A, 1), red nuclei, and pars reticulata of the substantia nigra (B, 2 and 3, respectively), and globus pallidus and putamen (C, 4 and 5, respectively). At 2 years old, these gray matter nuclei are isointense to cortical gray matter and hyperintense to white matter. |
 FIGURE 15.7 At age 27 years, the globus pallidus (4 and 5), red nucleus, pars reticulata of the substantia nigra (2 and 3, respectively), and, to a lesser extent, the dentate nuclei (1) are hypointense to cortical gray and to white matter. Note the greater degree of hypointensity of the globus pallidus in this 27-year-old imaged at 1.5 T than that of a 33-year-old patient at 0.5 T in Figure 14.16. The hypointense signal of the anterior commissure in panel B is not from iron but is secondary to heavy myelination and fiber density (370). Note the normal perivascular space anterior to the anterior commissure. |
A report using a carefully screened pool of normal adult volunteers showed that the volume of deep gray matter hypointensity on T2-weighted images in the red nucleus, substantia nigra, and dentate nucleus was relatively stable, showing no definite relationship to age. However, the globus pallidus showed increased volume of hypointensity in middle-aged and older patients, whereas the putamen showed measurable hypointensity only in elderly patients. None of the normal individuals had hypointensity in the thalamus or caudate (54).
Whereas the cause of this age-related apparent T2 shortening has been controversial (34,56,57,58,59,60,61,62), iron deposition most likely accounts for these MR observations in aging (48,52,54,63,64), as well as in a wide variety of pathologic disorders (34,52,65,66,67,68,69,70,71,72,73,74,75,76,77,78,79,80).
The hypointense signal correlates with Perls staining for ferric iron (34,35) and follows the same anatomic and age-related trend of iron deposition documented by other investigations of pathologic material (63). This signal loss probably arises from proton diffusion through local areas of magnetic homogeneity as a result of the iron-containing moieties (81,82).
The magnitude of this effect depends on several technical factors. Factors that increase the conspicuousness of the hypointense signal include a greater concentration of compartmentalized paramagnetic substance, an increased signal/noise ratio (e.g., increasing the TR), a prolonged TE, a longer interecho interval, use of gradient reversal for signal acquisition, and, most important in the current era, higher–field strength scanners (Figs. 15.9 and 15.10) (83,84). In practice, these changes are important to appreciate as being normal at 3 T and beyond, notwithstanding the fact that they are often less dramatic, because most T2-weighted imaging is performed with fast spin-echo techniques, which inherently minimize the apparent T2 shortening.
 |
 FIGURE 15.9 Brain iron, T2 fast spin echo, normal young adult. A young healthy adult imaged at 7 T shows very prominent hypointense normal iron deposition in structures similarly depicted at 1.5 T (substantia nigra, red nuclei) but also in subthalamic nuclei and lateral geniculate bodies. |
 FIGURE 15.10 Brain iron, fluid-attenuated inversion recovery, 1.5 versus 3 T. A 77-year-old with mild cognitive impairment shows far more prominent hypointense deep gray matter due to more sensitivity to brain iron at 3 T (right) compared to 1.5 T (left). |
 FIGURE 15.11 In this patient with a clinical diagnosis of multiple sclerosis, white matter involvement (hyperintense on this long–repetition time/echo time sequence) is extensive. Note the marked hypointense signal of the red nuclei, pars reticulata of the substantia nigra, thalami, globus pallidi, caudate, and putamen. |
Many processes lead to the final common pathway of marked hypointensity on T2-weighted images in the extrapyramidal nuclei, thalami, and deep white matter. These include demyelinating (multiple sclerosis) (Fig. 15.11) (76) and dysmyelinating processes (e.g., Pelizaeus–Merzbacher disease) (85) and cerebral infarctions (74,75). The mechanism by which iron accumulates in these sites is not understood completely (74,75). Insights from research on the transport pathway for brain iron, however, provide an interesting hypothesis. Intracellular iron has an important role in the metabolism of neurotransmitters and is normally found in the basal ganglia (86,87,88,89,90). Iron is taken up by capillary endothelial cells in the thalamus and extrapyramidal system after transferrin (the main iron-containing protein of the plasma) binds to a specific receptor on the cell surface (91,92). It is believed that iron is subsequently transported along neuronal axons to their sites of projection (75). It is possible that iron continues to accumulate at sites of uptake (i.e., in the extrapyramidal nuclei) despite interruptions of specific axonal projections by multiple causes (e.g., infarction, demyelination, and/or neurodegenerative disorders) (74,75). Because iron is still taken up but can no longer be transported, increased amounts would accumulate proximally (75).
Alzheimer Disease
Overview
AD is the most common cause of dementia in the elderly. The estimated current prevalence in the United States is 5.2 million individuals, with one in nine people over the age of 65 and about one-third of people over the age of 85 having AD (93). The incidence of AD doubles every 5 years after age 60 years. The estimated prevalence of AD by the year 2050 is 14 million individuals in the United States alone. AD is the most common illness leading to nursing home placement. Care for affected individuals costs up to 140 billion dollars per year in health care, nursing home, and lost productivity (94,95).
AD is characterized clinically by a progressive dementia, which typically begins with an isolated memory impairment. Declarative memory (i.e., memory for explicit factual material) is the most profoundly affected cognitive domain early in the disease course. No absolute diagnostic test exists for AD. The diagnosis is based on clinical criteria and requires demonstration of a progressive deficit in more than one cognitive domain, usually memory plus another, after other possible causes of dementia have been excluded (96). The definitive diagnosis of AD can be made only on examination of tissue and therefore requires either autopsy or biopsy.
AD is commonly categorized as early onset or late onset. Late-onset disease (after age 65 years) accounts for the vast majority, approximately 95% of the cases. The genetics of early onset AD, however, has provided great insight into disease mechanisms. Two major risk factors for typical late-onset AD are age and positive family history. Carriers of the apolipoprotein E (APOE) ε4 allele are also at increased risk relative to noncarriers for typical late-onset AD. More recent data indicate that metabolic syndrome and other vascular risk factors also increase risk for AD (97). Increased educational attainment and higher job complexity may reduce risk for late-onset AD.
In 2011, clinical diagnostic criteria for AD were revised under the auspices of the National Institute of Aging and the Alzheimer’s Association, which included imaging markers in the AD diagnostic criteria for the first time (98). These diagnostic criteria evolved at a time when new diagnostic imaging techniques for AD were developed, treatments intended to delay the progression of AD were undergoing evaluation, and interest in access to these new and promising diagnostic tests and potential treatments for the prevention of AD was growing. Responding to the current and future impact of AD, the United States Department of Health and Human Services developed a national plan to effectively prevent and treat AD. As a consequence, validating and standardizing diagnostic imaging markers for early AD became an area of active research with considerable clinical impact (99).
Genetics
The rare early-onset cases of AD present in individuals younger than the age of 65 years, some as young as the 30s. The majority of individuals with autosomal dominant transmitted AD have mutations in one of the three genes: the amyloid precursor protein (APP) gene on chromosome 21, the presenilin-1 gene on chromosome 14, and the presenilin-2 gene on chromosome 1 (100,101,102,103,104). These known autosomal dominant mutations are involved in metabolism of amyloid protein, which implicates disordered amyloid protein in the causal pathway leading to AD (105). In duplication of the APP locus on chromosome 21 is another cause of autosomal dominant early-onset AD cases with co-occuring cerebral amyloid angiopathy which may present with intracerebral hemorrhage (106).
The vast majority of prevalent AD cases are sporadic, with onset after age 65 years. Although a positive family history is a risk factor for late-onset AD, specific causative genetic mutations have not been identified. The ε 4 allele of APOE, however, increases the risk of developing AD and also lowers the mean age at onset of the disease (107,108,109,110). APOE is a component of lipoproteins and has been studied extensively in the fields of lipid metabolism and atherosclerosis. Three normally occurring alleles of APOE have been identified: ε 2, ε 3, and ε 4. All individuals carry two copies of the APOE gene, and with three different alleles, six genotypes are possible. APOE ε 3 is the most prevalent allele in the general population, with a frequency of roughly 80%. The APOE ε¾ genotype confers a roughly threefold increase in risk of developing AD, whereas
 confers an eightfold-increased risk of developing AD compared to the risk associated with the
 genotype. The ε 2 allele decreases the risk of developing AD; however, this protective effect is not as strong as the risk conferred to carriers of ε 4 allele. Efforts to discover molecular links to risk of sporadic disease have been based on genomewide association studies. A recent meta-analysis by the International Genomics Alzheimer’s project reported 20 replicable Alzheimer’s susceptibility loci including APOE (111). Genomewide association studies identifies common variants in case–control analysis and current next-generation sequencing efforts may identify more rare variants with larger risk for disease and these may also highlight molecular pathways implicated in sporadic disease. Discoveries of susceptibility genes may translate to genetic risk profiles for effective and individualized targeting of AD (112,113,114).
Mild Cognitive Impairment
Neurodegenerative diseases begin insidiously and in most cases progress gradually. This is the case with individuals who ultimately progress to clinically evident AD. The gradual onset and prolonged time course of AD and other degenerative dementing disorders stands in sharp contrast to many other medical conditions that have a clearly definable clinical onset and, often, resolution. Mild cognitive impairment (MCI) refers to this transitional phase between normality and clinically evident dementia (115). The critical clinical distinction between MCI and AD is preservation of functional independence in MCI. Patients who come to autopsy with the clinical diagnosis of amnestic MCI are typically found to have AD pathology at a stage intermediate between that found in normal aging and AD (116,117).
The fact that a declarative memory impairment is typically the first symptom observable in an individual who later develops AD led to codifying a clinical syndrome of amnestic MCI (aMCI) (118). aMCI is defined clinically as isolated memory impairment with other cognitive domains and activities of daily living intact. Longitudinal studies have demonstrated that a clinical diagnosis of aMCI is a significant risk factor for the subsequent development of AD. The rate of conversion from aMCI to AD is approximately 12% per year versus 1% to 2% per year for cognitively normal elderly persons (119). Within 5 years approximately 80% of individuals diagnosed with aMCI have converted to AD. The amnestic form of MCI was originally conceived as the earliest clinically evident manifestation of AD. More recently, the concept of MCI has been expanded to include MCI syndromes predominantly affecting cognitive domains other than memory—attention/executive, language, and visual/spatial (120). Current thinking is that MCI syndromes dominated by nonmemory impairments may in many cases represent prodromal evidence of non-AD dementias. However, these conceptual notions need validation in longitudinal clinical studies with pathologic confirmation.
According to the new guidelines by the National Institute of Aging and the Alzheimer’s Association, the prodromal stage of AD is characterized by MCI and research criteria further classifies MCI patients as MCI due to AD, based on biomarker evidence of AD pathophysiology such as Aβ deposition on positron emission tomography (PET) or hippocampal atrophy on MRI (121).
Treatment
Available treatments for AD are limited to symptomatic intervention (122). Cholinesterase inhibitors are mildly effective in patients in the mild to severe stages of the disease and produce slight improvements in cognition, functional activities of daily living, and behavioral abnormalities. The N-methyl-d-aspartate antagonist memantine is also mildly effective in patients with moderate to severe AD. Several interventions that looked promising in epidemiologic studies have not been shown to be effective in double-blind, placebo-controlled trials (94). These include estrogen replacement, vitamin E, and nonsteroidal anti-inflammatory drugs. No therapeutic intervention is available that delays or reverses progression of the disease. However, insight into the pathophysiology of AD in recent years has focused on the central role of disordered amyloid protein metabolism. Disease-modifying therapies focused on various targets in the amyloid cascade pathway are in development. These include active and passive immunization against Aβ protein, as well as both γ- and β-secretase inhibitors. Immunotherapy directed against Aβ protein has shown an ability to reduce cortical Aβ plaque deposition in a few autopsied cases (123); however, thus far these agents have not been associated with a clear clinical benefit. Ongoing studies of Aβ-directed therapies are now focused on preclinical stages of both sporadic and hereditary forms of AD (124,125). AD is often accompanied by depression in the earlier stages and behavioral symptoms in the later stages. Treatment of these symptoms is often necessary and is accomplished using standard therapeutic approaches.
No treatments have been explicitly approved by the U.S. Food and Drug Administration for amnestic MCI. Nonetheless, treatment of patients with aMCI with acetylcholinesterase inhibitors is common in clinical practice. Several clinical trials
have been conducted in MCI. One of these, the Alzheimer’s Disease Cooperative Study on Donepezil and Vitamin E, demonstrated reduction in the rate of progression from aMCI to AD for up to 24 months (126). Secondary outcome measures, such as specific cognitive instruments, corroborated a treatment effect of donepezil. No treatment effect was seen with vitamin E.
have been conducted in MCI. One of these, the Alzheimer’s Disease Cooperative Study on Donepezil and Vitamin E, demonstrated reduction in the rate of progression from aMCI to AD for up to 24 months (126). Secondary outcome measures, such as specific cognitive instruments, corroborated a treatment effect of donepezil. No treatment effect was seen with vitamin E.
Pathology/Etiology
The major pathologic features that characterize AD are senile plaques, neurofibrillary tangles, decreased synaptic density, neuron loss, and cerebral atrophy (127,128,129,130). Intense debate has centered on which of two primary neuropathologic deposits in AD, plaques or tangles, are causative. The anatomic distribution of neurofibrillary tangles is much more closely associated with the pattern of neuron loss and therefore with the clinical symptoms in AD (131,132). Conversely, genetic evidence strongly implicates a derangement in amyloid metabolism as the primary instigating factor in AD. Due to the high prevalence of tau neurofibrillary tangles and Aβ plaque pathology in cognitively normal elderly individuals, recent neuropathologic criteria suggest reporting of these as “AD neuropathologic change” independent on antemortem cognitive status.
It is well established that the neurofibrillary tau pathology of AD begins in the transentorhinal area and progresses to the hippocampus, to paralimbic and adjacent medial–basal temporal cortex, to neocortical association areas, and lastly to primary sensorimotor and visual areas (133). However, recent cross-sectional autopsy studies find that early tau neurofibrillary pathology may begin in the locus ceruleus and other subcortical nuclei in cognitively normal patients as young as the second decade of life (134,135). Neurofilaments and microtubules are the two major components of the neuronal cytoskeleton. Neurofilaments provide structural support and promote axonal and dendritic growth. Microtubules are primarily involved in the transport of materials between the cell body and its processes. Neurofibrillary tangles are the end result of the breakdown of the microtubule component of the neuronal cytoskeleton. A component of the microtubule system is tau protein. Neurofibrillary tangles consist of pathologic aggregates of tau protein (131). These pathologic aggregates form in the presence of hyperphosphorylation of the tau protein (Fig. 15.12). In this state the tau protein is no longer able to promote assembly and stability of microtubules. The hyperphosphorylated tau disassociates from the microtubule, and undergoes fibrillization to form insoluble neurofibrillary tangles inside neurons. The end result is collapse of the microtubule system, which disrupts axonal transport, and the formation of neurofibrillary tangles as well as dystrophic neurites that contain abundant tau filaments. Recent animal and cell model data find that pathologic or fibrillized tau may undergo a self-templating process to recruit normal soluble tau to form and propagate insoluble tau fibrils between neurons within the CNS (136,137,138). Despite the similarities to prion disease transmission between individuals, there currently is no data to suggest AD or other nonprion neurodegenerative diseases can be transmitted between humans and nonhuman primates. Indeed, despite the fact that infectious prion diseases are clearly zoonoses and there is no evidence that AD, Parkinson’s disease (PD), and related synucleinopathies, Aβopathies and tauopathies are infections or zoonotic diseases, the starker contrast between prions and nonprion neurodegenerative disease proteins with respect to infectivity comes from data on the very high prevalence of readily transmissible or infectious prion diseases in sheep, cattle, moose, elk, and other animals for which there is just no counterpart for tauopathies, Aβopathies, or synucleinopathies (139).
 FIGURE 15.12 Neurofibrillary tangles. Tau-stained neurofibrillary tangles inside dystrophic neuritis. |
 FIGURE 15.13 Senile plaque. Thioflavin staining of the amyloid core of a senile plaque. |
The second pathologic lesion associated with AD is the senile (neuritic) plaque. A neuritic plaque consists of a dense central Aβ core with inflammatory cells and dystrophic neurites in its periphery. The Aβ core is made up of fragments of the Aβ precursor protein (APP) that have aggregated into β-pleated sheets in the extracellular space (Fig. 15.13) (140). APP is a single-transmembrane protein found normally in membranes of intracellular organelles and cell membranes. Normal metabolism of APP includes cleavage by α-, β-, and γ-secretase, which results in several fragments (141). The most important of these with respect to AD pathology are the Aβ1–40 and Aβ1–42 fragments (142). These two fragments aggregate into dense β-pleated sheets that form the central core of amyloid plaques. Of the two, Aβ1–40 is more abundant, whereas Aβ1–42 is more prone to coalesce into insoluble, extracellular β-pleated fibrils (141). Soluble extracellular oligomeric Aβ1–42 and Aβ1–40 fibrils are believed to be neurotoxic. Further aggregation of oligomeric Aβ into protofibrils leads to formation of amyloid plaques in the extracellular space. Similar transmission studies have been performed in animal models that suggest Aβ species can also self-template and spread fibrillar pathology within the CNS; although this pathology remains largely extracellular. The known autosomal dominant mutations that lead to inevitable development of early-onset AD all are related to abnormal APP and Aβ metabolism. Individuals with early-onset AD due to AAP mutations, as well as individuals with Down syndrome (trisomy 21), “overproduce” Aβ peptides. The presenilin-1 and presenilin-2 mutations are associated with shifts
in APP metabolism toward the longer, more fibrillogenic Aβ1–42 fragments. With progressive accumulation of Aβ1–40 and Aβ1–42, extracellular amyloid plaques increase in size and attract other proteins, as well as an inflammatory response. Microglia are found at the periphery of the amyloid core, and astrocytes surround the microglia. Injury and death of neurons may be due to a direct cytotoxic effect of Aβ, by an inflammatory response to the developing plaques, or both. Clinical symptoms result from loss of synapses, cell death, and injury which are closely linked to the deposition and spread of tau neurofibrillary pathology. The exact link between early formation of Aβ plaques and later developing cortical neurofibrillary pathology remains elusive.
in APP metabolism toward the longer, more fibrillogenic Aβ1–42 fragments. With progressive accumulation of Aβ1–40 and Aβ1–42, extracellular amyloid plaques increase in size and attract other proteins, as well as an inflammatory response. Microglia are found at the periphery of the amyloid core, and astrocytes surround the microglia. Injury and death of neurons may be due to a direct cytotoxic effect of Aβ, by an inflammatory response to the developing plaques, or both. Clinical symptoms result from loss of synapses, cell death, and injury which are closely linked to the deposition and spread of tau neurofibrillary pathology. The exact link between early formation of Aβ plaques and later developing cortical neurofibrillary pathology remains elusive.
Imaging
Over the last two decades, there has been a great increase in the number of published studies applying neuroimaging techniques to the study of degenerative dementia, particularly AD. Many of the imaging techniques that have been applied to this field are ones that are already available and are routinely used in clinical practice, whereas others are primarily research approaches at this point. Structural MRI is an important component of the clinical evaluation of dementia patients. An imaging study is recommended as part of the initial clinical evaluation of all patients being seen for dementia to identify potentially treatable causes such as hydrocephalus, provide information relevant for differential diagnosis such as the presence of cerebral vascular disease, and provide exclusionary information needed to make a clinical diagnosis of AD (151,152). Investigators have sought to expand the role of imaging in the diagnosis of AD from one that traditionally has been primarily exclusionary to one that provides positive diagnostic information. The types of diagnostic information one would like to obtain in this instance pertain to differential diagnosis, prognostic information that would allow early detection and prediction of individuals who will develop dementia, and finally longitudinal assessments with serial scans to measure disease progression over time. Imaging can further be useful in assessing treatment outcomes in AD and may support the evidence of disease modification in clinical trials, potentially in smaller samples than that is needed to detect cognitive improvement. Thus, emerging disease-modifying therapies in AD has increased the need for biomarkers that can facilitate the clinical trials (153). Responding to this need, Alzheimer’s Disease Neuroimaging Initiative was conceived with both public and private funding in the United States, to identify and validate the best imaging and biofluid biomarkers for AD, leading to a decade of productivity in AD imaging and biofluid biomarkers (154).
Structural MRI in AD
Shrinkage or atrophy of the brain is one of the pathologic hallmarks of AD. The microscopic substrate of brain atrophy is presumed to be neuron shrinkage and death and synapse loss. Methods to assess cerebral atrophy can take one of two general forms. The first is visual assessment of scans for the presence and severity of cerebral atrophy (Fig. 15.14). The second general approach is quantification. Analysis of structural MRI data quantitatively can in turn be divided into two general approaches. The first includes region-of-interest (ROI) methods, in which data are extracted from regions of interest, typically in units of tissue volume for structural MRI. In essence, this approach converts grayscale images into numbers that can be used in traditional biostatistical analysis. The second quantitative approach is three-dimensional mapping in which voxelwise tools are used to perform image data analysis in “image space.”
Many of the early ROI studies focused on the hippocampus or other medial–temporal lobe structures. This is not surprising, given the early pathologic involvement of this area and the close link between damage to medial–temporal systems that subserve memory function and the memory deficit that characterizes AD. Cross-sectional case–control studies in patients with clinically established AD uniformly show that medial–temporal structures are more atrophic in patients than in age-matched controls (155,156). The most widely measured structure using the ROI approach is the hippocampus. One caveat is that the ability of an imaging measurement to separate controls from AD patients depends heavily on the inclusion criteria used for selecting both the control subjects and the AD patients. The younger and healthier the control subjects and the more severely impaired the AD group, the better is the diagnostic separation between controls and the AD patients. Cross-sectional case–control studies in patients with aMCI show that they have hippocampal and other ROI-based volumes that lie in an intermediate position between those of controls and AD patients (157,158,159,160). This is the relationship one would expect to find based on the fact that aMCI lies intermediate between normality and AD both clinically and pathologically.
Cross-sectional case–control comparisons in patients with clinically well-established AD constitute the least convincing evidence of the ability of an imaging test to make an early diagnosis of AD, whereas prediction of the subsequent risk of developing AD in clinically presymptomatic patients or patients
with MCI constitutes more convincing demonstration of the utility of an imaging test for early diagnosis. Longitudinal studies in which imaging is used to predict development of AD have shown that measurement of the hippocampal volume at baseline can predict the risk of progressing from aMCI to AD. Patients with more atrophic hippocampi have a greater risk of progressing to AD within a finite follow-up than do patients with less atrophic hippocampi (Fig. 15.15) (161,162,163,164). This same notion has been applied to cross-sectional measurements of other brain structures and also to measures of rates of change from serial studies. Patients with greater rates of brain shrinkage and ventricular expansion have a greater risk of subsequently progressing from aMCI to AD than do patients with lesser of rates of brain shrinkage and ventricular expansion. These types of studies have been done in both elderly aMCI patients who progress to typical late-onset AD and in patients with prodromal early-onset familial AD; they show that atrophy rate measures from serial MRI have power to predict future clinical course in individual patients (165,166,167).
with MCI constitutes more convincing demonstration of the utility of an imaging test for early diagnosis. Longitudinal studies in which imaging is used to predict development of AD have shown that measurement of the hippocampal volume at baseline can predict the risk of progressing from aMCI to AD. Patients with more atrophic hippocampi have a greater risk of progressing to AD within a finite follow-up than do patients with less atrophic hippocampi (Fig. 15.15) (161,162,163,164). This same notion has been applied to cross-sectional measurements of other brain structures and also to measures of rates of change from serial studies. Patients with greater rates of brain shrinkage and ventricular expansion have a greater risk of subsequently progressing from aMCI to AD than do patients with lesser of rates of brain shrinkage and ventricular expansion. These types of studies have been done in both elderly aMCI patients who progress to typical late-onset AD and in patients with prodromal early-onset familial AD; they show that atrophy rate measures from serial MRI have power to predict future clinical course in individual patients (165,166,167).
 FIGURE 15.14 Correlation between clinical disease severity in Alzheimer disease (AD) and degree of atrophy. Three women in their early 70s, from left to right: cognitively normal, amnestic mild cognitive impairment, and AD. (From Whitwell JL, Jack CR, Jr. Neuroimaging in dementia. Continuum 2007;13(2):180–203, with permission.) |
 FIGURE 15.15 Baseline hippocampal (Hipp) volume: relationship to progression from mild cognitive impairment (MCI) to AD. Hippocampal volume (adjusted for age, sex, and head size) and time to progression from amnestic MCI to Alzheimer disease (AD). Kaplan–Meyer curves of patients whose hippocampal volumes at baseline were at the 50th percentile or greater of cognitively normal controls; between the 50th and 1st percentile of controls; and at the 1st percentile or less of controls. The risk of progression is significantly related to the baseline hippocampal volume measurement. (From Jack CR Jr, Petersen RC, Xu Y, et al. Prediction of AD with MRI-based hippocampal volume in mild cognitive impairment. Neurology 1999;52:1397–1403, with permission.) |
A harmonized protocol for manual segmentation of hippocampal volumes has been developed by a task force from the European Alzheimer’s Disease Consortium (EADC) and Alzheimer’s Disease Neuroimaging Initiative (ADNI), and benchmark hippocampal labels were established. These benchmark hippocampal labels can be used as a concrete standard reference for qualification of human tracers measuring hippocampal volumes in neurodegenerative diseases (Fig. 15.16) (168).
Voxel-Based Analysis Methods
One of the most common voxel-based techniques is voxel-based morphometry (VBM), which compares groups of subjects and identifies differences in the patterns of gray matter density across the whole brain (169). VBM studies in AD have shown that the regions of greatest loss are in the medial–temporal lobe, but there is also extensive atrophy throughout the basal temporal lobe, lateral temporal and parietal neocortex, posterior cingulate and percutaneous, insula, temporoparietal association neocortex, and prefrontal cortex (170,171,172). Structures in the central gray matter are also involved that include the caudate putamen, thalamus, and hypothalamus.
VBM studies of aMCI show that when compared to age- and gender-matched normal control individuals, MCI patients display atrophy that is most intense in the hippocampal and other medial–temporal regions but also involves the basal temporal lobe and lateral temporoparietal association cortex, with lesser involvement in the prefrontal areas (Fig. 15.17) (173,174,175,176). These findings have been replicated in several studies of aMCI and are consistent with the notion that patients with aMCI occupy an intermediate position between normality and AD. The imaging findings mirror the clinical
and neuropathologic data that have emerged in the characterization of aMCI.
and neuropathologic data that have emerged in the characterization of aMCI.
 FIGURE 15.16 Selection of color-coded benchmark hippocampal label segmentations as demonstrated on a cognitively normal control subject. Slices are selected on the following basis: (1) the first rostral slice where the hippocampus was segmented by at least one master tracer, (2) the last caudal slice where the hippocampus was segmented by at least one master tracer, and (3) the central ones. As to the central ones, equally distant slices were chosen whenever possible. (Bocchetta M, Boccardi M, Ganzola R, et al. Harmonized benchmark labels of the hippocampus on magnetic resonance: the EADC-ADNI project. Alzheimer’s and Dementia 2014 e pub, with permission.) |
 FIGURE 15.17 Voxel-based morphometry of amnestic mild cognitive impairment (aMCI) and Alzheimer disease (AD), The extent of gray matter loss in aMCI is largely limited to the medial basal and lateral temporal lobe, whereas in AD more extensive gray matter loss is seen in a topographic distribution that matches the Braak and Braak staging of neurofibrillary pathology. (From Whitwell JL, Jack CR Jr. Neuroimaging in dementia. Continuum 2007;13(2):180–203, with permission.) |
Longitudinal Measures
Normal anatomic variation among individuals places limits on the diagnostic utility of cross-sectional structural MRI measures obtained at a single fixed point in time. Inter-subject variability in brain size and shape locally and globally can exceed the effect of disease. Therefore, there has been increasing interest in studying change in the brain over multiple serial MRI scans. Each subject acts as his or her own control, and this reduces the problem of loss of diagnostic power due to inter-subject anatomic variation. Rates of whole-brain atrophy and ventricular expansion can be calculated from pairs of scans that have been spatially registered. Rates of whole-brain atrophy in AD are reported in the 1.5% to 3% range (177,178,179). Rates of atrophy of the hippocampus are in the 4% to 6% per year range in AD patients (179,180). Multiple serial scans can be obtained over time to provide information about the trajectory of the disease (181,182,183). Rates of regional atrophy from voxel-based methods may be even more useful than rates of atrophy calculated with ROI-based approaches. Complex registration algorithm methods have been developed that provide detailed information delineating where in the brain atrophy has occurred over serial MRI studies. These techniques show widespread patterns of tissue loss in the temporal and parietal lobes, with relative sparing of the sensorimotor and visual cortices over time in AD patients (184,185).
Although these longitudinal measurement techniques are not used in clinical practice, the procedures could be applied to clinical practice if the technique was automated. What is also of great interest is the use of measures of rates of brain atrophy from serial MRI as an outcome measure in clinical therapeutic trials. Rates of brain atrophy have been used as both primary and secondary outcome measures in several Alzheimer therapeutic trials, and incorporating MRI rate measures is now common in therapeutic AD trials (186,187,188).
1H MR Spectroscopy in AD
A convincing body of literature exists documenting significant differences in certain 1H magnetic resonance spectroscopy (MRS) metabolites between controls and patients with established AD. For the most part the published 1H MRS literature has employed a cross-sectional case–control comparison design. In the literature, the metabolites that consistently differ between case and control sample groups are N-acetylaspartate (NAA) and myo-inositol (mI) (189,190,191,192,193,194). NAA is found in neurons, and a decrease in NAA follows logically from the neuron loss associated with AD. The reason for the elevation of mI in AD and Down syndrome is not entirely clear, but elevation in mI appears to precede the decline in NAA levels (195,196). mI elevations have been observed in cognitively normal older adults with high Aβ load in the absence of a decrease in NAA (197). Elevation in choline has also been described in AD, but this has not been found consistently.
Fewer spectroscopic studies have been performed comparing control to at-risk subjects. However, 1H MRS results in aMCI mirror those of structural MRI; aMCI patients are between controls and AD patients in both NAA and mI levels (Fig. 15.18) (195,198).
The few published longitudinal studies have shown expected correlations between longitudinal decline in NAA and disease progression over time in AD (199,200,201). In addition, serial 1H MRS has been used as an outcome measure in therapeutic trials (188).
 FIGURE 15.18 Proton magnetic resonance spectroscopy in control case, amnestic mild cognitive impairment (aMCI), and Alzheimer disease (AD). |
Diffusion-Weighted Imaging and Diffusion Tensor Imaging in AD
Diffusion-weighted imaging (DWI) and its more modern incarnation DTI are imaging techniques that are sensitive to the microscopic diffusion of water molecules in biologic tissue (202,203). A reasonable explanation for the relationship between AD pathology and abnormalities in diffusion is as follows. Cell membranes and intracellular structures act to impede the diffusion of water molecules. Pathologic disruption of cell membranes that occurs in AD increases the diffusivity of water. The coherence of directional water diffusion—FA—is also abnormal in AD (204,205,206). Although the MD is increased in AD, FA values are decreased due to loss of track integrity. In studies of aMCI, MD values in a variety of gray and white matter regions are elevated (195) and, as expected, lie at an intermediate position between AD and cognitively normal individuals. FA values are decreased in aMCI (207).
White matter diffusivity alterations primarily involve the frontal, temporal, and parietal association fibers but not the corticospinal tracts in AD (27,208). The fornix, cingulum tract, inferior longitudinal fasciculus, uncinate fasciculus, superior longitudinal fasciculus, corpus callosum are particularly vulnerable, with decreases in FA observed as early as the preclinical and prodromal stages (209). A common feature of these tracts is that they constitute the main corticocortical association and limbic pathways connecting the temporoparietal cortices and the frontal lobe, in concordance with the topographic progression of cortical degeneration, atrophy, and metabolic disruption in AD (210,211). This anatomic concordance between gray and white matter diffusivity changes in AD implies that the disruption in white matter tracts is closely associated with the cortical AD pathology.
Diffusion measures predict progression in MCI. Hippocampal MD values from DWI images were predictive of progression from aMCI to AD (212). In fact, the predictive power exceeded that of hippocampal volume measures in the group of aMCI patients studied.
MR Perfusion
A characteristic bilateral temporoparietal decrease in cerebral blood flow has been well documented in AD using nuclear medicine techniques (213,214). Initial MRI-based tissue perfusion investigations in AD used contrast bolus tracking methods (215,216), and these studies found perfusion patterns that mirrored the classically established patterns on [18F]fluorodeoxyglucose positron emission tomography (FDG-PET) and single-photon emission computed tomography (SPECT). More recently, application of arterial spin labeling (ASL) techniques to AD and other neurodegenerative diseases has emerged as an area of high interest (217,218). In theory, regional cerebral blood flow information currently obtained with SPECT, as well as its closely coupled physiologic parameter cerebral glucose metabolism by FDG-PET could be obtained noninvasively with ASL. Moreover, this information could be obtained with MRI in an integrated examination that included other MRI-based modalities. This is an active area of research, and it remains to be seen whether ASL measures of local tissue perfusion can achieve the same diagnostic sensitivity and specificity that have been demonstrated with FDG-PET. Initial studies indicate that ASL depicts a biparietal–temporal pattern of decreased perfusion that mirrors the FDG-PET glucose uptake findings that characterize AD (217,218).
Functional MRI
Functional MRI (fMRI) activation studies in aging and dementia have been performed in small numbers of patients at a few research sites. Most investigators have found decreased functional activation in patients with AD when compared to age-matched controls. Initial fMRI activation paradigms focused on memory, but investigators have extended this to paradigms that probe other cognitive domains (219,220,221,222,223,224,225). Due to difficulty with cooperation in patients with dementia, attention has to turn to activation studies in MCI (226,227,228,229,230,231,232,233). The notion of increased activation strength in aMCI and also asymptomatic individuals who are at elevated risk for developing AD have appeared in the literature. The rationale for increased activation in at-risk individuals is that they are able to compensate by “working harder” mentally to maintain cognitive function in the face of progressing pathology. The issue is controversial, in that some studies indicate that asymptomatic APOE 4 carriers and aMCI patients exhibit increased activation strength relative to controls, whereas others find decreased activation in aMCI patients relative to controls (227,230,234).
An alternative to task activation fMRI is resting-state fMRI. Here coincident intrinsic temporal fluctuations in fMRI signal intensity across areas of the brain are assumed to denote functionally connected networks (235,236). This has the obvious advantage compared to task activation fMRI in studying AD patients of not requiring the active cooperation of impaired patients. Resting-state fMRI investigation of AD has recently been extended by combining amyloid imaging with resting-state fMRI and finding that areas that are active in the resting state such as the default mode network coincide with areas that are particularly susceptible to amyloid deposition (237).
Molecular Imaging of AD-Related Pathology
Although this is an MRI text, the subject of imaging in dementia would be incomplete without at least some mention of molecular imaging of AD-related pathology with PET ligands. The most significant advance in recent years in imaging of dementia has been the development of nuclear medicine–based probes to label amyloid plaques or plaques and tangles (238,239,240,241). The ability to identify deposits of amyloid plaques and hyperphosphorylated tau in neurofibrillary tangles, which are the cardinal pathologic feature of the AD in living patients, has the ability to revolutionize patient diagnosis and management. Although a number of different Aβ-binding compounds have been developed and studied in humans, the compound that has been most extensively studied is C-11 Pittsburgh Compound B, commonly referred to as PIB (238) PIB binds to fibrillar Aβ plaques with high affinity. Initial clinical studies have been performed at more than 30 centers throughout the world, and results from these studies have been uniformly consistent. The newer 18F agents for Aβ-PET appear to show similar properties to PIB (242,243,244). Positive uptake of Aβ ligands is seen in most AD patients in precisely the same areas as would be expected from the known pathologic distribution of amyloid plaques in this disease (Fig. 15.19). Uptake of Aβ ligands is greatest in the frontal lobes, the posterior cingulate/precuneus, and the temporoparietal association cortex. Binding is typically low in the sensorimotor cortex and primary visual cortex. Binding is typically not present in the cerebellum, and therefore the cerebellum is used as a reference region. PIB uptake is significantly greater, on the order of two times in affected cortical areas in AD patients relative to controls. The prevalence of PIB positivity ranges from 20% to 34% in independent cohorts of cognitively normal individuals (245,246,247,248,249). This is expected, given the fact that up to 30% of individuals who are cognitive normal in life display AD pathology consistent with the pathologic diagnosis of AD at autopsy. This disassociation between Alzheimer pathology and observed clinical symptoms in roughly 10% to 30% of autopsied individuals is the topic of active study.
Evidence indicates that AD patients with greater levels of PIB binding at baseline have higher antecedent rates of brain atrophy on structural MRI (250). Greater PIB-binding levels are associated with more rapid rates of clinical decline in established AD. The value of PIB in longitudinal assessment of patients is unclear. The limited longitudinal data indicate
that serial PIB examinations in patients with established AD showed little or no change in PIB binding over time, even as the patients display precipitous cognitive decline (251,252,253). In addition to its utility as a tool for early diagnosis of AD, Aβ-PET has great potential value in the differential diagnosis of various dementia syndromes, particularly in differentiating AD from frontotemporal lobe dementia, with overall classification accuracy of 97% in cases with histopathologic confirmation (254). Of equal or greater importance is the potential use of Aβ-PET for identifying individuals who will benefit from amyloid targeted treatments and use of Aβ-PET as an outcome measure in therapeutic studies aimed at reduction of brain Aβ load.
that serial PIB examinations in patients with established AD showed little or no change in PIB binding over time, even as the patients display precipitous cognitive decline (251,252,253). In addition to its utility as a tool for early diagnosis of AD, Aβ-PET has great potential value in the differential diagnosis of various dementia syndromes, particularly in differentiating AD from frontotemporal lobe dementia, with overall classification accuracy of 97% in cases with histopathologic confirmation (254). Of equal or greater importance is the potential use of Aβ-PET for identifying individuals who will benefit from amyloid targeted treatments and use of Aβ-PET as an outcome measure in therapeutic studies aimed at reduction of brain Aβ load.
 FIGURE 15.19 Pittsburgh compound B binding in control (CN) individual, amnestic mild cognitive impairment (aMCI) patient, and Alzheimer disease (AD) patient. The color scale represents the ratio of target voxel uptake divided by cerebellar uptake. Nonspecific binding in white matter with no uptake in cortical areas is seen in the control subject. In contrast, uptake in cortical areas is pronounced in the AD patient. |
Recent development of new PET ligands for hyperphosphorylated tau along with Aβ ligands makes it possible to image the two pathologic hallmarks of AD with PET (255,256). The impact of tau ligands on understanding the pathophysiology of AD and on clinical practice is expected to be significant; however, specificity of these agents needs to be established with histopathologic correlations (Fig. 15.20). The imaging of both Aβ and tau will likely contribute independently to early diagnosis, differential diagnosis, and tracking disease progression in AD.
 FIGURE 15.20 MRI (left) and PET imaging with [11C]PBB3 (middle) and [11C]PIB (right) performed in the same AD (top) and normal control (NC; bottom) subjects. Coronal images containing the hippocampal formation (arrowheads) are displayed. [11]PBB3- and [11C]PIB-PET images were generated by estimating SUVRs at 30–70 and 50–70 min after radiotracer injection, respectively, and were superimposed on individual MRI data. In the hippocampal formation, prominently increased retention of [11C]PBB3 in the AD patient was in sharp contrast to the modest or negligible changes in [11 C]PIB binding as compared with NC. Scale ranges for SUVRs were 0.75–1.50 ([11C]PBB3) and 0.75–3.00 ([11C]PIB). (From Maruyama, M, Shimada, H, Suhara T et al. Imaging of tau pathology in a tauopathy mouse model and in Alzheimer patients compared to normal controls. Neuron 2013;79(6):10.1016/j.neuron.2013.07.037, with permission.) |
The Concept of Preclinical AD
Molecular imaging studies with Aβ-binding ligands have demonstrated that approximately a third of the population of cognitively normal individuals in the community have high cortical Aβ load (257). In cognitively normal individuals, high levels of Aβ deposition are associated with subtle cognitive deficits, cognitive decline, and a higher risk of cognitive impairments in the future. However, these relationships appear to be modified by the genetic markers such as the APOE ε 4 allele (246,258), lifestyle activities (259) or cognitive reserve (260). Carriers of APOE ε 4 allele perform worse on cognitive testing if they have high Aβ load than noncarriers. Similarly, a higher cognitive reserve attained by a higher education and greater lifetime intellectual activities is protective against the impact of Aβ load on cognitive performance.
According to the new guidelines by the National Institute of Aging and the Alzheimer’s Association, the research criteria for the diagnosis of preclinical AD require evidence of Aβ deposition for the diagnosis of preclinical AD either through molecular imaging or CSF biomarkers. Any additional imaging or biomarker evidence of AD-related neurodegeneration measured with AD-like pattern of atrophy on MRI or AD-like pattern of hypometabolism on FDG-PET as well as the presence of subtle cognitive difficulties in addition to the Aβ deposition increases the stage of preclinical AD from stage 1 to stage 3 (261), and increases the risk of progression to MCI (262). The staging of preclinical AD is based on the hypothetical model on temporal evolution of AD biomarkers (Fig. 14.21) (263).
Cerebral Vascular Disease
Overview
Cerebral vascular disease is regarded by some to be the second most common cause of dementia in the elderly after AD. Although pure vascular dementia is considered to be relatively uncommon, vascular contributions to cognitive impairment are quite common (264). When considering the role of cerebral vascular disease in dementia, it is, therefore, perhaps more
appropriate to regard cerebral vascular disease as a type of brain pathology that is common in the elderly and, in combination with other pathologies, particularly AD, is a common contributor to cognitive impairment and dementia. The rate of cognitive decline is greater in AD than in vascular dementia; however, the mortality rate is higher in vascular dementia than in AD (265).
appropriate to regard cerebral vascular disease as a type of brain pathology that is common in the elderly and, in combination with other pathologies, particularly AD, is a common contributor to cognitive impairment and dementia. The rate of cognitive decline is greater in AD than in vascular dementia; however, the mortality rate is higher in vascular dementia than in AD (265).
 FIGURE 15.21 Temporal evolution of AD biomarkers (A). Biomarker model of pure AD. The horizontal axis represents time and the vertical axis severity of biomarker abnormality from completely normal (min) to abnormal (max). The threshold for biomarker detection of pathophysiology is denoted by a horizontal black line. The gray area denotes the zone in which abnormal pathophysiology lies below the biomarker detection threshold. Amyloid biomarkers become abnormal first, followed by CSF tau, followed by FDG-PET and MRI. Cognitive impairment (green-filled area) is the last event in the progression of the disease. A range of cognitive responses are possible that depend on the individual’s risk profile. The cognitive response curve is shifted to the left for those with low cognitive reserve and to the right for those with high cognitive reserve. At a given point on the disease time line, a person with high cognitive reserve can be cognitively normal while a low cognitive reserve person with the same biomarker profile is impaired. All biomarker curves (as well as cognitive impairment) are configured as sigmoids, but the curves have a progressively steeper slope in the right-hand tail for later-changing biomarkers. The right-hand tails of the curves are dashed, indicating that biomarker trajectories in end-stage dementia are unknown at this time. MCI, mild cognitive impairment. (B) Amyloid-first biomarker model of late-onset AD where comorbid pathologies are likely. Figure labels are as in (A), except here the CSF tau, structural MRI, and FDG-PET are grouped under the generic neurodegenerative label. This reflects the fact that neurodegenerative biomarkers can be nonspecific and that the proportional contribution of various possible neurodegenerative processes cannot be known in vivo. We assume that in most elderly individuals, tauopathy, non-AD neurodegenerative pathologies, or both arise first but lie beneath the detection threshold of biomarkers of neurodegeneration. Aβopathy arises later independently and β-amyloid biomarkers become abnormal first. The neurodegeneration curve has a shallow slope initially but steepens after the onset of β-amyloidosis. (C) Neurodegeneration-first biomarker model of late-onset AD where comorbid pathologies are likely. Figure labels are as in (A), except here one or more neurodegenerative biomarkers become abnormal first, reflecting the onset of tauopathy, other neurodegenerative pathologies, or both prior to β-amyloid. Observing the onset of an abnormal neurodegenerative biomarker prior to an abnormal amyloid biomarker does not alter the role of β-amyloid as an inducer of neurodegeneration. This is indicated by showing the neurodegeneration curve with a shallow slope initially, which steepens after the onset of β-amyloidosis. (Jack CR Jr, Holtzman DM. Biomarker modeling of Alzheimer’s disease. Neuron 2013;80(6):1347–1358, with permission.) |
It is helpful to begin a discussion of vascular dementia with some pertinent definitions (266). A stroke is a clinical event. Cerebral infarction is a pathologic or imaging abnormality due to cerebral ischemia. Vascular cognitive impairment is the one that can be attributed to brain injury due to cerebral ischemia. Vascular dementia is a subset of vascular cognitive impairment in which cognitive impairment due to vascular brain injury results in significant functional impairment. Vascular dementia can occur with or without a discrete clinical event or events but occurs far more commonly with them. Vascular dementia can occur without any obvious imaging abnormalities, but it occurs much more commonly with significant abnormalities on MR studies.
Epidemiology
In epidemiologic studies vascular brain injury is the second most common contributor to dementia after AD. Incidence rates of vascular dementia range from 11 per 1,000 after age 65 years (267) to 2 per 1,000 (268). The incidence and prevalence of vascular cognitive impairment and vascular dementia increase with age (269). Whereas cerebral vascular disease is often identified as the second most common cause of dementia in epidemiologic series, pure vascular dementia is distinctly uncommon in most clinic-based autopsy series. There are several possible explanations for this discrepancy. The first is sample bias. Stroke patients tend not to participate in dementia clinics, which are the source of subjects in many clinic-based estimates of prevalence. In contrast, patients with dementia and stroke are ascertained using epidemiologic methods. The second reason for the discrepancies in estimated prevalence of vascular dementia in the literature is due to the fact that a single standardized definition of vascular dementia does not exist. A variety of research scales exist for determining a clinical diagnosis of vascular dementia. Older scales did not include imaging criteria, whereas newer ones do. The individual scales vary in sensitivity and specificity with respect to a pathologic gold standard. Third, current criteria for dementia are “Alzheimerized” in the sense that a memory component is a required cardinal feature. The clinical presentation of vascular brain injury is highly heterogeneous, and thus many patients who would qualify for diagnosis of dementia on the basis of functional impairment are under-ascertained if a prominent memory component does not happen to be present.
Clinical–Pathologic Correlation
Because of the heterogeneity in presentation and lack of orderly topographic progression of vascular pathology, no accepted pathologic staging instrument for vascular brain injury exists that would be analogous to Braak and Braak staging of neurofibrillary or amyloid pathology or Consortium to Establish a Registry for Alzheimer’s Disease (CERAD) staging for plaques. Identifying specific homogeneous clinical–pathologic subtypes of vascular cognitive impairment and vascular dementia is difficult due to the heterogeneity of vascular brain injury and the fact that the clinical result in any affected individual is a combination of the anatomic areas involved by vascular brain injury plus that individual’s cognitive reserve and innate coping mechanisms (266). For example, whereas strategically placed single infarctions (in the hippocampus, medial thalamus, caudate) can produce a dementia syndrome, at the same time extensive evidence of vascular brain injury can be identified in individuals who display no obvious evidence of cognitive impairment. Nonetheless, generalizations can be made. Cortical infarctions generally produce deficits matching the functional areas affected. For example, dominant temporal lobe infarctions tend to result in impairment in language comprehension and use. Subcortical infarctions—lacunar infarctions in central gray or adjacent white matter—can lead to a subcortical syndrome also known as a lacunar state (271). The clinical expression is one of the impaired executive functions, slowing of processing speed, gate disturbance, and extrapyramidal signs (272). Memory disturbances tend to be variable and less severe. A clinical syndrome associated with severe confluent white matter ischemic disease has been termed Binswanger syndrome. The clinical expression is a decline in cognition, gate apraxia, and urinary incontinence (273).
The most common infarct pathology identified in autopsy cohorts of older adults is microinfarcts (<1 mm) that is not visible on conventional structural MRI exams (274). Microinfarcts are associated with cognitive impairment with deficits in perceptual speed, semantic memory, and episodic memory, and commonly coexist with AD pathology (275). The National Institute on Aging-Alzheimer’s Association (NIA-AA) guidelines for the neuropathologic diagnosis of AD suggest a standardized approach to enumerate microscopic vascular brain injury (ischemic or hemorrhagic infarctions) with the presence ≥2 microscopic infarcts or ≥1 gross infarcts considered to contribute to cognitive deficits (276).
Far more common than dementia due solely to vascular brain injury is a mixed dementia in which vascular brain injury is a contributing pathologic feature most typically with concurrent AD (277,278). Both vascular brain injury and AD increase with age. Both pathologies commonly coexist in the same individual. Both AD pathology and vascular brain injury exist in a spectrum of severity in individuals, ranging from very mild pathology with no obvious clinical findings to severe pathology resulting in dementia. Evidence from carefully performed longitudinal clinical studies with autopsy endpoints (277,278) has shown that vascular brain injury is a common potentiator of AD pathology. AD pathology alone can exist with or without dementia, but the combination of the two commonly results in dementia. The evidence indicates that the effects of AD pathology and vascular brain injury on cognitive expression are additive and not multiplicative (266). The recent emphasis on the frequency of mixed pathologic contributors to dementia provides an interesting historical perspective. Twenty-five to 30 years ago dementia was typically ascribed to vascular brain injury. Ten years ago dementia in the elderly was most frequently ascribed to AD pathology alone. The pendulum now seems to be swinging back, with recognition that patients with dementia most frequently display mixtures of AD, vascular brain injury, and in some cases LBs and TDP-43 pathology at autopsy. Indeed, a large autopsy study finds a higher rate of CVD in AD compared with other age-associated neurodegenerative diseases, and this vascular disease burden may lower the threshold for cognitive impairments due to AD neuropathology (279). CADASIL—cerebral autosomal dominant arteriopathy with subcortical infarcts and leukoencephalopathy—is a genetically determined form of cerebral vascular disease due to a mutation affecting the notch three gene (280). This mutation affects roughly 500 families worldwide. The condition is characterized by degeneration of vascular smooth muscle in arterioles. MRI is characterized by typical white matter hyperintensities plus white matter hyperintensities in the temporal stem and corpus callosum, which distinguish this condition from garden variety white matter disease. Evidence of multiple areas of cerebral hemorrhage is also characteristic of this condition.
Amyloid angiopathy is a condition characterized by infiltration of the arterial wall by amyloid protein. This results in lobar hemorrhages, which have a tendency to affect the occipital lobe more frequently than other areas of the brain. The condition also results in multiple areas of cerebral microhemorrhage.
Amyloid angiopathy is a condition characterized by infiltration of the arterial wall by amyloid protein. This results in lobar hemorrhages, which have a tendency to affect the occipital lobe more frequently than other areas of the brain. The condition also results in multiple areas of cerebral microhemorrhage.
 FIGURE 15.22 Lacunar infarctions and white matter hyperintensities. |
Imaging
The cerebral vascular arterial tree can be divided into conducting and penetrating arterial supplies. An infarction in the distribution of the large conducting arteries on the surface of the brain will involve the gray matter ribbon and underlying white matter. Infarction or impaired blood flow in the distribution of the penetrating arterioles will involve the hemispheric white matter or the central gray matter nuclei. Numerous radiographic terms have been coined to describe the varying levels of severity of white matter ischemic disease; one of the most popular is leukoaraiosis, which was coined in the CT era. Others are white matter ischemic disease, Binswanger disease, and white matter hyperintensities. Pathologically at the mild end of the spectrum one finds periventricular myelin pallor, astrocytosis, and partial loss of periventricular myelin in oligodendroglia. In the mildest cases these changes are limited to the periventricular zones (281). In more advanced cases, however, the changes extend away from the ventricular surface of the semicentrum semiovale. The magnitude of the ischemic change can range from minor loss to frank cavitary necrosis. The process is characterized by sparing of the cortex and subarcuate fibers. Subcortical vascular disease is associated with fibrohyalinoid thickening, sclerosis, and corkscrew deformities of the penetrating arterials (Fig. 15.22).
Modern MRI provides an excellent representation of the pathology of vascular brain injury with an obvious major advantage: Imaging is obtained in life, so that the relevant pathologic features can be related immediately to observed clinical events. Special note should be made of MRI interpretation of focal signal abnormalities in the central, gray, and immediately adjacent white matter tracts. The parietal pontine tracts in the posterior portion of the internal capsule normally have less myelin staining than adjacent white matter tracts. These areas, therefore, may appear as bilaterally symmetric focal bright areas and are a normal variant not to be confused with ischemic disease (33). Hyperintense foci exist in many normal younger and middle-aged individuals anterior and lateral to the frontal horns. The myelin content is decreased in this area, accounting in part for the increased signal. In addition, the ependymal lining may be focally discontinuous in this area with adjacent gliosis, a benign variant termed ependymitis granularis (38). Dilated perivascular spaces should be distinguished from lacunar infarctions. Dilated perivascular spaces are commonly seen in the anterior-inferior portion of the putamen and adjacent white matter tracts. Whereas dilated perivascular spaces can normally be seen in younger individuals, their prevalence and size increase with advancing age presumably due to increasing tortuosity of penetrating medullary arterioles (281). Useful guidelines to distinguish dilated perivascular spaces from lacunar infarction are that lacunar infarctions are typically larger than 5 mm in diameter, are not symmetric, and are not isointense to CSF on all imaging sequences unless they have undergone cystic change. Conversely, dilated perivascular spaces are usually isointense to CSF on all pulse sequences, are bilaterally symmetric, are less than 5 mm in diameter, and are located in the inferior one-third of the putamen. Microhemorrhages can be associated with hypertension, CADASIL, and amyloid angiopathy, and are best identified on sequences that are sensitive to local susceptibility effects such as T2*-weighted or, more recently, susceptibility-weighted imaging sequences. Microhemorrhages are commonly associated with in amyloid angiopathy. Microhemorrhages tend to involve the posterior temporal, parietal, and occipital lobes more than the frontal lobe and their density correlates with Aβ load on PET (282) (Fig. 15.23A). Superficial siderosis is far less common than microhemorrhages in the older populations with approximately 7 in 1,000 individuals showing hemosiderin deposits due to hemorrhage into the subarachnoid space. Superficial siderosis is a sensitive marker of amyloid angiopathy found in 60.5% of autopsy proven cases (Fig. 15.23B) (283).
The prevalence and incidence of microhemorrhages has recently become an important consideration for inclusion and adverse events in AD therapeutic trials with Aβ-lowering agents (284). It has been hypothesized that a massive clearance of Aβ with immunotherapy further strains the vessel wall impaired by cerebral amyloid angiopathy and increases the risk for microhemorrhages and vasogenic edema (284). Thus, the presence of substantial numbers of microhemorrhages before the initiation of Aβ immunotherapy may increase the risk for subsequent development of vasogenic edema and microhemorrhages during treatment. The natural history of microhemorrhages needs to be established to aid in designing amyloid-modifying therapeutic trials, and for interpreting vasogenic edema and microhemorrhages that may occur as an adverse event during these trials for prevention and treatment of AD.
Although MRI is generally a very precise representation of the actual underlying pathology, microinfarcts may evade
detection on imaging. Microinfarcts are by definition invisible to the naked eye; however, their impact on structural MRI biomarkers may be significant. Brain atrophy rates in autopsied cases with microinfarcts are higher than controls with no microinfarcts. Furthermore, cases with microinfarcts have a higher prevalence of macroinfarcts on MRI suggesting a common etiology among these infarct pathologies (285).
detection on imaging. Microinfarcts are by definition invisible to the naked eye; however, their impact on structural MRI biomarkers may be significant. Brain atrophy rates in autopsied cases with microinfarcts are higher than controls with no microinfarcts. Furthermore, cases with microinfarcts have a higher prevalence of macroinfarcts on MRI suggesting a common etiology among these infarct pathologies (285).
 FIGURE 15.23 Multiple microhemorrhages (A) and superficial siderosis (B) on T2* gradient echo MRI. |
Difficulties in relating imaging to clinical presentation are the same as those in relating pathology to clinical presentation. The pattern of cognitive deficits varies as a function of the unique location of the areas of the brain involved with vascular brain injury in each individual subject. Compensatory capacity is highly variable from subject to subject. Thus, the relationship between the location and size of vascular brain injury and the severity of cognitive impairment is variable from subject to subject.
Dementia with Lewy Bodies
Overview
The defining neuropathology of dementia with LBs (DLB) is pathologic aggregation of α-synuclein protein in neurites to form LB and Lewy neurites (LNs) (286). LBs were first described by Frederick Lewy in a series of patients with parkinsonism. DLB is considered to be the second most common neurodegenerative cause of dementia in the elderly, accounting for up to 20% of dementia cases. DLB is slightly more common in men than women.
Clinical Features
Clinical diagnostic criteria for DLB have undergone several revisions, most recently in 2005 (287). Features of the diagnostic criteria are ranked as central, core, suggestive, and supportive. The central feature that is essential for a diagnosis is dementia. Core features are fluctuating cognition, recurrent visual hallucinations, and spontaneous parkinsonism. Suggestive features are rapid eye movement (REM), sleep behavior disorder, severe neuroleptic sensitivity, and functional imaging showing low dopamine transporter activity in the basal ganglia. Supportive features are repeated falls and syncope, transient unexplained loss of consciousness, autonomic dysfunction, other types of hallucinations, delusions, depression, nonatrophic medial–temporal lobe structures on MRI, decreased occipital perfusion on SPECT or PET imaging, low uptake on metaiodobenzylguanidine myocardial scintigraphy, and prominent slow-wave activity on electroencephalogram with temporal lobe transient sharp waves. Revised criteria for the clinical diagnosis of DLB include probable DLB and possible DLB. In addition to the central feature of dementia, a diagnosis of probable DLB is made in the presence of two or more core features or one core feature plus one suggestive feature. A diagnosis of possible DLB requires one core feature or no core features plus one or more suggestive features.
Cognitive symptoms in DLB usually have a gradual onset and progression. A prominent feature is the presence of fluctuations in cognitive performance or attention, which may last from seconds to hours (286). Although AD and DLB present with impairment of episodic memory, DLB patients often show worse performance on nonmemory tests of executive function or visual/spatial perception than AD patients. In contrast, memory impairment is typically worse in AD patients than in those with DLB.
Patients with pathologically confirmed DLB often have LBs and LNs as well as coexistent AD pathology at autopsy. Thus, clinical differentiation of these two disorders is often problematic, and some clinicians have proposed that some of the clinical features ascribed to DLB in fact may be due to coexistent AD pathology. Another diagnostic difficulty is the differentiation of DLB from PD with dementia or PDD. The central pathology in both is the presence of cortical and subcortical LBs and LNs. The two disorders share a number of clinical features, including motor symptoms and dementia (286). In the past the distinction was made by the arbitrary requirement of a 1-year interval between the onset of cognitive symptoms and motor symptoms. With relaxation of this 1-year criterion in the revised diagnostic criteria (287), a diagnosis of DLB is made if cognitive symptoms predominate early in the clinical presentation, and a diagnosis of PDD is made if motor symptoms predominate early in the clinical presentation. Debate is ongoing on whether to classify PDD and DLB as separate entities or unite them under a single entity of LB disease.
Pathology
Cortical LBs are pale eosinophilic inclusions and LNs are similar inclusions in neuronal processes. LBs and LNs in DLB are identical to their counterparts in patients with PD. In DLB, dystrophic LNs in the neocortex are located in an anatomic distribution that mirrors the distribution of LBs (288) and both are readily detected with antibodies to α-synuclein.
α-Synuclein pathology increases in prevalence with age and can be seen in proximately 10% of nondemented elderly individuals without motor impairment that come to autopsy (116). These “incidental” LBs may reflect presymptomatic PD/DLB.
LBs that are restricted to the amygdala are less often associated with clinical symptoms than LBs found in the limbic cortex or neocortex, and they are present in this pattern in up to 50% of AD patients (149). Braak and Braak proposed an α-synuclein pathologic staging system analogous to the staging system they proposed for neurofibrillary pathology and Aβ deposits in AD (289). In this staging system, α-synuclein pathology first appears in brainstem nuclei such as the locus ceruleus and reticular activating system, then spreads to substantia nigra, and later spreads to limbic and basal cortical regions, particularly basal, frontal, and occipital. This staging system provides a clinical–pathologic link to the observation that REM sleep behavior disorder is a sentinel sign of LB disorders, with the early sleep disturbance attributed to α-synuclein pathology in the brainstem sleep-regulatory centers. Similar to tau, recent key animal and cell model studies find evidence that pathologic α-synuclein may also seed and transmit pathology between neurons (290,291). The transmission process may be central in disease pathogenesis as transmission models of PD/DLB recapitulate neuronal cell death and reduced survival seen in human disease.
LBs that are restricted to the amygdala are less often associated with clinical symptoms than LBs found in the limbic cortex or neocortex, and they are present in this pattern in up to 50% of AD patients (149). Braak and Braak proposed an α-synuclein pathologic staging system analogous to the staging system they proposed for neurofibrillary pathology and Aβ deposits in AD (289). In this staging system, α-synuclein pathology first appears in brainstem nuclei such as the locus ceruleus and reticular activating system, then spreads to substantia nigra, and later spreads to limbic and basal cortical regions, particularly basal, frontal, and occipital. This staging system provides a clinical–pathologic link to the observation that REM sleep behavior disorder is a sentinel sign of LB disorders, with the early sleep disturbance attributed to α-synuclein pathology in the brainstem sleep-regulatory centers. Similar to tau, recent key animal and cell model studies find evidence that pathologic α-synuclein may also seed and transmit pathology between neurons (290,291). The transmission process may be central in disease pathogenesis as transmission models of PD/DLB recapitulate neuronal cell death and reduced survival seen in human disease.
In AD and frontotemporal lobe degeneration (FTLD), observed clinical symptoms are closely related to the selective regional atrophy patterns that characterize the disease. For example, the memory impairment that is characteristic of AD is closely related to atrophy in the medial–temporal limbic areas that subserve declarative memory function. In contrast, both behavioral and cognitive symptoms in DLB seem to be more closely related to α-synuclein deposits in the limbic cortex and neocortex and deficits in specific neurotransmitter systems such as dopamine, acetylcholine, and serotonin. As mentioned above, there are considerable clinical and pathologic overlaps with AD, as the majority of patients with DLB have a significant amount of Aβ plaque and less often tau neurofibrillary neuropathology (292). Future work with emerging biomarkers for tau, Aβ, and α-synuclein pathology will help define the specific clinical correlates of these pathologies across AD, PD, and DLB.
Imaging
MRI findings in DLB have largely been exclusionary. The absence of significant hippocampal/medial–temporal atrophy is included as a supportive feature of DLB in differentiating this condition from AD. However, it is important to note that DLB patients with mixed AD pathology may have hippocampal atrophy. In fact, smaller hippocampal volume in a patient with DLB is associated with a higher AD-related neurofibrillary tangle stage (293). VBM has been used to examine patterns of atrophy in groups of DLB patients. A pattern of focal atrophy confined to the dorsal pontomesencephalic junction, peri–third ventricular gray matter, and substantia innominata was identified on a VBM study in DLB (294). These anatomic findings match the expected anatomic distribution of LBs and loss of gray matter nuclei associated with specific neurotransmitter systems such as the cholinergic system. The dorsal pontomesencephalic gray matter loss was associated with a pathologic diagnosis of DLB in an autopsy-confirmed cohort (293). Imaging features associated with DLB have largely been associated with nuclear medicine techniques. These include occipital hypoperfusion and glucose metabolism with functional imaging; decreased dopamine transporter activity in the basal ganglia with SPECT or PET radioligands; and decreased uptake of metaiodobenzylguanidine on cardiac scintigraphy. A specific pattern of decreased precuneus and cuneus metabolism and relative preservation of the posterior cingulate gyrus metabolism designated as the “cingulate island sign” has been observed in DLB (Fig. 15.24) (295,296).
Because Aβ pathology is common in DLB even in the absence of significant AD-related neurofibrillary tangle pathology, the presence of intermediate to high Aβ load may be insufficient to determine the predominant pathology contributing to the dementia syndrome. In keeping with the autopsy data, 60% to 80% of DLB patients (297,298,299,300) have high Aβ load on PET. Thus high levels of amyloid load may be insufficient in distinguishing these dementia syndromes from AD and a multi-modality imaging approach may be useful. For example, FDG-PET, Aβ-PET, and structural MRI are complementary in distinguishing patients with AD and DLB (297), and can be used for predicting the presence of mixed AD pathology in patients with DLB (297) Furthermore, molecular imaging of the impaired nigrostriatal dopaminergic transmission in DLB with (123) I-N-fluoropropy-2beta-carbomethoxy-3beta-(4-iodophenyl)-N-(3-fluoropropyl) nortropane ([123] I-FP-CIT) with SPECT (301) or loss of monoaminergic terminal integrity with vesicular monoamine transporter type 2 (VMAT2) radioligands may further detect the LB-related pathologic features in cases with mixed dementia and be complementary to Aβ-PET.
 FIGURE 15.24 Cingulate island sign in dementia with Lewy bodies. Sparing of the posterior cingulate relative to the precuneus and cuneus metabolism on F18-FDG-PET imaging is a characteristic feature of dementia with Lewy bodies (DLB) and can be used to distinguish DLB from Alzheimer’s disease. Absence of cingulate island sign in patients fulfilling the clinical criteria for dementia with Lewy bodies, suggest presence of Braak stage IV–VI neurofibrillary tangle pathology in addition to Lewy body disease. |
Parkinsonism—Diseases of Substantia Nigra
Proteins are the predominant product of gene expression (302). Recent histopathologic and genetic insights have shown that pathologic protein folding appears to underlie neurodegenerative disorders (302,303,304,305,306). Proper synthesis, folding, translocation, and clearance of proteins are necessary for cellular health. When proteins undergo misfolding, they may acquire toxic states that result in cellular dysfunction. The abnormal intraneuronal protein identified in AD is tau; the abnormal intraneuronal protein identified in PD is α-synuclein (which is a major protein component of LBs and LNs) (302,303,304,305,306,307,308). However, overlap of these abnormal proteins found in the primary parkinsonian syndromes and in neurodegenerative dementias exists. Recognition of this overlap has led to a revised classification of the primary parkinsonian syndromes and primary neurodegenerative dementias (303,304,305,306,307,308) (Table 15.2). The neuropathologic and genetic advances that have permitted development of this rational classification scheme will likely result in the development of more effective therapies for these devastating disorders (303,305,306,307,308,309).
TABLE 15.2 Revised Classification of Primary Parkinsonian Syndromes and their Relation to Primary Neurodegenerative Dementias: An Evolving Concept of Neurodegenerative Disorders | ||||||
|---|---|---|---|---|---|---|
| ||||||
Primary parkinsonian syndromes include PD, PSP, CBD, and multiple system atrophy (MSA), but PSP and CBD are more commonly classified as forms of FTLD due to the pathologic inclusions composed of tau (i.e., FTLD-Tau) and frequent clinical overlap with FTD cognitive/behavioral syndromes. MSA and PD are synucleinopathies. Subtypes of MSA include MSA–parkinsonism (MSA-P) (formerly called striatonigral degeneration), MSA–cerebellar type (MSA-C) (formerly called olivopontocerebellar degeneration), and MSA–Shy–Drager syndrome (SDS) (307,308,310).
Secondary parkinsonism can occur after infarction, infection, or trauma or be drug or toxin induced (34). Manganese neurotoxicity can produce parkinsonism (or other neurologic disorders) and shows characteristic hyperintense signal on T1-weighted sequences within the globus pallidi (Fig. 15.25) (311,312). The neurologic and neuroimaging manifestations of manganese neurotoxicity have been reported with acquired hepatocerebral syndromes (313), with long-term parenteral nutrition, with exposure to chronic welding fumes without proper ventilation (311), and recently with hemodialysis (312). Some, but not all patients with hyperintense globus pallidi on T1-weighted images due to manganese deposition have clinically evident parkinsonism and/or other neurologic abnormalities.
Parkinson Disease
PD, first described by James Parkinson in 1817 (314,315), is characterized by the classic clinical triad of resting tremor, rigidity, and akinesia (316). These neurologic signs are primarily the result of malfunction of the major efferent projection of the substantia nigra—the nigrostriatal tract (317). The cell bodies of this dopaminergic system are in the pars compacta of the substantia nigra, and its axons ascend to the striatum (318). Clinical manifestations of parkinsonism are thought to first become apparent after a loss of 80% of nigral dopaminergic neurons (314).
PD is the second most common neurodegenerative disorder, after AD (319). Greater than 1 million people in North America have PD (316). Age is the greatest risk factor (316); age of onset usually is between 50 and 60 years of life (314). With the increasing age of the population, the prevalence of PD can be expected to rise (316). Although usually sporadic, recent investigations have reported rare cases of familial (genetic) PD (302,303,304,305,306,307,308). This discovery has led to profound insights into the much commoner sporadic form of the disease. Recently, in a meta-analysis of PD genome-wide association studies, 28 independent risk variants for PD across 24 loci were identified (320).
 FIGURE 15.25 Acquired hepatocerebral degeneration. Axial magnetic resonance, repetition time (TR)/echo time 600/20. Note the bilateral hyperintense signal of the globus pallidi. This abnormal hyperintense signal on the short-TR sequences is due to paramagnetic T1 shortening after manganese deposition. Biliary excretion of manganese is impaired with liver disease. Abnormal cerebral manganese deposition with identical imaging findings has been reported in patients with congenital portal-systemic shunt without intrinsic liver disease, in patients who received long-term parenteral nutrition, and with exposure to chronic welding fumes without proper ventilation. |
PD is progressive, without remissions or exacerbations; however, the course and prognosis are often not uniform (314). This devastating disease not only results in significant debility during life, but also significantly increases mortality when compared to age-matched controls (316). Neurodegenerative diseases as a group (including AD, PD, and ALS) are projected to exceed cancer as the second most common cause of death in the elderly by the year 2040 (316).
Asymmetry of neurologic signs, the presence of a resting tremor (classically 4 to 6 Hz), and a good therapeutic response to levodopa usually permit clinical differentiation of PD from other parkinsonian disorders (316). However, in autopsy series it is estimated that the antemortem diagnosis of PD was incorrect in 24% of cases (316,321,322). This, in part, is due to overlap of differential clinical features. For example, whereas asymmetry of neurologic signs is characteristic of PD, CBD may also show asymmetry of signs, and whereas a good therapeutic response to levodopa is typical of PD, some patients with MSA or PSP may also show an effective therapeutic response to levodopa, at least initially (316). MRI does, however, show distinct neuroimaging features of these different primary parkinsonian disorders, which aids in further refining the in vivo diagnosis. Cognitive impairment and dementia (PDD) is common in PD and develops in >80% of patients throughout the course of disease (323). Dementia increases morbidity as well as the cost of care for PD patients and PDD is commonly due to the progression of LBs/LNs to involve cortex, but AD pathology also may account for dementia in PDD in about a third of subjects (292,324).
The neuropathologic hallmark of PD is loss of neuromelanin-containing neurons, with gliosis and LB/LN formation in the substantia nigra (primarily the pars compacta) (Fig. 15.26), the locus ceruleus, the dorsal nucleus of the vagus, the substantia
innominata, and several other regions. Recent genetic and histologic advances have led to the recognition that α-synuclein filaments are the building blocks of LBs and LNs (302,303,304,305,306,307,308). As mentioned above, there is evidence that α-synuclein fibrillar inclusions may spread between neurons trans-synaptically in DLB and PD/PDD (290,291). Figure 15.27 shows a model that illustrates α-synuclein misfolding, which in turn leads to the formation and spread of LBs and LNs. As noted above, the neuropathologic correlates of dementia in PD are complex but the spread of α-synuclein pathology to neocortical regions is the strongest correlate of dementia in PD. Comorbid AD neuropathology is present in up to 50% of PDD patients and may possibly accelerate neocortical α-synuclein pathology formation and spread, resulting in a shorter interval from onset of motor impairments to dementia in PDD (292,324).
innominata, and several other regions. Recent genetic and histologic advances have led to the recognition that α-synuclein filaments are the building blocks of LBs and LNs (302,303,304,305,306,307,308). As mentioned above, there is evidence that α-synuclein fibrillar inclusions may spread between neurons trans-synaptically in DLB and PD/PDD (290,291). Figure 15.27 shows a model that illustrates α-synuclein misfolding, which in turn leads to the formation and spread of LBs and LNs. As noted above, the neuropathologic correlates of dementia in PD are complex but the spread of α-synuclein pathology to neocortical regions is the strongest correlate of dementia in PD. Comorbid AD neuropathology is present in up to 50% of PDD patients and may possibly accelerate neocortical α-synuclein pathology formation and spread, resulting in a shorter interval from onset of motor impairments to dementia in PDD (292,324).
 FIGURE 15.26 Neuropathology of classic Lewy body Parkinson disease (PD). A: Gross pathology, axial section, of the midbrain. From top to bottom: the cerebral peduncles, substantia nigra, red nuclei, cerebral aqueduct, and superior colliculi (partly cut off). The substantia nigra shows pronounced depigmentation. B: Histopathology of substantia nigra in PD. Brown pigments are neuromelanin in neurons of substantia nigra. This section shows marked neuronal loss and loss of neuromelanin; normally. brown pigments would encompass the entire field. C: Lewy body in pigmented neuron of substantia nigra in PD, antiserum to neurofilament. Lewy body is the brown-stained round intraneuronal inclusion with a peripheral halo toward the bottom of the figure. The small punctate brown pigment is neuromelanin within residual neurons of the substantia nigra. D: Electron micrograph of substantia nigra Lewy body from a patient with PD. (From Trojanowski JQ, Schmidt ML, Otvos L, et al. Vulnerability of neuronal cytoskeleton in aging and Alzheimer disease: widespread involvement of all three major filament systems. Annu Rev Gerontol Geriatr 1990;10:167–182, with permission.) |
Conventional MRI using standard sequences does not show diagnostic features of PD. Several advanced MR techniques, however, have been developed that appear accurately to depict neuroimaging features of this disorder. One advanced MRI technique directly images the known neuropathologic degeneration of the substantia nigra in PD using heavily T1-weighted inversion recovery (IR) sequences (325,326) (Fig. 15.28). White matter–suppressed IR sequences, in which the inversion time (TI) was chosen to minimize signal from white matter, were subtracted from gray matter–suppressed IR sequences, in which the TI was chosen to minimize signal from gray matter. In normal individuals, the subtracted images show hypointense signal of the substantia nigra. Compared to controls, PD patients show a smaller area of this hypointense substantia nigra, especially at its lateral aspect (325,326). This imaging finding likely reflects the known neuropathology of PD of neuronal loss of the substantia nigra, which is greater laterally than medially.
Earlier investigators similarly sought directly to image this neurodegeneration of the substantia nigra. In contrast to the foregoing approach, however, these investigators used long-TR, long-TE sequences to visualize the degeneration of the substantia nigra (327,328). Compared to controls, PD patients had diminished the width of the relatively hyperintense band (interpreted as the pars compacta of the substantia nigra) between the more relatively hypointense red nuclei posteriorly and the relatively hypointense pars compacta of the substantia nigra anteriorly; overlap, however, between PD patients and controls was observed (327,328). This finding was believed to be due to selective neuronal loss of the pars compacta of the substantia nigra and/or increased iron deposition. A recent investigation, however, reported that long-TR, long-TE sequences do not permit anatomic localization of the pars compacta of the substantia nigra (329). This suggests the imaging findings of diminished width of the hyperintense band more likely is due to greater iron deposition within the substantia nigra in PD compared
to controls. In fact, using T2* gradient-echo sequences, several investigators found greater susceptibility effects within the substantia nigra in PD patients than controls (330,331,332).
to controls. In fact, using T2* gradient-echo sequences, several investigators found greater susceptibility effects within the substantia nigra in PD patients than controls (330,331,332).
 FIGURE 15.27 Alpha-synuclein (α-syn) mediated neurodegeneration: This illustrates hypothetical processes whereby normal α-syn is converted into pathologic α-syn that fibrillize and deposits into LBs of affected neurons in PD. Genetic abnormalities and environmental factors may accelerate this process. Quality-control systems (chaperones, ubiquitin proteosome and phagolysosome systems) that prevent/reverse protein misfolding or eliminate misfolded proteins are overwhelmed. Growing data suggest that the progression of PD and related disorders may be linked to the cell-to-cell spread of pathologic species of α-syn as illustrated in the upper right of the figure. The toxic consequences of pathologic α-syn are illustrated in the box at lower right. |
DTI detects changes in the nigrostriatal tract in PD (333). Compared to controls, PD patients had a significantly decreased FA along a line between the substantia nigra and the striatum (putamen and caudate nuclei). This decrease in FA is believed to reflect the loss of nigrostriatal dopaminergic neurons in PD.
 FIGURE 15.28 Heavily T1-weighted inversion recovery (IR) images depict neurodegeneration of the substantia nigra in Parkinson disease (PD). Gray matter–suppressed (GMS) IR images are in the left column, white matter–suppressed (WMS) IR images are in the middle column, and subtraction images (GMS–WMS) are in the right column. Matched control (MC) images are in the top two rows, and images of a patient with PD are in the bottom two rows. Neurodegeneration of the substantia nigra, the gross pathologic hallmark of PD, is imaged as reduced hypointensity of the substantia nigra in the PD patient compared with the control (MC). (From Minati L, Grisoli M, Carella F, et al. Imaging degeneration of the substantia nigra in Parkinson disease with inversion-recovery MR Imaging. Am J Neuroradiol 2007;28:309–313, with permission.) |
The Parkinson’s Progression Marker’s Initiative was established to identify biomarkers of PD, and biomarkers of prodromal and preclinical stages of PD (334). Cortical thinning on structural MRI was associated with early cognitive decline (335). Further study is required to determine the clinical utility of these investigational assessments in PD. Biomarkers of AD is also investigated due to the aforementioned overlap with AD neuropathology in PDD. Biofluid biomarkers of AD may be useful for prognosis of cognitive function in PD patients and to determine contribution of AD-related pathology to the cognitive impairment and dementia in patients with PD (336,337,338). Finally, TDP-43 pathology may co-occur in PD, PDD, and DLB, but far less commonly than in AD (339).
In addition to conventional treatment with levodopa, several effective neurosurgical therapeutic options for PD are available. These include medial pallidotomy (340) and deep brain stimulation after placement of an electrode within the subthalamic nucleus (341). Neuroimaging is necessary in anatomic targeting prior to stereotactic surgery for PD (342). An integration of the dataset from both CT and MRI is useful in optimal anatomic targeting (342). Under very carefully controlled circumstances, fMRI study was safely performed in patients who underwent deep-brain stimulation of electrodes within their subthalamic nuclei (341). The investigators found that stimulation of the subthalamic nucleus elicited activation within the ipsilateral globus pallidus external and thalamus.
Related posts:
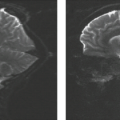
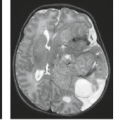
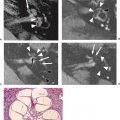
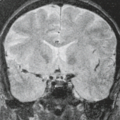
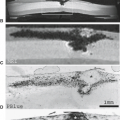
Stay updated, free articles. Join our Telegram channel

Full access? Get Clinical Tree


