Skull Base
Hillary R. Kelly
Jan W. Casselman
Mary Beth Cunnane
Hugh D. Curtin
Imaging of the skull base is usually done as a survey addressing symptoms of pain or cranial nerve dysfunction, or to assess a known tumor found by nasal endoscopy. Both magnetic resonance imaging (MRI) and computed tomography (CT) are very sensitive to pathology of the skull base, but over the last two decades of innovation in imaging, it has become apparent that high-quality MRI is vital to both diagnosis and treatment planning in this neuroanatomic region. Once a lesion is identified, several major issues must be addressed. First, the identity of the lesion is important. The radiologist uses both anatomic location (Fig. 16.1) and imaging characteristics to arrive at a best approximation of the diagnosis preoperatively. Second, newer surgical strategies and focused high-energy treatment methodology require precise definition of the extent of a lesion. Finally, except in a few special circumstances, the definitive diagnosis will require biopsy, and so potential routes for safe biopsy are extremely important. The first section of this chapter discusses general concepts about detection and margin definition. How does one differentiate lesions from the normal structures of the skull base? The next section deals with identification of specific lesions using position and various imaging characteristics as a guide to the evaluation. This section emphasizes tumors but mentions pathologies likely to be confused with tumors. Congenital abnormalities tend to present differently and will be addressed at the end of the chapter but are covered more thoroughly in another chapter.
General Concepts: Normal Versus Abnormal
The radiologist must differentiate a lesion from the normal structures of the skull base. The interface of the tumor with bone, muscle, and fat must be defined in the same way as in other regions of the body. Problems specific to the skull base include showing the margin of the tumor relative to the cavernous sinus and differentiating tumor from an obstructed paranasal sinus.
Bone
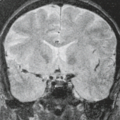
The cortex of the skull base is represented as a signal void. The bone may or may not have a medullary cavity. For example, the clivus has a significant marrow cavity, whereas the roofs of the orbit and the ethmoid sinus do not. If the medullary cavity is filled with fatty yellow marrow, tumor can be differentiated from either cortex or marrow based on signal difference. On unenhanced T1-weighted images, the tumor is almost always intermediate in signal intensity. The tumor can be seen passing through the signal void of the cortex and replaces the normal high signal of the fatty marrow (Fig. 16.2).
There can be several problems in making this determination. First, if, as in a young child, the marrow has not yet been replaced with fat, differentiation of tumor from marrow can be difficult or impossible (Fig. 16.3). The tumor may have a very similar appearance to this hematopoietic marrow on the various sequences (1,2,3,4,5,6,7,8,9,10,11,12,13).
Second, if a thin, bony cortex does not completely fill a voxel, then normal soft tissue immediately adjacent to the thin bone will give enough signal to eliminate the signal void. This is especially true when a thin bone is oblique to the plane of imaging. High resolution (high matrix, small field of view) makes this less of a problem.
Third, the contiguous area may have no signal or low enough signal that the cortical bone cannot be distinguished confidently. This is a particular problem in the roof of the ethmoid. Air in the sinus below is a signal void, and the cerebrospinal fluid (CSF) above is also low enough in signal that the ethmoid roof disappears. Usually, with high-resolution MRI, the mucosa and dura give enough signal to identify even thin cortical bone (Fig. 16.4). Definition of very fine cortical bony structures, such as the ethmoid septations, roof of the ethmoid, or the wall of the carotid canal, still requires high-resolution CT.
Other sequences can be helpful in determining bone invasion. Tumor frequently will enhance after administration of gadolinium. If the tissue on the opposite side of the bone (such as the dura) enhances more than usual, then the bone is obviously involved even though the cortex is not visible (see Fig. 16.2). If fat suppression is used after gadolinium, the enhancing tumor may be visualized within the marrow as well. The tumor enhances, whereas the fat within the marrow is suppressed. Again, in children, care must be taken because hematopoietic marrow can have the same appearance as tumor on all sequences.
Care must be taken when using fat suppression in skull base imaging (4). Susceptibility effects caused by an air/tissue interface may cause artifacts obscuring important structures. Susceptibility shifts the resonant frequency of nonfat tissues into the suppression range. “Blooming” of the sphenoid sinus can obscure the normal structures (Fig. 16.5). Of particular concern are the neural foramina. These structures can be separated from the air of the sphenoid sinus by a very thin shell of cortical bone. Even a small “susceptibility bloom” obscures these important structures. One can certainly use fat suppression sequences as long as one is careful to document that the foramen is visualized and is normal. An alternative method (used at our institution) is to compare pre- and postcontrast images without the use of fat suppression. A high-resolution, high-matrix sequence gives
excellent visualization of the foramina and their contents (see Fig. 16.4). Enhancing tumor does move toward the appearance of fat on a nonfat-suppressed, T1-weighted sequence, but it does not actually reach the same intensity. Wider windowing shows that fat is brighter than the tumor, and thus the interface can be defined.
excellent visualization of the foramina and their contents (see Fig. 16.4). Enhancing tumor does move toward the appearance of fat on a nonfat-suppressed, T1-weighted sequence, but it does not actually reach the same intensity. Wider windowing shows that fat is brighter than the tumor, and thus the interface can be defined.
 FIGURE 16.1 Anatomic sites of skull base masses. A: Coronal schematic section through orbits. B: Coronal section through cavernous sinuses. C: Coronal schematic section through right temporal bone. |
 FIGURE 16.2 Nasopharyngeal carcinoma invading the skull base. A: Coronal T1-weighted image shows the tumor arising in the nasopharynx on the left side. The intermediate signal of the tumor extends into the pterygoid process obliterating the fat signal within the bone (compare with high signal of fat on the opposite side [large white arrow]). The signal void of the cortex of the bone (small white arrows) has been destroyed. Compare with normal signal void on the opposite normal side (arrowhead). B: Coronal T1-weighted image after gadolinium shows enhancement of the tumor (T). The lesion originated in the nasopharynx (small arrowhead) and extended to the dura of the middle cranial fossa close to the second division of the trigeminal nerve (arrow). The normal nerve is seen on the opposite side (large arrowhead). LP, lateral pterygoid, lower belly. |
Soft Tissues
The soft tissues beneath the skull base are similar to soft tissues in other regions of the body. Tumor, although variable in appearance, can usually be separated from muscle and fat using the combination of T1 and T2 (Fig. 16.6). Usually, the tumor has about the same signal on the short–repetition time (TR) sequence as does muscle, but the long-TR sequence can make the differentiation. Comparison of pre- and postgadolinium sequences can be very helpful in finding the interface of tumor and normal soft tissue.
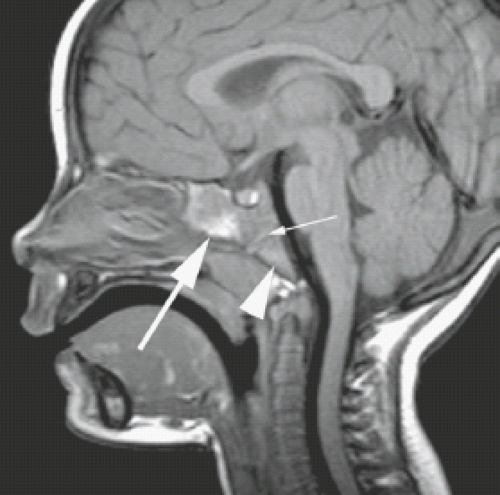 FIGURE 16.3 Normal clivus in a young child. Sagittal T1-weighted image shows a small amount of fat in the basisphenoid (large arrow) but residual hematopoietic marrow in the basiocciput (arrowhead). The red marrow could be confused with neoplastic involvement of the basiocciput. Fatty replacement of the clivus generally occurs by age 6 years (thin arrow). Spheno-occipital synchondrosis. |
Considerable fat surrounds the various muscle groups in the infratemporal fossa, orbit, and elsewhere beneath the skull base. As tumor invades this fat, the normal high signal on the short-TR sequence is obliterated by the more intermediate signal of tumor. Gadolinium enhancement can make a tumor less obvious. If windowing is not precise, fat and enhancing tumor can have the same appearance. Again, wider windowing allows interface definition. We emphasize comparison of the pre- and postcontrast images for this crucial information, but fat suppression is a reasonable alternative.
 FIGURE 16.4 Normal coronal high-resolution T1-weighted image. Individual nerves passing through the cavernous sinus are visualized (white arrows). Note the slight enhancement around the visualized second division of the Vth nerve within the foramen rotundum (FR). The cortex of the bone (black arrows) of the hard palate and along the medial margin of the pterygoid process is visible because of the signal from the thin mucosa immediately adjacent. P, pterygoid process. |
 FIGURE 16.5 Imaging with and without fat saturation. A: Postgadolinium coronal T1-weighted image without fat saturation demonstrates the normal appearance of foramen rotundum bilaterally (arrows). B: Similar sequence with fat saturation pulse shows artifactual suppression of the area of interest due to susceptibility effect related to air in the sphenoid sinus. |
 FIGURE 16.6 Nasopharyngeal carcinoma abutting the petroclival synchondrosis. A: Axial T1-weighted MR image shows the tumor (T) filling the nasopharynx with soft tissue invasion at the fossa of Rosenmuller. Note the high signal of the normal fat separating the tumor from the lateral pterygoid muscle (LP). C, carotid artery; arrow, hypoglossal canal; arrowhead, fat in the basiocciput. B: Axial T1-weighted image slightly inferior to the image in panel A shows an abnormal node of Rouviere. The tumor and prevertebral muscles have approximately the same signal. C: T2-weighted MR image shows clear differentiation of tumor (T) from the prevertebral muscles (arrow). Large tumor mass fills the nasopharynx. There is extension into the prevertebral muscles (white arrow) as well as the muscles of the pharyngeal wall. D: Axial T1-weighted MR image postgadolinium. The tumor (T) enhances more than the muscles but has lower signal than the fat. E: Coronal T1-weighted MR image postgadolinium. Tumor (T) fills the nasopharynx. The right node (N) of Rouviere is abnormal. Arrow, area of foramen ovale; arrowhead, third division of trigeminal. F: Coronal T1-weighted MR image postgadolinium slightly posterior to the image in panel E. The tumor (T) is situated just inferior to the petrooccipital (petrobasal) synchondrosis (arrow). M, Meckel’s cave; C, carotid artery. |
The cavernous sinus is a plexus of venous sinusoids adjacent to the sella and body of the sphenoid bone. In common usage, the term “cavernous sinus region” refers to the entire parasellar area including the investing dura, Meckel’s cave, and the parasellar segments of the cranial nerves III through VI. Tumor can reach the area by direct extension or by following the many nerves that traverse the cavernous sinus and Meckel’s cave.
On T1-weighted images, tumor and the cavernous sinus have the same appearance. When gadolinium is given, the cavernous sinus and tumor both enhance. However, the slow flow in the cavernous sinus usually gives more signal than the tumor, so a tumor margin can be detected if the image is windowed properly.
Paranasal Sinuses
As a tumor grows within a sinus, the signal void of air is replaced by signal representing tumor. However, inflammation or obstruction also gives signal within the sinus. If the tumor margin is to be clearly identified, the radiologist must separate inflammatory/obstructive from neoplastic signal. Because the tumor often causes the obstruction of the sinus, both tumor and obstructive changes can be found within the same sinus cavity.
One can be relatively sure that a sinus is obstructed rather than involved by tumor if the signal is very bright on the T2-weighted sequence (Fig. 16.7). Many tumors are relatively bright, but they seldom are as intense as an obstructed sinus. One can be even more confident if the high-signal area conforms exactly to the expected configuration of the sinus in question and if the septations within the sinuses are intact.
As more experience is gained with MRI, the variety of possible appearances of benign sinus disease has increased significantly. A simple acute obstruction has low or intermediate signal on T1 and a high signal on T2 weighting. As the obstruction becomes more chronic, the protein concentration of the retained secretions increases (5). The mucoid material becomes more viscous. With increased protein content in the secretions, the signal intensity on a T1-weighted image increases. The sinus is bright on both T1-weighted and T2-weighted images (Fig. 16.8). Further increases in protein concentration cause gradually decreasing signal on both T1 and T2 sequences. Finally, as the protein content approaches 35%, there is a relative signal void (Fig. 16.9). This can mimic air, even though the sinus is completely obstructed. The secretions at this phase are the consistency of a thick paste or even a solid.
At our institution, the very dark appearance of a chronically obstructed sinus is seen most commonly when there is secondary colonization with the fungus Aspergillus. This fungus and others accumulate various metallic ions, giving a secondary paramagnetic effect and further decreasing the signal (6,7). Other observers have described similar imaging findings in longstanding obstruction without fungus (8,9). Hemorrhage into the sinus at any time during the course of the disease may further complicate the appearance of the nonneoplastic sinus (10).
Relative high signal on T1-weighted images is unusual in tumors and so favors obstruction. Melanoma or hemorrhage into a tumor can be exceptions, but if the high signal fills the sinus, obstruction is much more likely.
Intravenous contrast is very helpful in identifying an obstructed sinus. The mucosa lining the circumference of the sinus enhances but the central mucus-filled cavity does not (see Fig. 16.7C) (11). Tumors, by comparison, almost always enhance to some degree.
Even though both tumor and benign changes can have a wider spectrum of appearance than was initially hoped, MRI can, in most cases, make a reliable determination of the margin of a tumor relative to the obstructed sinus. As each case is analyzed using multiple-pulse sequences, the signal characteristics of the tumor differ enough from the sinus in question that an accurate determination can be made (see Figs. 16.7 and 16.8).
Carotid Artery and Optic Nerve
The carotid artery and the optic nerve are crucial landmarks in skull base tumor staging and deserve special mention. The relationship of a tumor to these landmarks is a significant factor in determination of surgical approach.
At our institution, we begin with MRI. Usually the boundaries of a lesion can be defined by using the multiple planes available. The carotid artery is well seen as a signal void. If a definable separation can be documented between the tumor and the carotid artery, then the issue is resolved. If the tumor surrounds the artery, then the vessel is clearly involved. Luminal narrowing may indicate invasion of the arterial wall itself or simple compression.
 FIGURE 16.7 Ethmoid malignancy obstructing sphenoid sinus. A: Axial T1-weighted image shows abnormal signal in the ethmoid and sphenoid air cells. It is difficult to differentiate the tumor from the adjacent obstructed air cells. B: Axial T2-weighted image. On this T2-weighted image, the neoplasm (arrow) has relatively low signal. The adjacent obstructed air cell of the left sphenoid sinus shows high signal (arrowhead). The high-signal abnormality conforms to the expected configuration of the air cells. C: Postgadolinium T1-weighted image shows enhancement of the normal mucosa (arrow). The obstructed secretions within the sinus do not enhance, confirming that this is an obstructed sinus rather than a tumor. |
 FIGURE 16.8 Esthesioneuroblastoma. A: Axial enhanced computed tomography scan shows opacification of the upper nasal cavity and sphenoid air cells. Beam-hardening artifact (arrow) gives the impression that the enhancing mass protrudes into the sphenoid air cells. Actual tumor (arrowhead). B: Unenhanced T1-weighted image. There is a mass in the nasal cavity (large arrow) of intermediate signal intensity. The right sphenoid air cell (small arrow) is obstructed, but on this T1-weighted image its contents cannot be differentiated from tumor. The left sphenoid air cell (curved arrow) is also obstructed but has high-signal contents, easily differentiated from tumor. C: Postcontrast T1-weighted image. After gadolinium the esthesioneuroblastoma enhances (arrow). There is peripheral enhancement of the obstructed right sphenoid air cell (arrowhead). D: Axial T2-weighted image. The neoplasm (large arrow) is isointense with brain. Some of the obstructed air cells have high signal (small arrow), whereas the left sphenoid air cell has a signal intensity similar to that of the tumor. With magnetic resonance imaging, tumor can be differentiated from obstructed sinus in most cases by comparing the various sequences. |
If, on MRI, a lesion of the sphenoid sinus or the petrous temporal bone appears to abut the carotid artery, then CT is done in an attempt to assess the integrity of the bone separating the sinus and the artery (Figs. 16.10 and 16.11).
The optic nerve passes through the optic canal in the upper sphenoid bone. The relationship of tumor to the optic nerve can be appreciated on MRI. If a tumor of the sphenoid sinus abuts the nerve, CT is used to determine whether the bony cortex separating the nerve from the sinus is intact.
The optic nerve is not considered a conduit for perineural extension of tumor. Meningioma and glioma can certainly grow along the nerve, but tumors arising outside of the nerve tend to compress or invade but do not usually grow along it. Enhancement of the optic nerve can mean compression or invasion. Enhancement also can be seen in radiation neuritis.
Tumor, Masses, and Infection
Although the final determination of the identity of a lesion almost always requires biopsy, the radiologist is usually asked to predict the identity of the pathology preoperatively. Using the apparent site of origin and the imaging appearance, the radiologist can often be quite accurate in at least limiting the number of possibilities. One of the most important predictors
of tumor identity is the apparent site of origin. Some tumors have a very strong tendency to arise at a particular location and almost never occur in other regions. Other tumors, such as meningioma and metastatic disease, can occur almost anywhere. For the purposes of this discussion, the skull base can be divided into three regions. The anterior region represents the floor of the anterior cranial fossa including the orbital roofs and the cribriform region. The central region is represented almost entirely by the sphenoid bone and contiguous tissues. This area includes the basiocciput, body of the sphenoid, the sella, planum sphenoidale, cavernous sinus, and, more laterally, the greater wing of the sphenoid. The posterolateral region is the temporal bone. This classification is based on commonality of tumor type and, to some extent, surgical approach. This section begins with a description of lesions that can arise in most areas of the skull base. An evaluation follows of the specific regions emphasizing tumors that are relatively specific to those regions. Because some lesions can occur occasionally in several regions but are more typically found in one area, there is some redundancy, with some entities included in more than one section.
of tumor identity is the apparent site of origin. Some tumors have a very strong tendency to arise at a particular location and almost never occur in other regions. Other tumors, such as meningioma and metastatic disease, can occur almost anywhere. For the purposes of this discussion, the skull base can be divided into three regions. The anterior region represents the floor of the anterior cranial fossa including the orbital roofs and the cribriform region. The central region is represented almost entirely by the sphenoid bone and contiguous tissues. This area includes the basiocciput, body of the sphenoid, the sella, planum sphenoidale, cavernous sinus, and, more laterally, the greater wing of the sphenoid. The posterolateral region is the temporal bone. This classification is based on commonality of tumor type and, to some extent, surgical approach. This section begins with a description of lesions that can arise in most areas of the skull base. An evaluation follows of the specific regions emphasizing tumors that are relatively specific to those regions. Because some lesions can occur occasionally in several regions but are more typically found in one area, there is some redundancy, with some entities included in more than one section.
 FIGURE 16.9 Fungal sinusitis. A: Coronal nonenhanced computed tomography. The sphenoid sinus is opaque, but the air cell on the right (arrow) is denser than the one on the left. B: Postcontrast T1-weighted magnetic resonance image (MR image). The right-sided air cell has a thin, enhancing mucosa surrounding a signal void (large arrow). Even though it is completely obstructed, this sinus appears to be aerated, having similar signal characteristics to the air in the nasopharynx. At surgery, this sinus contained an Aspergillus mycetoma. The left sphenoid air cell has a more typical appearance of an obstructed sinus with a thick, enhancing mucosal lining (arrowheads) surrounding nonenhancing secretions (small arrow). On T2-weighted image, there was no signal in the right sinus. |
 FIGURE 16.10 Carcinoma of the sphenoid sinus with bone erosion at carotid impression and optic canal. A: Axial T1-weighted image postgadolinium. The tumor (T) fills much of the upper sinus. The bone separating the tumor from the carotid arteries (C) is not visualized on either side. B: Coronal T1-weighted image postgadolinium. The tumor (T) borders the optic canal (O) on the right but not the left. C: Coronal T1-weighted image postgadolinium. The tumor (T) borders the optic nerve (O), but we cannot visualize the bone cortex of the canal. The tumor appears to extend through the planum sphenoidale on the right. The bone is visualized as a signal void on the left (arrow). The dura is involved. D: Coronal T1-weighted image after gadolinium. The tumor abuts both carotid arteries (C). E: Axial computed tomography (CT) bone algorithm, level of the carotid impression. The bone of the carotid impression (C) on the left is intact. The groove is eroded on the right. Compare with panel A. F: Axial CT bone algorithm level of the optic canal. The optic canal (O) is intact on the left but eroded on the right (arrowhead). G: Coronal bone algorithm through the optic canal. The bone cortex of the optic canal is visualized on the left (arrow) but is eroded on the right. Compare with panels B and C. H: Coronal CT. The bone (arrow) separating tumor from carotid artery on the left is intact but is eroded on the right (arrowhead). Compare with panel D. |
Lesions Occurring in All Regions
Some pathology can occur in any part of the skull base. Such lesions originate from tissues and structures common to all parts of the skull base. All regions contain bone covered by dura. Sinuses or air cells perforate the major osseous components of the skull base. There are soft tissues contiguous to all bony areas.
 FIGURE 16.11 Inverted papilloma. A: Postgadolinium axial T1-weighted image demonstrates an avidly enhancing lesion filling the sphenoid sinus. The tumor reaches the left carotid canal, however it is difficult to tell whether there is erosion of the canal itself (arrow). B: Bone algorithm computed tomography demonstrates loss of the carotid canal (arrow). This is an unusual location for an inverted papilloma, which more commonly arises at the middle meatus and lateral wall of the nasal cavity. |
 FIGURE 16.12 Meningioma. A: Coronal T1-weighted MR image. The left anterior clinoid (small arrow) is enlarged due to hyperostosis (compare with the normal right anterior clinoid [large arrow]). The soft tissue component of the meningioma is difficult to see because it is isointense with adjacent brain. The arrowheads indicate the margin of the tumor. B: Coronal enhanced MRI at the same level as in panel A. The intracranial component of the lesion is much more conspicuous following contrast. Note that there is a dural tail of abnormally enhancing but only minimally thickened meninges surrounding the main tumor bulk (large arrows). |
Dural Lesions
Meningioma arises from the dura covering the intracranial surface of the skull base or from the dural sleeves following some of the cranial nerves (Fig. 16.12). Although signal characteristics vary, meningiomas are usually approximately isointense with brain on both T1-weighted and T2-weighted images. On T2-weighted images, about 10% are low signal, 50% are intermediate, and 40% are hyperintense relative to brain (12).
After gadolinium administration, meningiomas enhance, often intensely. The enhancement may taper or appear to extend along the dura beyond the edge of the main tumor mass (see Fig. 16.12). Tumor cells spreading along the dural sheet may be responsible for local recurrence. The meningioma tends to narrow the carotid artery and can cause enhancement following the carotid artery into the petrous carotid canal.
Bone changes are characteristic in meningioma. Although more readily apparent on CT, hyperostosis can often be appreciated on MR as a thickening of the cortical surface of the skull (see Fig. 16.12). Pneumosinus dilatans is expansion of a sinus lined by normal mucosa (Fig. 16.13). This phenomenon has been associated with optic nerve meningiomas and with adjacent intracranial meningiomas (13,14,15). “Blistering” of the planum sphenoidale is a combination of bone reactions appreciated on a lateral skull film or scout image. This may represent a combination of dilation of the sinus and sclerosis of the bony wall.
Calcification may be present in meningiomas and, if large enough, may be detectable as absence of signal. Small calcifications are often undetectable on MRI. Even a small amount of soft tissue within the same voxel as the small calcification will negate the signal void effect. Extracranial extension is seen most often when meningiomas involve the greater wing of the sphenoid or the floor of the anterior cranial fossa.
Other lesions that involve the meninges that can give meningeal thickening mimicking meningioma include sarcoid, lymphoma, and various infections including tuberculosis and fungus. Smooth enhancement and subtle thickening of the dura can follow lumbar puncture or can be seen with CSF hypotension.
Bone Lesions
Bone lesions can be benign or malignant, and include sarcomas (Fig. 16.14), benign fibro-osseous lesions, fibrous dysplasia, and various miscellaneous bony dysplasias (Figs. 16.15–16.17) (16). Chondrosarcoma is more frequent than osteosarcoma particularly in the region of synchondroses. Depending on the degree of calcification, bone tumors may be either relatively dark or have enough signal to be easily confused with various soft tissue neoplasms on MRI.
Fibrous dysplasia is an abnormality of fibroblast formation and development. The involved segment of bone is enlarged and shows abnormal mineralization. The lesion may be seen incidentally with imaging done for an unrelated problem. MRI gives a variable appearance. The internal fibrous matrix may enhance significantly and on MRI can mimic a tumor particularly when localized (see Figs. 16.15 and 16.16). The finding that the lesion tends to follow the original contour of the bone can give a hint at the diagnosis. CT often makes the diagnosis more obvious. The cortex is intact, and the “ground glass” appearance is very typical. On either MRI or CT, the abnormal bone may extend around a relatively intact neural foramen. The foramen may be displaced or narrowed but is usually identifiable.
MRI of fibrous dysplasia may show a fairly homogeneous appearance. However, areas of fibrous tissue or cyst formation can result in a less homogeneous pattern. Small cartilage rests can also be present within fibrous dysplasia. This does not imply degeneration into chondrosarcoma. Rapid enlargement, however, is not typical of fibrous dysplasia and is suggestive of a secondary sarcoma. The secondary malignancy is usually osteogenic sarcoma, but chondrosarcoma and fibrosarcoma can also occur (16,17). Further confusing the issue, fibrous dysplasia can obstruct an air cell. An obstructed air cell must be distinguished from a cystic area within the dysplastic bone.
Metastases can occur anywhere. Bones with a medullary region are more often affected. These areas include the
body and greater wing of the sphenoid and the petrous apex (Fig. 16.17). Lesions in the greater wing of the sphenoid are usually meningiomas or metastases. Plasmacytoma can also occur in these areas.
body and greater wing of the sphenoid and the petrous apex (Fig. 16.17). Lesions in the greater wing of the sphenoid are usually meningiomas or metastases. Plasmacytoma can also occur in these areas.
 FIGURE 16.13 Meningioma with pneumosinus dilatans of the sphenoid sinus. A: Axial T1-weighted MR image. B: Axial T1-weighted, fat-suppressed, postcontrast-enhanced MRI. C: Coronal T1-weighted, fat-suppressed, postcontrast-enhanced MRI. D: Coronal T1-weighted, fat-suppressed, postcontrast-enhanced MRI. Dilated sphenoid sinus impinges upward into the subfrontal region slightly to the left of midline (A). Note enhancing tissue (B,C) around the optic chiasm and optic nerves, tuberculum sella, along left sphenoid wing, and along the anterior clinoid processes, particularly the left (C). More anteriorly, meninges enhance (C,D), and a small subfrontal midline meningioma is also seen (B,D). The pneumosinus dilatans differentiates this meningioma from other extra-axial enhancing lesions, such as sarcoidosis or lymphoma. |
 FIGURE 16.14 Osteogenic sarcoma. A: Coronal T1-weighted MR image shows a heterogeneous mass involving the roof of the right orbit (small arrows). Note that the low signal of the cortical bone is interrupted by this process (large arrow). B: Coronal T2-weighted image shows the mass to have areas of low and intermediate signal intensity. C: Coronal computed tomography shows that the mass consists largely of an ossified matrix. This is very characteristic of osteogenic sarcoma. The bony nature of the mass was difficult to discern with MRI alone. |
Other, less common lesions associated with bone that have been identified in the skull base include giant cell granuloma, giant cell tumors, aneurysmal bone cysts, and Langerhans histiocytosis.
Giant cell lesions are expansile and described as having areas of low signal on T2-weighted sequences (18,19,20). There is variable enhancement. Langerhans cell histiocytosis usually presents in young patients as a punched-out lesion with a sharp nonsclerotic margin (Fig. 16.18). High signal on T2 is described as characteristic but can be variable (21).
Paget disease is an abnormality of unknown etiology. Osteoblast activity is abnormal. Osteoblasts overreact, giving an increase in size of trabeculae and coarse, thick bone. The bone is softer than usual, and basilar invagination occurs with the dens and at C1, appearing to push upward into the softened bone. Secondary sarcoma can occur and gives an enlarging mass (22,23,24).
Sinus Pathology
The findings of sinusitis tend to be nonspecific. Opacification and mucosal thickening are frequently seen with no symptoms. Retention cysts are seen incidentally with low signal on T1 and high signal on T2 beneath an enhancing mucosa. The lack of enhancement in the contents with the enhancing surface margin facing the lumen of the sinus is characteristic of the retention cyst. Air–fluid levels are considered more suggestive of acute infection.
MRI may be ordered when there is consideration of extension beyond the lumen of the sinus. An ethmoid infection may extend into the orbit via the lamina papyracea. The periorbita may initially enhance and then be elevated as a periorbital
abscess accumulates. The abscess is seen as low signal intensity with an enhancing margin. Further extension leads to an orbital abscess as the orbital fat is involved. Orbital cellulitis gives reticulation or fine, streaky density within the orbital fat. Usually CT is done for this assessment because subtle changes in the orbital fat are very easily appreciated.
abscess accumulates. The abscess is seen as low signal intensity with an enhancing margin. Further extension leads to an orbital abscess as the orbital fat is involved. Orbital cellulitis gives reticulation or fine, streaky density within the orbital fat. Usually CT is done for this assessment because subtle changes in the orbital fat are very easily appreciated.
 FIGURE 16.15 Fibrous dysplasia. A: Coronal T1-weighted MR image shows enlargement of the greater and lesser wings of the sphenoid (black arrows) and of the right calvaria. The enlarged bone has variable signal characteristics, with some areas of very low signal (white arrow). B: Contrasted exam at the same level shows marked enhancement in most of the involved bone (arrows). C: Axial T2-weighted MRI. There is great variability in the signal characteristic of the dysplastic bone, with some areas of very high signal and other areas of intermediate or near absent signal. |
 FIGURE 16.16 Fibrous dysplasia. A: Postcontrast T1-weighted image. There is enlargement of the affected part of the sphenoid bone. The tissue enhances, mimicking tumor. However, the lesion follows the outline of the original bone (white arrows). The Vidian canal is surrounded but maintains is outline. B: Coronal computed tomography image shows the obvious ground glass appearance. A thin layer of cortex is maintained. Foramen rotundum and the Vidian canal are identified. |
Intracranial extension is best assessed on MRI. Dural enhancement is considered the most sensitive detector of early involvement. An epidural abscess on a postgadolinium, T1-weighted sequence is seen as a low signal collection with an enhancing margin representing the inflamed dura. Further extension can lead to brain abscess.
Invasive fungal infection such as Aspergillus or Mucor gives an appearance more typical of tumor. The fungus frequently starts in a sinus and can be quite aggressive (Fig. 16.19). For instance, fungus starting in the sphenoid sinus can grow through the bony wall into the cavernous sinus, presenting with cranial nerve palsies. The fungus can be angioinvasive, causing narrowing of the carotid artery. Extension into the more distal branches can lead to cerebral infarction. Invasive fungi can be seen in patients with or without immunosuppression or chronic disease. Intermediate signal intensity is characteristic, and the involved tissues can enhance. Thus the lesion mimics tumor.
Fungal colonization of an obstructed sinus must be differentiated from invasive fungus. Aspergillus can grow in an obstructed sinus, accumulating metal ions and giving a characteristic appearance. The lesion is dense at CT without contrast and can be dark on MRI on both T1- and T2-weighted sequences (see Fig. 16.9). Usually there is some signal detectable. The most important finding is that the mucosa remains intact along the wall of the sinus and enhances after gadolinium. This abnormality is not
treated with potentially dangerous antifungal agents. Drainage and evacuation of the affected sinus is considered curative.
treated with potentially dangerous antifungal agents. Drainage and evacuation of the affected sinus is considered curative.
 FIGURE 16.17 Metastasis to the sphenoid triangle. A: Bone algorithm axial computed tomography demonstrates a lytic lesion in the right sphenoid triangle with a small focus of cortical erosion. B: Axial postgadolinium T1-weighted image demonstrates that the lesion is homogeneously enhancing and mildly expansile. The primary malignancy (sinonasal undifferentiated carcinoma) can be seen in the right posterior ethmoid. |
 FIGURE 16.18 Langerhans cell histiocytosis presenting with optic neuropathy. A: Axial T1-weighted image through the optic canal. There is abnormal tissue (arrowheads) surrounding the optic nerve canal without narrowing. B: Axial T1-weighted image postcontrast. There is intermediate enhancement. C: Coronal short inversion time inversion recovery image. There is intermediate signal (arrowheads) surrounding the optic nerve (arrow). D: Axial computed tomography bone algorithm. There is a relatively sharp margin (arrows). Note the “ghost” of the optic nerve canal. |
 FIGURE 16.19 Invasive Aspergillus fungus. Axial T1-weighted image. The lesion began in the sphenoid sinus and invaded laterally into the orbit and cavernous sinus (arrow). Note the narrowing of the carotid artery. Note that the lesion is intermediate in signal. Compare with the signal void of fungal colonization seen in Figure 16.9. |
Mucoceles are expanded air cells. With obstruction of the ostium of a sinus, there is accumulation of secretions, leading to opacification. With continued obstruction there can be expansion, leading to mucocele formation. There is ambiguity in the nomenclature. In radiology, a mucocele is usually defined as an opacified sinus with expansion of the bony wall. The secretions are within the natural although enlarged lumen of the sinus.
On MRI, the signal pattern is variable, again reflecting the variation of protein concentration and therefore probably the age of the lesion (9). A relatively “young” mucocele may be dark on T1-weighted image and bright on T2. Slightly higher protein makes the lesion bright on both sequences. More chronic mucoceles may be dark on both sequences as the contained material becomes more desiccated (see previous section on sinus obstructive patterns). Aspergillus colonization is frequent in mucoceles, further altering the signal. On MRI, the key finding of a mucocele is the enhancing margin representing enhancing mucosa along the wall of the abnormality (11). Thus the secretions are localized within the lumen of the sinus. The lumen may actually appear to decrease in “brightness” after gadolinium because of change in the dynamic range of the entire image. The signal patterns are the same as in simple
obstructed sinuses (see Figs. 16.7–16.9), but there is expansion of the bone (Fig. 16.20).
obstructed sinuses (see Figs. 16.7–16.9), but there is expansion of the bone (Fig. 16.20).
 FIGURE 16.20 Mucocele. A: Coronal T1 MR image. The sphenoid sinus is enlarged and its contents are of high signal. Mucocele also involves the left anterior clinoid (arrow), which is markedly expanded and filled with the same high-signal contents as the rest of the sinus. B: Sagittal T1 MR image again shows marked enlargement of the left anterior clinoid (large arrow). |
Mucocele can occur in any sinus. Expansion of the air cell in the petrous apex is referred to as a cholesterol cyst or granuloma (25). In the temporal bone, the appearance reflects more hemorrhage than mucous accumulation probably because there are fewer mucous glands in the lining of the air spaces in the temporal bone. These lesions tend to bright on both T1- and T2-weighted sequences. Foci of low signal within expansion signify hemosiderin (Fig. 16.21).
Tumors associated with the sinuses and nasal cavity can involve the anterior and the central skull base. Primary tumors include squamous cell carcinoma, adenocarcinoma, and a variety of rare lesions such as melanoma and lymphoma. Squamous
cell carcinoma is the most common malignant lesion of the sinonasal region.
cell carcinoma is the most common malignant lesion of the sinonasal region.
 FIGURE 16.21 Cholesterol cyst of the petrous apex. A: Axial T1-weighted image demonstrates a high-signal lesion expanding the right petrous apex (arrow) with a focus of low signal posteriorly (arrowhead). B: Axial T2-weighted image demonstrates that the lesion is largely high signal but has a corresponding area of lower signal (arrowhead). The high signal on both T1-weighted and T2-weighted images is characteristic of cholesterol cysts and is seldom seen in other pathologies of the petrous bone. It may be due to the products of hemorrhage within this chronically obstructed petrous apex. The signal void may represent hemosiderin. C: Axial computed tomography demonstrates expansion of the bone at the right petrous apex. |
 FIGURE 16.22 Melanoma of the nasopharynx. A: Unenhanced axial T1 MR image at the level of the torus tubarius. There is a high-signal lesion in the nasopharynx (arrow). Incidentally, there is mucosal thickening in the right maxillary sinus. B: T2-weighted MRI at the same level. The lesion (arrow) has low signal. This signal pattern is characteristic of melanoma. Hemorrhagic lesions can also have this appearance. C: Gadolinium-enhanced, short T1-weighted MRI. The lesion has approximately the same signal as the enhancing mucosa (thin arrow) passing into the fossa of Rosenmüller. |
Adenocarcinoma is more common in the upper nasal cavity than it is in the lower. Rhabdomyosarcoma, usually seen in children, can extend through the skull base, usually from the orbit (26).
We cannot make a definite differentiation among these tumor types using signal characteristics alone. In some melanomas, the diagnosis can be suggested by bright signal on the T1-weighted image and low signal on the T2-weighted image (Fig. 16.22) (27). The main role of imaging is to establish the location of the tumor, particularly relative to the orbit and intracranial structures.
Anterior Skull Base
As previously, tumors involving the anterior skull base arise from the meninges, the olfactory nerves and mucosa, the upper nasal cavity and paranasal sinuses, the orbit, or the bone itself. Thus, the tumors that occur in this region are numerous and include meningiomas, olfactory neuroblastomas (esthesioneuroblastomas), and various sinus, orbit, and bone tumors.
Special note should be made of olfactory neuroblastomas (esthesioneuroblastomas) (Figs. 16.23–16.25). These lesions arise either just above or just below the cribriform plate from the olfactory nerves or the olfactory mucosa. Even if the lesion cannot be radiographically demonstrated above the cribriform plate, involvement of both sides of the plate is presumed, and surgical approaches include removal of this area. The completeness of initial tumor resection appears to correlate with long-term survival (28,29). Surgery is usually combined with radiotherapy.
The MRI appearance may be similar to that of other neoplasms of the upper nasal cavity. These lesions may be bright on T2-weighted images, but this can be variable (Fig. 16.23); hyperostosis may occur but is rare (Fig. 16.24). Calcification can be diffuse. Again, the position of the lesion in the upper
nasal cavity adjacent to the cribriform plate suggests this possibility, but olfactory neuroblastoma can occur in contiguous sinuses as well. Cyst formation in the margin of a tumor traversing the anterior skull base is particularly suggestive of the diagnosis (Fig. 16.25) (30).
nasal cavity adjacent to the cribriform plate suggests this possibility, but olfactory neuroblastoma can occur in contiguous sinuses as well. Cyst formation in the margin of a tumor traversing the anterior skull base is particularly suggestive of the diagnosis (Fig. 16.25) (30).
 FIGURE 16.23 Esthesioneuroblastoma with intracranial extension. A: Coronal T1-weighted image after contrast. The tumor (T) fills the upper nasal cavity and involves the nasal septum. Enhancement is present intracranially (arrowhead) along the gyrus rectus and along the olfactory bulb. The tumor bulges the lamina papyracea, but does not invade the fat (arrowhead) between the bone and the medial rectus muscle. Arrow, the location of the cribriform plate. B: Axial T1-weighted image after contrast. The upper part of the tumor (T) fills the upper ethmoid sinus. Enhancement (arrows) along the crista galli and the dura indicates intracranial spread. C: T2-weighted image axial plane shows intermediate signal in the tumor (T). |
 FIGURE 16.24 Esthesioneuroblastoma. Tumor (T) of the nasoethmoid region with intracranial extension. A: Coronal T1-weighted image. Note the hyperostosis (arrow) and compare with panel B. Some of the “hyperostosis” may be an inflammatory reaction related to obstructed neighboring air cells. Note the high signal of the secretions in the maxillary antrum. B: Coronal computed tomography scan shows the hyperostosis (arrow) more clearly differentiated from the soft tissue component (arrowhead) of the intracranial extension. |
 FIGURE 16.25 Esthesioneuroblastoma. Postgadolinium T1-weighted image shows the tumor (T) as intermediate signal. Note the cyst at the margin of the tumor (arrow). |
Meningiomas and bone tumors have been discussed in the previous section. Metastases to this area are rare.
Nasal polyps have been reported to protrude through the floor of the anterior cranial fossa (31), but these “extensions” may be secondary mucocele formation.
Imaging evaluation of lesions of the anterior skull base focuses on definition of the extent rather than absolute determination of the cell type. Does the tumor arising in the nasal cavity or sinuses extend through the skull base into the anterior cranial fossa (Fig. 16.26; also see Fig. 16.23)? Does the tumor involve the brain? Because of the shape of the floor and anterior wall of the anterior fossa, multiple sequences in multiple planes are required. Oblique planes may be chosen to demonstrate optimally the tumor margin.
The roof of the orbit and the cribriform plate is well evaluated by coronal imaging. More anteriorly, the transition from the floor to the anterior wall of the anterior cranial fossa represents a smooth curve. Along this curve, neither axial nor coronal images represent a perpendicular slice, and, therefore, the cortical line may not be obvious. Sagittal images may be helpful in this region (Fig. 16.27).
Does the lesion extend into the orbit? Often the tumor may extend through the bony lamina papyracea and elevate the periorbita without extending through this fibrous layer into the orbital fat (see Figs. 16.23 and 16.26). The fat plane medial to the medial rectus muscle is an important landmark. If the fat is intact and the bulge of the tumor into the orbital fat has a smooth margin, the lesion is likely limited by the periorbita.
Central Skull Base
The central skull base consists of the sphenoid bone and contiguous tissues. Meningioma is one of the most likely possibilities when a lesion involves almost any part of the sphenoid bone. However, other possibilities in the differential diagnosis depend on the part of the sphenoid bone involved. Note that the sella and parasellar region are covered more completely in a separate chapter.
Chordomas arise from remnants of the notochord and, therefore, arise along the course of this embryonic structure. In the skull base, chordoma arises almost exclusively in the clivus region (basiocciput, basisphenoid). Chordomas completely within the nasopharynx have been reported on rare occasions. The appearance of chordomas can be somewhat variable; some are fairly homogeneous in signal (Fig. 16.28), but there are often cystlike components that have high signal on T1-weighted images (32). The high signal can represent small hemorrhagic foci or collections of proteinaceous fluid. Signal voids within the lesion may represent sequestrations of cortical bone rather than new bone formation (Fig. 16.29) (33). On CT, these bits of residual bone are obvious, and there can be areas of nonenhancing tissue as well.
 FIGURE 16.26 Undifferentiated malignancy (rhabdomyosarcoma). A: Coronal T1 MR image shows the tumor extending into the orbit. The periorbita is deviated (arrow) but limits the tumor extension into the orbital fat. There is still a small amount of fat (arrowhead) between the lesion and the medial rectus muscle. At this level there is no evidence of intracranial extension. B: Gadolinium-enhanced T1-weighted scan at the same level. The tumor enhances slightly. The mucosa enhances more than the tumor. Thus the tumor margin (arrows) can be separated from normal inferior turbinate below and the obstructed supraorbital air cell above. Note that the hard palate (arrowhead) is not invaded. C: Slightly more posterior cut. There is invasion of the roof of the orbit (large arrow). The brain immediately above is slightly displaced. Compare with the intact supraorbital roof on the opposite side (small arrow). D: Axial T1-weighted unenhanced MRI. The tumor is seen extending anteriorly (arrow) toward the skin. In this region it is difficult to differentiate tumor from an obstructed nasolacrimal duct and lacrimal sac. The fact that the tissue here has exactly the same signal as the tumor suggested tumor involvement. E: Enhanced axial T1-weighted MRI. The abnormality in the region of the lacrimal sac behaves the same as does the tumor. F: Axial T2-weighted MRI. Tumor (large arrow) again has the same signal as the abnormality in the lacrimal sac region. Increased signal (curved arrow) in the region of the mastoid indicates obstruction of the eustachian tube. |
 FIGURE 16.27 Lymphoma of the frontoethmoid region. Sagittal image shows that the brain is displaced by the tumor. The sagittal plane shows the curve from the frontal bone to the floor of anterior fossa. |
Chondrosarcomas may have an appearance very similar to chordoma. The typical location, however, is lateral to the sphenoid in the petro-occipital (petroclival or petrobasal) synchondrosis. More rarely, chondroid lesions can occur in the midline associated with the spheno-occipital synchondrosis (Fig. 16.30) or in the posterior nasal septum where sutures separate the vomer, ethmoid, and sphenoid (34). These tumors may contain true tumoral calcification (33), but this may not be obvious on the MRI. Indeed, calcified chondroid matrix is not always present in skull base chondroid lesions. Curvilinear calcifications indicative of chondroid matrix is appreciated only on CT. Chondromatous lesions usually have a bright signal on T2-weighted images.
There has been controversy regarding the precise histologic separation of some chordomas and chondrosarcomas. This can be attributed to variations in the histologic patterns found in each of the tumors.
The chordoma has a characteristic cell called a physaliphorous cell. This cell has large vacuoles and is found in a myxoid matrix. In 1973, Heffelfinger et al. (35) described a lesion that had areas histologically typical of the classic chordoma but also
had areas with a chondroid appearance in some regions. These latter regions had an apparently hyaline matrix surrounding isolated chondroid-appearing cells. This part of the tumor suggested the hyaline type of chondrosarcoma. The term chondroid chordoma was applied to this lesion.
had areas with a chondroid appearance in some regions. These latter regions had an apparently hyaline matrix surrounding isolated chondroid-appearing cells. This part of the tumor suggested the hyaline type of chondrosarcoma. The term chondroid chordoma was applied to this lesion.
 FIGURE 16.28 Chordoma. A: Sagittal T1 shows a large mass involving the clivus. Only a small amount of normal clival marrow persists (white arrow). The intracranial surface of the clivus (arrowheads) has been violated, and there is tumor protruding into the cerebrospinal fluid cistern. The tumor also displaces the nasopharyngeal mucosa (black arrow). B: T2-weighted axial MR image. The tumor is primarily high signal. |
 FIGURE 16.29 Chordoma. A: Axial postgadolinium T1-weighted image demonstrates a large irregular mass replacing the marrow of the clivus and protruding into the nasopharynx and ethmoid, as well as the prepontine cistern. Certain components are avidly enhancing while others have intermediate signal or signal voids. B: Axial T2-weighted MRI demonstrates mixed intermediate and high signal within the mass. |
 FIGURE 16.30 Chondrosarcoma arising in the spheno-occipital synchondrosis. A: Axial T1-weighted image shows the tumor (T) extending from the skull base posteriorly into the prepontine cistern. B: Sagittal T1-weighted image shows the lesion (arrows) extending into the cistern and into the sphenoid sinus. C: T2-weighted image shows multiple areas of low signal representing the organic cartilaginous matrix. Without matrix most cartilaginous lesions have high signal on T2-weighted sequences. D: Axial T1-weighted image after contrast sows enhancement of the lesion with small areas of signal void representing small cartilaginous foci. |
Chondrosarcomas of the skull base are classified as hyaline, myxoid, or mixed hyaline/myxoid. Pure hyaline chondrosarcomas represent less than 10% of the skull base chondrosarcomas (36). The myxoid type of chondrosarcoma can have an appearance similar to that of the classic chordoma. About 30% of skull base chondrosarcomas are myxoid and about 50% are a mixture of hyaline and myxoid variants (36). Thus, most chondrosarcomas have a myxoid histology in at least part of the tumor.
There is, therefore, an overlap in the microscopic appearance of the myxoid elements of chondrosarcomas with that of the classic chordoma, and there is also an overlap of histologic appearance of the so-called chondroid portion of some chordomas with the hyaline variant of chondrosarcoma.
Recent application of immunohistochemical staining combined with microscopic examination has helped to clarify this issue (36,37). The true chondroid lesion (hyaline, myxoid, or mixed) is of mesodermal origin and the cells do not stain significantly for either epithelial membrane antigen (EMA) or cytokeratin. This pattern holds for all chondroid lesions, including the myxoid variant most likely confused with the chordoma. The cells of the chordoma (including the “chondroid chordoma”), on the other hand, are cytokeratin and EMA positive, reflecting the ectodermal origin of the notochord. Based on this process, many but not all lesions originally diagnosed as the so-called chondroid chordomas have been reclassified as true chondrosarcomas (36). A true chondroid chordoma remains an entity, but the term “chondroid” refers only to a histologic appearance rather than a true cartilage origin of the cells or the matrix. The cells may resemble chondrocytes in a hyaline matrix, but immunohistochemistry indicates that they are not truly of cartilaginous origin. In addition, the chondroid chordoma consistently has regions of more typical classic chordoma appearance. The differentiation is important because patients with true chondrosarcomas including the reclassified lesions have a better prognosis than patients with chordomas. The remaining “chondroid” chordomas have the same poor prognosis as other more typical chordomas.
For the purposes of imaging diagnosis, the lesion appearing to arise in the petro-occipital (petroclival) synchondrosis is typically cartilaginous (Fig. 16.31) and that arising in the midline is far more commonly chordoma than chondrosarcoma.
The cavernous sinus and Meckel’s cave region is the site of tumors arising from the cranial nerves that traverse this area. The trigeminal ganglion is located in the region of the inferolateral wall of Meckel’s cave. The divisions of the trigeminal communicate via numerous foramina with the regions immediately beneath the skull base. These extracranial regions include the pterygopalatine fossa and the masticator space (38). Nerve sheath tumors may exhibit transforaminal spread (39). These tumors may be homogeneous or inhomogeneous. They are low or intermediate on T1-weighted images and may be bright on a T2-weighted image (Fig. 16.32). They tend to be fairly smoothly marginated and enhance intensely after gadolinium (40). Bone expansion is appreciated on CT. The cortex is often intact even though the foramen is expanded.
The carotid artery passes through the cavernous sinus, and so aneurysms, although not neoplasms, must be included in the differential diagnosis for mass lesions found in the parasellar area (Fig. 16.33). Note that a more complete discussion of the parasellar and cavernous sinus regions is detailed in a separate chapter.
Secondary Lesions of Central Skull Base
Direct Extension
Lesions of the nasopharynx erode into the central skull base (41). The malignancy erodes directly into the bone involving the nasopharyngeal surface of the sphenoid (see Fig. 16.2). Fissures and foramina represent potential lines of least resistance and so may be the site of initial tumor spread (see Fig. 16.6). For instance, nasopharyngeal carcinoma frequently arises in the lateral nasopharynx and thus is immediately adjacent to the synchondroses separating the petrous temporal bone from the basiocciput and sphenoid bone. Tumor can extend through the region of the petro-occipital (petroclival or petrobasal) synchondrosis and foramen lacerum into the posterior fossa and into inferior aspect of the cavernous sinuses. More aggressive malignancy can result in destructive patterns with erosion of large segments of bone.
Nasopharyngeal carcinoma and adenoid cystic carcinoma arise from the mucosal regions. Various sarcomas arise in the contiguous soft tissues as well. Lymphoma and a variety of rare tumors must also be considered. Diagnosis is made by direct biopsy. Any part of the skull can be eroded.
 FIGURE 16.31 Chondrosarcoma arising in the petroclival (petrobasal or petro-occipital) synchondrosis. A: Axial T2-weighted images demonstrates high-signal expansile lesion arising in the right petroclival synchondrosis. B: Postcontrast axial T1-weighted image demonstrates corresponding avid enhancement. |
 FIGURE 16.32 Nerve sheath tumor. A: Coronal T1-weighted image shows a smoothly marginated mass of the superior masticator space obliterating the trigeminal fat pad and mildly remodeling the floor of the middle cranial fossa. It is similar in intensity to brain and extends to the level of foramen ovale (arrow). B: Axial T1-weighted magnetic resonance imaging. The mass disrupts the normal fat planes (trigeminal fat pad) of the superior masticator space (compare with normal left side). C: Axial T2-weighted image with fat saturation at the same level as in panel B. |
 FIGURE 16.33 Cavernous carotid aneurysm. Coronal T1-weighted MR image. There is a large mass enlarging the right cavernous sinus and remodeling the middle cranial fossa floor. The residual lumen within the aneurysm is a signal void (large arrow). The variable signal of the thrombus and evidence of hemorrhage in the wall help to distinguish aneurysms from other parasellar masses. |
Juvenile angiofibroma can also extend into the central skull base and anterior part of the cavernous sinus. The diagnosis of this tumor, occurring in the male adolescent, is seldom in question. Its appearance on MRI is characteristic. The lesion almost always obliterates the fat in the pterygopalatine fossa (Fig. 16.34). Signal voids representing large vascular structures are seen throughout the tumor (42). The lesion can extend through the root of the pterygoid (junction of the pterygoid process with the body of the sphenoid). The lesion involves the bone in the region of the foramen rotundum and the Vidian canal and can extend into the anterior portion of the cavernous sinus.
Perineural Spread
The highly significant term “perineural spread” is applied when a tumor selectively follows a nerve, appearing to use the nerve as a conduit (43). The tumor most commonly implicated in perineural extension is adenoid cystic carcinoma. This phenomenon has been described in squamous cell carcinoma, melanoma, and lymphomas as well (44).
The trigeminal nerve is the most commonly involved nerve in the central skull base. The three divisions of the trigeminal converge toward the cavernous sinus and Meckel’s cave. As the tumor impinges on the Meckel’s cave, the signal of the CSF usually found there is replaced or compressed (45). Tumor following the trigeminal branches first reaches the inferolateral wall of the cave in the region of the semilunar ganglion. The usual V-shaped enhancement of the venous plexus around the ganglion appears to enlarge as tumor invades (46,47).
Demonstration of the interface of a tumor with the cavernous sinus proper is more difficult. The cavernous sinus may have the similar signal characteristics as the tumor. By comparing the multiple sequences, however, one can usually define the edge of the tumor. Frequently, gadolinium enhancement is helpful because a tumor enhances slightly less than the normal slow-flowing blood in the cavernous sinus, thus allowing definition of the tumor edge.
A change in the shape of the cavernous sinus is a strong indication of tumor involvement. Increased bowing of the lateral wall is seen best on the coronal image but can be appreciated on the axial image as well (see Fig. 16.35). Tumor contiguous to Meckel’s cave can compress the normal oval or triangular CSF space even if it does not extend into the cave itself (48).
Complete evaluation of the cavernous sinus requires careful inspection of the pathways by which tumor can reach the cavernous sinus/Meckel’s cave region. The so-called perineural spread may extend from tumors arising in the paranasal sinuses, face, orbit, palate, oral cavity, or any regions that receive branches of the trigeminal nerve. Each of the branches traverses at least a small amount of fat immediately after exiting the skull base. As tumor replaces this fat, the characteristic high signal on the T1-weighted image is obliterated. If the fat is normal just outside a particular neural foramen, then it is highly unlikely that tumor has reached or, more important, traversed the foramen.
Perhaps the most important of these small, fat-containing structures is the pterygopalatine fossa (see Fig. 16.35). Tumors can travel along the second branch of the trigeminal nerve through the pterygopalatine fossa to reach the foramen rotundum and thus the cavernous sinus and Meckel’s cave (44,49). Assessment of this area is an important part of the evaluation of
any tumor of the face, paranasal sinuses, or palate. It is particularly important in tumors of the roof of the mouth. The mucosa covering the posterior hard palate is very rich in minor salivary glands. Adenoid cystic carcinoma with its propensity for perineural spread is very common in this location.
any tumor of the face, paranasal sinuses, or palate. It is particularly important in tumors of the roof of the mouth. The mucosa covering the posterior hard palate is very rich in minor salivary glands. Adenoid cystic carcinoma with its propensity for perineural spread is very common in this location.
 FIGURE 16.34 Juvenile angiofibroma. A: Axial T1-weighted image demonstrates a mass expanding the left pterygopalatine fossa. The normal fat located here is replaced by the mass (compare with the normal right pterygopalatine fossa [arrow]). B: Postcontrast axial T1-weighted image at the same level shows tumor in the left pterygopalatine fossa and left nasal cavity. |
 FIGURE 16.35 Perineural spread of tumor along trigeminal. A: Axial T1-weighted image precontrast demonstrates obliteration of the fat of the right pterygopalatine fossa (arrowhead) in this patient with adenoid cystic carcinoma. The fat in the normal left pterygopalatine fossa (arrow) is seen as high signal. B: Axial T1-weighted image after gadolinium. The tissue in the pterygopalatine fossa enhances brightly (arrowhead). The fat on the normal side, however, remains slightly brighter than the tumor (arrow). C: There is subtle increased bowing of the lateral wall of the right cavernous sinus (arrowhead) indicating tumor involvement. D: Coronal postcontrast T1-weighted image. The increased bowing of the lateral wall of the right cavernous sinus is better appreciated in the coronal plane (arrowhead). Arrow, oculomotor nerve (CN III); C, carotid artery. E: Coronal postcontrast T1-weighted image slightly more anteriorly. The abnormal nerve in the foramen rotundum (arrowhead) is slightly larger than the normal nerve (arrow) on the opposite side. Note the slight enhancement of the venous plexus around the normal nerve. There is also enhancement within the superior orbital fissure, indicating tumor involvement (open arrow). |
Fat in the superior orbital fissure protrudes into the anterior aspect of the cavernous sinus. A tumor growing along the nerves that pass through the fissure obliterates this fat and is therefore detectable. Lesions can extend from the skin of the upper face or from the lacrimal gland.
There is also a small amount of fat just below the foramen ovale surrounding the third division of the trigeminal. This fat pad is located just along the medial margin of the lateral pterygoid muscle and has been referred to as the trigeminal fat pad.
Tumors can follow the lingual or mandibular nerve to this fat pad (Fig. 16.36). The auriculotemporal nerve can carry tumor from the parotid gland to this fat pad on the way to the foramen ovale (50).
Tumors can follow the lingual or mandibular nerve to this fat pad (Fig. 16.36). The auriculotemporal nerve can carry tumor from the parotid gland to this fat pad on the way to the foramen ovale (50).
 FIGURE 16.36 Neurofibroma following V3. A: Axial T1-weighted image. The tumor enlarges the nerve (arrowhead) along the medial margin of the lateral pterygoid muscle. Compare with the nerve (arrow) in the fat on the opposite side. The tumor could be followed on lower images (not shown) around the posterior mandible to a mass (T) in the parotid gland. LP, lateral pterygoid muscle on the normal side. B: Coronal T1-weighted image. The tumor (T) is visualized in the region of the parotid gland and cheek. The enlarged trigeminal nerve (arrows) obliterates the trigeminal fat pad and follows through the foramen ovale to the trigeminal ganglion in Meckel’s cave (white arrowhead). LP, lateral pterygoid muscle on the normal side; MP, medial pterygoid muscle; black arrowheads, trigeminal fat pad on the normal side. |
Tumor actually in a foramen or canal can be detected in several ways. The tumor usually enlarges the foramen or canal. Even in perineural spread of malignancy, growth of tumor may be slow, and the cortex of the canal is often intact. Asymmetric enhancement of the tissue within the foramen is very suspicious for tumor even if the foramen is not enlarged (see Fig. 16.35). Of course, tumor visualized at the endocranial opening of the foramen presumes that the foramen is involved.
Other important neural pathways to the skull base, but not passing to the cavernous sinus, include the facial nerve, hypoglossal nerve, and the nerves transiting the jugular foramen. A small amount of fat accompanies these nerves as well. Fat surrounds the IX, X, XI, and XII just below the skull base. A small amount of fat fills the stylomastoid foramen (51). Obliteration of the fat in these regions is an important sign of tumor spread.
Tumor usually follows the nerve centrally but can grow in a retrograde fashion as well. For instance, a tumor of the palate can grow up the palatine nerves to the pterygopalatine fossa and then pass through rotundum. The tumor can also pass anteriorly from the pterygopalatine fossa along the infraorbital nerve toward the face. Similarly, a tumor reaching the semilunar ganglion via foramen rotundum can then grow outward along the third division of the trigeminal through foramen ovale.
Hematogenous Metastasis
Most of the greater wing of the sphenoid is lateral to foramen ovale. In our experience, tumors actually appearing to arise from the bone in this region are usually either meningiomas or metastatic lesions. Metastatic tumors can reach this area by direct extension from tumors arising below the skull base or by hematogenous spread from more remote sites (see Fig. 16.17). Often a subtle soft tissue component is seen at all surfaces of the bone. The dura enhances in the middle cranial fossa, and soft tissue tumor impinges on the fat planes of the temporalis space laterally. Extension into the orbit impinges on the fat lateral to the lateral rectus. The orbital component may cause the presenting sign of globe proptosis. Blastic metastases may have the same appearance as en plaque meningiomas.
Posterolateral Skull Base
The posterolateral region consists almost entirely of the temporal bone. As with the other regions of the skull base, the apparent site of origin is often the best clue to the identity of the lesion (Fig. 16.1).
The temporal bone is primarily an osseous structure covered by dura and containing air passageways. Lesions typical of bone can arise in the temporal bone as they do in any other osseous structure and metastases can reach the petrous apex and the mastoid. Similarly, meningiomas will arise from the covering dura. Such lesions have been discussed in other sections.
Petrous Apex Lesions
Osseous lesions and tumors that secondarily invade or erode the petrous apex are primarily discussed in other sections in this chapter or elsewhere in this book (meningioma, chondrosarcoma at the petroclival synchondrosis, trigeminal schwannoma, fibrous dysplasia, meningocele/cephalocele, and intradural epidermoid). Lesions that arise from within and expand the petrous bone include cholesterol granuloma (cholesterol cyst), cholesteatoma (epidermoid), mucocele, and petrous carotid artery aneurysm. Care must be taken to recognize nonsurgical benign “do not touch” entities such as asymmetric pneumatization/marrow and trapped petrous apex fluid.
MR is important in the characterization of lesions at the petrous apex as cystic or solid. The expansile cystic nonenhancing lesions are most commonly cholesterol granuloma (cholesterol cyst) and cholesteatoma/epidermoid or mucocele. Cholesterol granuloma can be treated with drainage and fistulization while epidermoids require removal of the wall of the lesion. Solid lesions with enhancing soft tissue typically require biopsy to determine the adequate therapy, and if resectable, require extensive surgery (52).
Asymmetric pneumatization of the petrous apices is common (up to one-third of the population) but can be misinterpreted as a pathologic process at MR (53). A pneumatized petrous apex will be hypointense on T1-weighted imaging while the T1 hyperintense signal in fatty marrow can be present in the contralateral nonpneumatized petrous bone. Fat saturation techniques and comparison of petrous apex signal with fat in the orbit can confirm the presence of fat in the
nonpneumatized petrous apex. If a comparison CT is available, the lack of expansion or bony destruction supports the diagnosis of a normal variant. Similarly, the presence of fluid signal (T2 hyperintensity) within pneumatized petrous apex air cells without erosive or expansile changes confirms the diagnosis of trapped fluid. The presence of associated T1 intermediate or hyperintense signal may be seen with proteinaceous fluid. Many institutions will use imaging follow-up to exclude a developing cholesterol granuloma.
nonpneumatized petrous apex. If a comparison CT is available, the lack of expansion or bony destruction supports the diagnosis of a normal variant. Similarly, the presence of fluid signal (T2 hyperintensity) within pneumatized petrous apex air cells without erosive or expansile changes confirms the diagnosis of trapped fluid. The presence of associated T1 intermediate or hyperintense signal may be seen with proteinaceous fluid. Many institutions will use imaging follow-up to exclude a developing cholesterol granuloma.
Related posts:
Stay updated, free articles. Join our Telegram channel

Full access? Get Clinical Tree


