Fig. 1.
MR images of mouse brain with Mel57-VEGF-A165 tumors, acquired prior to (a and c) and following administration of Gd-DTPA (b) and USPIO (d). Immunostainings for pericytes (e) and extravasated mouse immunoglobulins (f) of a lesion in a section matched with the MRI slice. The immunohistochemical stainings, which show highly dilated tumor vasculature and the high level of extravasated IgG, confirm the contrast-enhanced MRI findings. See also (14).
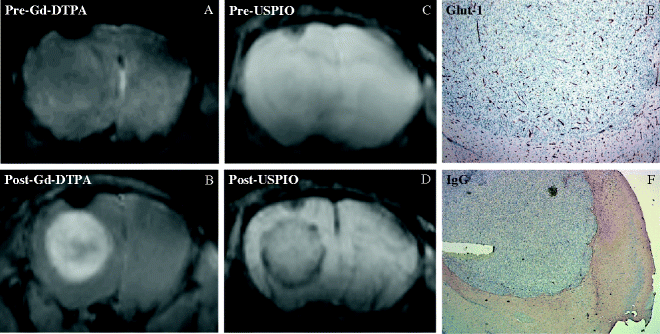
Fig. 2.
MR images of mouse brain with a U87 tumor, acquired prior to (a and c) and following administration of Gd-DTPA (b) and USPIO (d). Immunohistochemical staining for Glut-1 (e), highlighting vessels, and an immunostaining for extravasated mouse immunoglobulins (f) confirm the MRI results. See also (14).
3.3 Data Analysis
1.
Pixel-by-pixel ΔR 2* maps are obtained from the formula: ΔR 2 * = (1/TE)log(S o bef/S o aft), where TE is the echo time and S o the signal amplitude pre-USPIO (S o bef) and post-USPIO (S o aft), in the gradient-echo images (see Note 6). The same algorithm is used to generate ΔR 2 maps from the spin-echo images. The algorithm for calculating ΔR 2* (and ΔR 2) from the formula reported above is implemented as a script written in MATLAB (see Note 7).
2.
After generating ΔR 2* and ΔR 2 maps, ΔR 2* and ΔR 2 values are measured in manually segmented ROIs within the region of interest. The algorithm for generating ROIs is also implemented as a script written in MATLAB.
3.
For each ROI, mean ΔR 2* and ΔR 2 are calculated by averaging the values of all pixels within the ROI.
4.
The Mel57-VEGF-A165 metastases show very high values of ΔR 2* and ΔR 2 (ΔR 2* = 280 ± 90 s−1 and ΔR 2 = 40 ± 10 s−1, mean ± standard deviation, assessed in four mice and for each mouse five lesions with the highest ΔR 2* values are considered).
5.
The U87 tumors are characterized by relatively low ΔR 2* and ΔR 2 values in the core (ΔR 2* = 17 ± 6 s−1 and ΔR 2 = 5 ± 3 s−1, assessed in four mice) and moderately high ΔR 2* and ΔR 2 values in the peritumoral region (ΔR 2* = 54 ± 15 s−1 and ΔR 2 = 13 ± 5 s−1).
6.
It is also of interest, for reference, to measure the values of ΔR 2* and ΔR 2 in healthy brain regions (cortex: ΔR 2* = 21 ± 9 s−1, ΔR 2 = 5 ± 2 s−1; striatum: ΔR 2* = 36 ± 10 s−1, ΔR 2 = 9 ± 3 s−1). An example of the macrovascular blood volume map (i.e., ΔR 2* map) of Mel57-VEGF-A165 and U87 tumors is shown in Fig. 3a and c, respectively. As explained in point 1 of this section, the algorithm for calculating ΔR 2* (and ΔR 2) is implemented as a script written in MATLAB.
7.
In Mel57-VEGF-A165 tumors, a high threshold for ΔR 2* is used in the tumor areas (region inside the box, Fig. 3a; note the ΔR 2* scale up to 300 s−1). Outside the tumor region, a low cutoff threshold (ΔR 2* scale up to 100 s−1) is used to maximize the contrast between striatum (ROI indicated on the corresponding gradient-echo image by the horizontal arrow, Fig. 3b) and cortex (ROI indicated by the vertical arrow, Fig. 3b).
8.
In Fig. 3d, the gradient-echo image corresponding to the U87 tumor macrovascular blood volume map is shown.
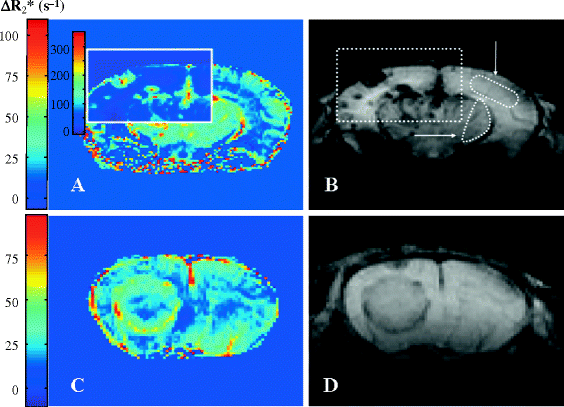
Fig. 3.
An example of a pixel-by-pixel ΔR 2* map of murine brain with Mel57-VEGF-A165 (a) and U87 tumors (c). The gradient-echo images post-USPIO are shown in (b) and (d), respectively. In order to highlight the differences in regional blood volume between brain regions that do not include tumor, the ΔR 2* map of Mel57-VEGF-A165 (a) is displayed with a high cutoff threshold in the tumor areas (region inside the box) and a low cutoff threshold outside tumor regions. For reference, ΔR 2* and ΔR 2 values are also calculated in healthy brain regions (striatum, indicated by the horizontal arrow and cortex, indicated by the vertical arrow).
4 Notes
1.


The T 2 relaxation time is the time constant that governs the loss of transverse magnetization (i.e., of signal) in spin-echo imaging. This relaxation process is due to the dephasing of the individual magnetic dipoles because of the existence of non-stationary random local magnetic fields. On the other hand, the loss of transverse magnetization (i.e., of signal) in gradient-echo imaging is characterized by a relaxation time T 2*. Two factors contribute to the T 2* decay: the non-stationary random local magnetic fields (which generate the T 2 decay) and the static (i.e., constant in time) inhomogeneities in the magnetic field. Static distortions in the magnetic field are particularly dominant near interfaces between regions with different magnetic susceptibilities (air–tissue interface, for example). It should be noted that the dephasing of spins resulting from static field inhomogeneities is a reversible process, which is accomplished by applying a 180° pulse (which is present in the spin-echo imaging). The dephasing due to fluctuating magnetic fields, however, is not reversible.
Stay updated, free articles. Join our Telegram channel

Full access? Get Clinical Tree


