Fig. 4.1
Five steps of radiation therapy and examples of image processing techniques in each step
The first step is the diagnosis of the patient. In this step, a radiation oncologist determines the treatment policy, e.g., curative treatment or palliative treatment, but computer-aided diagnosis techniques may also be useful if the oncologist decides to use multiple modalities.
The second step is the treatment planning. In this step, the treatment planner should extract the gross tumor volume (GTV) and the OAR, and should formulate an “optimum” plan by arranging beams to maximize the tumor dose and minimize the OAR dose. Various automated segmentation methods have been developed and are still being researched for the extraction of tumor and OAR regions. Image registration techniques are very useful for segmenting tumors using fused images that combine morphological and functional images such as planning CT images and positron emission tomography (PET) images. In particle therapy, treatment planners should take into account patient setup error when the beam directions are determined; otherwise, the actual dose distribution in the patient during treatment may be strongly degraded compared with the planned dose distribution.
The third step is the patient setup. In this step, the radiation therapists position a patient on the treatment couch. Image registration techniques, which register a moving image to a reference image using corresponding feature points between the two images, are employed for correction of a patient’s setup errors. Previous studies have demonstrated that these techniques are indeed effective for reducing the setup errors [6, 7]. In general, digitally reconstructed radiograph (DRR) images and planning CT images are used as the reference images, and electronic portal imaging device (EPID) and cone-beam CT (CBCT) images produced using kilovoltage or megavoltage X-rays at the treatment time are employed as the moving images.
The fourth step is the treatment itself. An X-ray or particle beam is delivered to the patient according to the treatment plan. One of the major issues is the radiation delivery for moving tumors such as lung or liver cancers. Pattern recognition techniques, such as the detection of tumors and fiducial markers (e.g., gold marker), are essential for minimizing the treatment time in these cases. For instance, a real-time tumor tracking radiography (RTRT) system has been developed, which employs pattern recognition techniques by following a gold marker within the tumor in order to track the tumor and switch the X-ray beam on and off [8].
Finally, the fifth step is the follow-up. In this step, the radiation oncologist evaluates the treatment outcomes using multimodality imaging devices. Pattern recognition techniques have also been applied during the follow-up to predict the radiation therapy outcomes and normal tissue complications [9–13].
In this chapter, we will consider computational and intelligent approaches in the radiation treatment planning, because the treatment planning step is indispensable, and largely dictates the subsequent steps. Therefore, a number of studies on computational intelligent image analysis used for computer-aided decision making in the radiation treatment planning have been introduced, including automated beam arrangement based on similar cases, computerized contouring of lung tumor regions using a support vector machine (SVM) classifier, and a computerized method for determination of robust beam directions against patient setup errors in hadron particle therapy.
Computer-Aided Decision Making for the Determination of Beam Arrangements
Background
Stereotactic body radiotherapy (SBRT) has been widely used for the treatment of early stage lung cancers in recent decades [14]. The survival rate for SBRT has been encouraging and potentially comparable to that for surgery [5]. Daily doses in conventional external beam radiotherapy are typically delivered in the range of 1.8–2.0 Gy (total doses: 60–70 Gy), whereas stereotactic body radiotherapy (SBRT) is generally administered at five or fewer fractions of high doses of 10–20 Gy per fraction. The shortened treatment time with fewer fractions would result in significant benefits to both patients and hospitals, which have limited inpatient capabilities. However, high doses per treatment have been considered dangerous in the past due to limitations in the treatment delivery technology, such as incomplete immobilization, that raised concerns about potential toxicity if large volumes of normal tissues or OAR were exposed to high dose radiation during each treatment. With the recent advances in treatment techniques, it has become possible to concentrate very large doses of radiation to tumors and to minimize the doses to surrounding normal tissues by using multiple beams directed in coplanar and non-coplanar directions [15]. However, the determination of beam arrangement is a substantially demanding task for inexperienced treatment planners and affects the critical dose distribution with steep dose gradients.
Treatment planning skills are developed by repeated planning in clinical practice, often under the guidance of experienced planners or appropriate textbooks. In this way, treatment planners should memorize many planning patterns and construct an evolving “database” in their memory, which can then be searched for previous cases similar to the case under consideration. However, although a number of automated methods for determination of beam arrangements have been developed [16, 17], there are currently no such methods for determining beam arrangements based on similar previous cases. On the other hand, in the field of diagnostic radiology, the presentation of similar cases as a diagnostic assist has been suggested for diagnosis of chest images [18], lung computed tomography (CT) images [19, 20], and mammography images [20–23]. These researches have indicated the feasibility of using similar cases as a diagnostic assist. However, to the best of our knowledge, there are no studies on the feasibility of using similar planning cases for the determination of beam arrangements in the field of radiation therapy.
Computer-Aided Beam Arrangement Based on Similar Cases in Radiation Treatment Planning Databases
The authors developed a computer-aided decision making method for determination of beam arrangements based on similar cases in a radiotherapy treatment planning (RTP) database of the results from experienced treatment planners. Similar-case-based beam arrangements were automatically determined based on the following two steps. First, the five plans showing the greatest similarity to an objective case were automatically selected in the RTP database by considering the weighted Euclidean distance of geometrical feature vectors, i.e., related to the location, size, and shape of the planning target volume (PTV), lung, and spinal cord, between the objective case and each plan in the RTP database. Second, the five beam arrangements of an objective case were automatically determined by registering five cases similar to the objective case with respect to lung regions by means of an affine transformation.
Selection of Similar Treatment Plans Based on Geometrical Features
In the first step, the five plans most similar to an objective case were automatically selected in the RTP database by considering the weighted Euclidean distance of geometrical feature vectors between the objective case and each plan in the RTP database. The weighted Euclidean distance was considered a similarity measure. The weights of geometrical features were needed to give the geometrical features the appropriate degree of importance from the treatment planning point of view. Therefore, when applying the proposed method to their own databases, each institute should determine the appropriate weights of the geometrical features based on their own philosophy or policy of treatment planning. The weighted Euclidian distance d image was calculated by the following equation:
where G is the number of geometrical features, w i is the weight of the i-th geometrical feature, α i is the i-th geometrical feature for the objective case, and β i is the i-th geometrical feature for each case in the RTP database. Note that each geometrical feature was divided by the standard deviation of all cases in the RTP database to normalize the range of each feature value. In this study, we defined ten geometrical features, i.e., the x, y, z coordinates of a PTV centroid, the effective diameter of the PTV, the sphericity of the PTV, the lung length in the left–right (LR), anterior–posterior (AP), and superior–inferior (SI) directions, the distance in the centroid between the PTV and spinal cord in the isocenter plane, and the angle from the spinal cord to the PTV in the isocenter plane. Weights for geometrical features were empirically determined by using the five training cases so that cases more similar to the objective case could be selected.
(4.1)
Determination of Beam Arrangements Based on Similar Treatment Plans Using the Linear Registration Technique
In the second step, five beam angles of an objective case were automatically determined by registration of five similar treatment plans with the objective case with respect to lung regions using a linear registration technique, i.e., affine transformation [24]. First, the affine transformation matrix to register the lung regions of each similar plan with that of the objective case was calculated by using a least squares method based on eight feature points, which were automatically selected for the registration in vertices of the circumscribed parallelepiped of lung regions. Second, a beam direction, i.e., beam position vector, based on a gantry angle θ and couch angle φ was transformed from a spherical polar coordinate system to a Cartesian coordinate system as a unit position vector. Third, each beam position vector of similar cases was modified in the Cartesian coordinate system by using the same affine transformation matrix as a registration in terms of lung regions. Finally, the resulting position vector was converted from the Cartesian coordinate system to the spherical polar coordinate system as gantry angle θ′ and couch angle φ′.
Evaluation of Beam Arrangements Determined Based on Similar Treatment Plans Using Planning Evaluation Indices
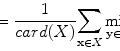
The most usable plan was selected by sorting the five plans based on an RTP evaluation measure with 11 planning evaluation indices, which was the Euclidean distance in a feature space between each plan and an ideal plan. In this study, the ideal plan was assumed to produce a perfect uniform irradiation with a prescription dose in the PTV and no irradiation in the surrounding organs and tissues. The usefulness of each plan was estimated by the following Euclidean distance d plan of the planning evaluation vector between the ideal plan and each plan determined by a similar plan, and the Euclidean distance was considered the RTP evaluation measure:
where J is the number of planning evaluation indices, X j is the j-th planning evaluation index for the ideal plan, and Y j is the j-th planning evaluation index for the plan based on the five most similar plans. Each planning evaluation index was normalized in the same manner as the geometrical features. The eight evaluation indices consisted of the D95, homogeneity index (HI), conformity index (CI) for the PTV, V5, V10, V20, mean dose for the lung, and maximum dose for the spinal cord, and their values for the ideal plan were set to 48 Gy (prescription dose), 1.0, 1.0, 0 %, 0 %, 0 %, 0 Gy, and 0 Gy, respectively.
(4.2)
Evaluation of Computer-Aided Beam Arrangement Based on Similar Cases
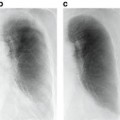
We applied the proposed method to ten test cases by using an RTP database of 81 cases with lung cancer and compared the eight planning evaluation indices between the original plan and the corresponding most usable similar-case-based plan. Figure 4.2 shows an objective case with a tumor on the lung wall (Fig. 4.2a) and the first to third most similar cases (Fig. 4.2b–d) to the objective case. The similar cases geometrically resemble the objective case (Fig. 4.2a), especially in terms of the geometrical relationship between the tumor and the spinal cord. Figure 4.3 shows a plan obtained by the original beam arrangement (Fig. 4.3a), and three plans determined by similar-case-based beam arrangements (Fig. 4.3b–d), which were sorted in descending order based on the RTP evaluation measure. The plans of Fig. 4.3b–d were derived from similar cases as shown in Fig. 4.2b–d, respectively. In this case, the beam arrangements consisted of seven to eight beams with three to four coplanar beams and three to four non-coplanar beams. The objective case (Fig. 4.3a) received an oblique lateral beam, which passed close to the spinal cord in order to increase the conformity of the PTV. On the other hand, the most usable similar-case-based beam arrangement (Fig. 4.3b) had no lateral beams for avoiding the spinal cord, but the second to third usable cases (Fig. 4.3c, d) had lateral beams due to prioritizing the PTV conformity rather than sparing the spinal cord. As a result, there were no statistically significant differences between the original beam arrangements and the most usable similar-case-based beam arrangements (P > 0.05) in terms of the eight planning evaluation indices including the D95, mean lung dose, and spinal cord maximum dose. In conclusion, the proposed method suggested usable beam arrangements with little difference from cases in the RTP database, and thus it could be employed as an educational tool for less experienced treatment planners.
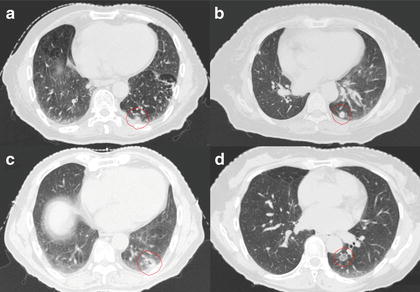
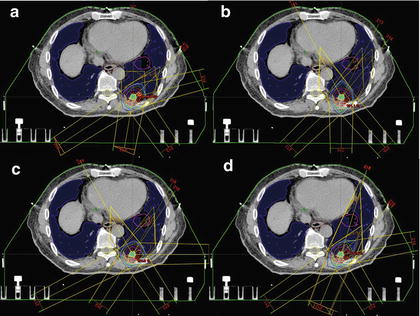
Fig. 4.2
An objective case with a tumor on the lung wall (a) and the first to third most similar cases (b–d) to the objective case
Fig. 4.3
A plan obtained by the original beam arrangement (a), and three plans determined by similar-case-based beam arrangements (b–d), which were sorted in descending order based on the RTP evaluation measure
Computer-Assisted Contouring of Tumor Regions in Radiation Treatment Planning
Background
To improve the outcomes of radiotherapy, stereotactic radiotherapy has been developed for the treatment of stable tumors such as brain tumors by delivering very higher doses in small irradiation fields. Moreover, SBRT has been applied to moving tumors such as lung tumors while immobilizing the body and monitoring tumor locations. In the SBRT technique, tumor dose is maximized while the normal tissue dose is minimized. However, it would be assumed that the tumor and OAR contours should be determined as accurately as possible. In fact, the accuracy of contouring or segmentation of tumors affects the precision of radiotherapy, because the prescribed dose distribution in RTP is determined based on the tumor regions, which are manually determined on planning CT images on a slice-by-slice basis by a treatment planner. However, the subjective manual contouring is tedious and its reproducibility would be relatively low, resulting in inter-observer variability and intra-observer variability of tumor regions [4, 25–28]. The tumor region is called the GTV, which is defined as the visible tumor volume in images. A number of automated contouring methods for the GTVs have been proposed for reducing the inter-observer variability and intra-observer variability, planning time, and increasing segmentation accuracy of the GTVs. The conventional methods are based on thresholding of the standardized uptake value (SUV) [29, 30], or on the region growing method [28], Gaussian mixture model [31], fuzzy c-means algorithm [32], fuzzy locally adaptive Bayesian approach [33, 34], gradient-based segmentation method [35], model-based method [36], and atlas-based method [37]. However, there have been a few studies on segmentation methods for tumor regions based on biological information as well as physical information, such as PET and CT images. 18F-FDG PET directly shows biological information of higher metabolic rates compared with normal tissues for the radiolabeled glucose, which is associated with malignant neoplasms. El Naqa et al. [38] developed a multimodality segmentation method using a multivalued level set method, which can provide a feasible and accurate framework for combining imaging data from different modalities (PET/CT), and is a potentially useful tool for the delineation of biophysical structure volumes in radiotherapy treatment planning. On the other hand, in this study, we tried to incorporate the tumor contours determined by radiation oncologists based on the PET biological information and CT morphological information into the proposed contouring method by using a machine learning method. Therefore, the aim of this study was to develop an automated method for contouring the GTVs of lung tumors with an SVM, which learned various contours determined on planning CT images by radiation oncologists while taking into account the PET/CT images.
Automated Method for Contouring the GTVs of Lung Tumors Using an SVM Classifier with Knowledge from Radiation Oncologists’ Contours on Data Sets of Planning CT and FDG-PET/CT Images
The proposed method was composed of four steps. First, the planning CT, the PET/CT images, and GTV data were converted into isotropic images by using interpolation methods. Second, the PET images were registered with the planning CT images through the diagnostic CT images of PET/CT. Third, six voxel-based features including voxel values and magnitudes of image gradient vectors were derived from each voxel in the planning CT and PET /CT image data sets. Finally, lung tumors were extracted by using an SVM, which learned six voxel-based features inside and outside each true tumor region.
Registration of the PET Image to the Planning CT Image
Related posts:
 The Role of Content-Based Image Retrieval in Mammography CAD
 Liver Volumetry in MRI by Using Fast Marching Algorithm Coupled with 3D Geodesic Active Contour Segmentation
 Brain Disease Classification and Progression Using Machine Learning Techniques
 Subtraction Techniques for CT and DSA and Automated Detection of Lung Nodules in 3D CT
 Bone Suppression in Chest Radiographs by Means of Anatomically Specific Multiple Massive-Training ANNs Combined with Total Variation Minimization Smoothing and Consistency Processing
 Image Segmentation for Connectomics Using Machine Learning
Stay updated, free articles. Join our Telegram channel

Full access? Get Clinical Tree


