1.
Hi Speed CT/i(GE MEDICAL SYSTEM)
HISPEED-RP, Light Speed16(GE MEDICAL SYSTEM)
Light Speed QX/i(GE MEDICAL SYSTEM)
GENESIS_FOREIGN(GE MEDICAL SYSTEM)
2.
Reconstruction function: STANDARD, BONE, DETAIL
3.
Matrix size: 512 × 512
4.
Pixel size: 0.570–0.769 mm
5.
Slice thickness: 5–10 mm
6.
Reconstruction interval: 5–14 mm
7.
Contrast enhancement (CE): 8 out of 69
Methods and Results
Subtraction CT Technique
Overall Scheme
Figure 14.1 shows the overall scheme for the subtraction CT technique.
Fig. 14.1
Overall scheme of subtraction CT technique
In this scheme, “mask image” for the subtraction CT is obtained from three CT section images based on a 3D morphological filter applied to two sections, which include the target section image and the upper or lower section image.
The line components of the target section image are detected by using a line enhancement filter. The line components are added to the mask image to reduce artifacts on subtraction CT image.
3D Morphological Filtering
We have developed a new method to create a mask image based on morphological filtering with 3D cylindrical and a 2D circular shape kernel. Dilation or erosion corresponds to the replacement of the pixel value with the maximum or minimum value within the kernel, respectively. The 3D opening and the 3D closing operation are illustrated in Fig. 14.2a, b, respectively [47].
Fig. 14.2
Three-dimensional morphological filtering. (a) 3D opening operation, (b) 3D closing operation
Figure 14.3d, e show upper and lower intermediate images obtained by the 3D opening operation on the target section image and two section images immediately above and below the target section image (Fig. 14.3a–c), respectively. Figure 14.3f shows the mask image obtained by the 3D closing operation for the two intermediate images.
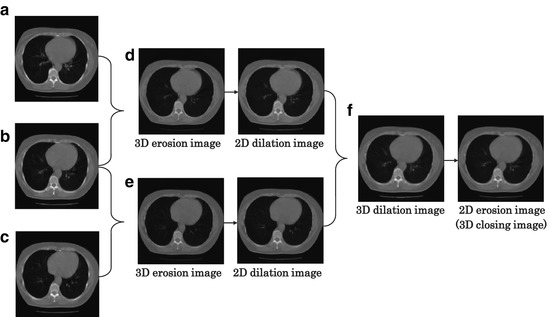
Fig. 14.3
Creation of a mask image with a 3D morphological filter. (a) Upper image, (b) target image, (c) lower image, (d) upper intermediate image, (e) lower intermediate image, (f) mask image
It should be noted that the mask image, as shown in Fig. 14.3f, can retain vessels, which is basically the same as that on the target section, while removing a small nodule. Therefore, the subtraction of the mask image from the target section can reveal only nodular opacity without the vessels.
Detection of Line Components on Target Image
We extracted line components by using a line enhancement filter on the target image for reduction of misregistration artifacts on subtraction CT image. The line enhancement filter includes eight sets of three templates in eight different directions, as shown in Fig. 14.4 [48, 49]. The output value of the line enhancement filter is defined as follows:
 where Ai, Bi, and Ci are the summation for all pixel values in each template of a set. The maximum value E, obtained from the outputs of the sets is the final output value.
Fig. 14.4
Line enhancement filter
To detect various diameters of vessels, parameters for the line enhancement filter (i.e., length and width of the templates) and the interval between the templates were varied depending on the distance between the center of the template and the center on the section image.
An enhanced line image and the extracted line components are shown in Figs. 14.5 and 14.6, respectively. Both vessels at the hilar area and the peripheral area are well enhanced. The line components are added to the mask image obtained by 3D morphological filtering.
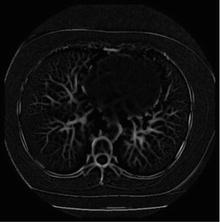
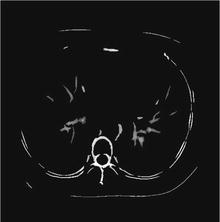
Fig. 14.5
Enhanced line image
Fig. 14.6
Detected line components
Subtraction CT Image by Using 3D Morphological Filtering
Figure 14.7a shows a target image with early lung cancer (arrow). The mask image is obtained by the 3D morphological filtering with the target section image and the sections immediately above and below the target image, as shown in Fig. 14.7b. The mask image can include pulmonary vessels on the target image and thus most vessels can be removed by the subtraction. A nonlinear geometric image warping technique, which is described in the section “Temporal Subtraction CT Technique,” is then performed to the mask image for further reduction of misregistration artifacts on subtraction CT image. The subtraction CT image is obtained by subtracting the warped mask image from the target CT image, as shown in Fig. 14.7c. Subtle nodule is clearly enhanced in the subtraction CT image, although some misregistration artifacts are observed.
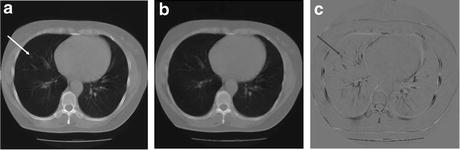
Fig. 14.7
Subtraction CT image by using 3D morphological filtering (case 1). (a) Target CT image, (b) mask image without line components, (c) subtraction CT image
Improved Subtraction CT Images by Using Line Enhancement Filter
For further reduction of misregistration artifacts on the subtraction CT image, the pixel values of the target image over the areas of the detected line components are applied to replace the pixel values over the same areas in the mask image, which is obtained by the morphological filtering technique. The mask images with line components are shown in Figs. 14.8b and 14.9b. The subtraction CT images are shown in Figs. 14.8c and 14.9c. It should be noted that the small nodule remains as dark shadows, and the misregistration artifacts in Figs. 14.8c and 14.9c were considerably reduced compared to the subtraction CT image, as shown in Fig. 14.7c.
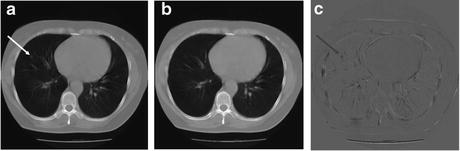
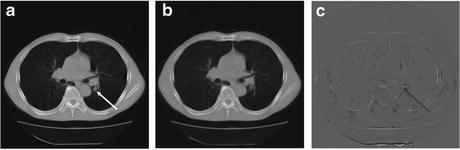
Fig. 14.8
Subtraction CT image by using 3D morphological filtering and line enhancement filtering (case 1). (a) Target CT image, (b) mask image with line components, (c) subtraction CT image
Fig. 14.9
Subtraction CT image by using 3D morphological filtering and line enhancement filtering (case 2). (a) Target CT image, (b) mask image with line components, (c) subtraction CT image
Image rotation caused by variation in patient positioning between the current and the previous CT images is then corrected by an image rotation technique. The rotation angles between the current and the previous CT images are determined by use of the template matching technique.
Temporal Subtraction CT Technique
Figure 14.10 shows the overall scheme for the temporal subtraction CT technique. In this scheme, the corresponding previous section image for each current section image is selected automatically from previous CT images by using a template matching technique.
Fig. 14.10
Overall scheme of temporal subtraction CT technique
Automated Selection of Corresponding Section Images
The selection of the corresponding section in the two sets of CT images is performed by a template matching technique. In this method, the current and previous CT images are blurred by a Gaussian filter and then subsampled to low-resolution image (128 × 128 matrix size). A circumscribed rectangular region of interest (ROI) of segmented lung image is selected automatically from each current image. The corresponding image and its best matched location are determined when the cross-correlation value between the current image and previous image becomes the maximum, as shown in Fig. 14.11.
Fig. 14.11
Selection of the best matched previous image. (a) Current CT images, (b) previous CT images
In addition, the image rotation between the current and previous image is corrected based on template matching technique. Thus, the corresponding pairs of the current and previous section images are obtained.
Temporal Subtraction CT
To achieve accurate registration between the current and previous section images, an iterative image warping is applied to the previous CT image. In this method, a number of template ROIs and the corresponding search area ROIs were selected from the previous and the current CT images, respectively. We determined the shift values for all pairs of selected ROIs by using a template matching technique to find the best matched areas in the search area ROI. A two-dimensional surface fitting using a polynomial function was then applied to each set of mapped shift values for conversion of the coordinates of the previous CT image, i.e., for warping of the image. The warped previous CT image is then subtracted from the current CT image.
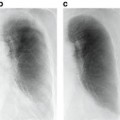
Figures 14.12a, b and 14.13a, b show the previous CT images and the current CT images with lung cancer (arrow). The temporal subtraction CT images using global matching but not using iterative image warping technique are shown in Figs. 14.12c and 14.13c. Lung cancers were enhanced as dark shadows on subtraction images; yet, some misregistration artifacts exist. The temporal subtraction CT images with both global matching and the iterative image warping technique, as shown in Figs. 14.12d and 14.13d enhanced clearly the lung cancers. Misregistration artifacts were reduced remarkably compared to the temporal subtraction CT image without iterative image warping technique.
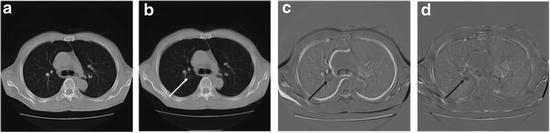
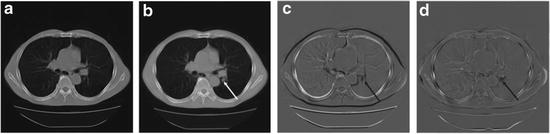
Fig. 14.12
Temporal subtraction CT images (case 1). (a) Previous image, (b) current images, (c) without image warping, (d) with image warping
Fig. 14.13
Temporal subtraction CT images (case 2). (a) Previous image, (b) current images, (c) without image warping, (d) with image warping
Development of DSA for Coronary Arteriography
Method
Related posts:
 Computational Intelligent Image Analysis for Assisting Radiation Oncologists’ Decision Making in Radiation Treatment Planning
 The Role of Content-Based Image Retrieval in Mammography CAD
 Liver Volumetry in MRI by Using Fast Marching Algorithm Coupled with 3D Geodesic Active Contour Segmentation
 Computational Anatomy in the Abdomen: Automated Multi-Organ and Tumor Analysis from Computed Tomography
 Bone Suppression in Chest Radiographs by Means of Anatomically Specific Multiple Massive-Training ANNs Combined with Total Variation Minimization Smoothing and Consistency Processing
 Image Segmentation for Connectomics Using Machine Learning
Stay updated, free articles. Join our Telegram channel

Full access? Get Clinical Tree


