, Valerie Schawaroch2, 3 and Kevin J. Frischmann4
(1)
Department of Biology, Seton Hall University, South Orange, NJ, USA
(2)
Department of Natural Sciences, Baruch College, New York, NY, USA
(3)
Division of Invertebrate Zoology, American Museum of Natural History, New York, NY, USA
(4)
Bitplane Inc., Saint Paul, MN, USA
Abstract
Three-dimensional (3-D) rendering methods (maximum intensity projection, alpha blending, and isosurface rendering) are described for the visualization of thick, autofluorescent, arthropod cuticular structures (e.g., Drosophila melanogaster external genitalic structures) imaged by confocal laser scanning microscopy (CLSM). Additionally, specimen mounting and data collection strategies for thick specimens are described. Axial aberration artifacts are discussed in the context of these methods because of the critical roles they play in the quality of final 3-D images.
Key words
Confocal microscopySpherical aberrationDrosophilaMaximum intensity projectionVolume renderingSurface renderingThree-dimensional reconstructionVolume visualizationAxial aberration1 Introduction
Confocal imaging offers the ability to produce three-dimensional (3-D) data sets of fluorescent biological specimens. This capability is made possible through the use of a pinhole aperture placed in front of the signal detector which blocks out-of-focus light from inclusion in the final image. The pinhole allows only light from each focal plane in a 3-D object to be collected; this process is called “optical sectioning.” If imaging conditions are properly optimized, data sets obtained by optical sectioning can be reconstructed into accurate, 3-D representations of the original specimen.
For some biological materials, the natural endogenous fluorescent signal (autofluorescence) can be exploited in order to determine the overall morphology of a 3-D object. In confocal microscopy, the autofluorescent signal is usually a source of unwanted background which detracts from visualizing the signal of interest. However, for some specimens, such as pollen grains [1] and arthropod cuticular structures [2–5], the autofluorescent signal is a useful source of morphological information.
1.1 Aberration Artifacts
In order to produce a 3-D reconstruction of a structure which accurately represents the original specimen along the x, y, and z axes, particular attention must be paid to specimen mounting and imaging conditions. This is especially true if the investigator wishes to accurately represent dimensions along the z-axis (axial direction). Artifacts arising from suboptimal mounting and imaging conditions can distort 3-D confocal data sets of thick (~10 μm or more) specimens. Axial artifacts in 3-D data sets arise from two main imaging conditions: (1) refractive index mismatch in the optical setup and (2) increased imaging depth as the illuminating spot penetrates further into a specimen in order to collect deeper optical sections. These conditions, in turn, can result in (1) distortion (compression or elongation) of structures along the z-axis (Fig. 2a) and (2) data loss from deeper optical slices (Fig. 2c–f). Spherical aberration of the illuminating spot and scattering/absorption of excitation photons are the major physical causes of axial aberration artifacts in thick specimens [3, 6, 7].
As mentioned above, artifact minimization can be achieved by optimizing specimen mounting and imaging conditions. In order to minimize axial distortion (elongation or compression), refractive index (RI) mismatch between the mounting medium and the immersion medium must be avoided. However, for the issue of increased penetration depth in thick specimens, it is not possible to completely eliminate data loss. Our approach to the latter problem has been to mount thick specimens between two coverslips and image the structures of interest from both sides by flipping the mount (Figs. 1 and 2c–f). Other possible approaches to the problem of data loss include software-controlled attenuation correction either during data collection (see Note 1) or specialized computational compensation methods performed on acquired data sets [8, 9]. Additionally, volumes collected from each side of a thick specimen can be aligned and reconstructed into a single volume [4].


Fig. 1
Side views of mounting method and imaging setup for various sized specimens imaged on an inverted microscope. Lens selection will vary according to what objectives are available to the investigator. (a) 20× dry objective lens. Very thick specimens can be accommodated because of the long working distance (610 μm) of the lens. However, the large refractive index mismatch between the immersion medium (air; 1.00) and the mounting medium (e.g., 1.51 for euparal or 1.47 for glycerin jelly) will cause severe artifacts including axial compression and data loss. Increased penetration depth inherent to imaging thick specimens is also a major contributor to data loss from optical sections farthest from the sources of illumination and detection. Spacers are used with larger structures to avoid crushing. (b) 25× multi-immersion lens. This lens is equipped with a correction collar which enables the use of variable immersion media (oil, glycerin, or water). The working distance of the lens (210 μm) allows for imaging of intermediate thickness specimens with reduced spherical aberration due to the ability to match refractive indices. The gradient shown within the specimen in panels A and B represent data loss as a function of penetration depth. (c) 40× oil immersion lens. This lens has a short working distance (120 μm) and is therefore suitable for smaller structures. Specimens that are naturally flattened do not require the use of spacers. If specimens are mounted in a medium with an RI close to that of oil, the match in refractive index and the shallow sample depth will minimize axial artifacts. Both the lateral and the axial resolution improve when the numerical aperture (NA) of the lens increases
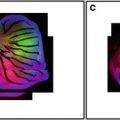
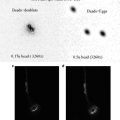
Fig. 2
Axial (z-axis) aberration artifacts in a thick autofluorescent specimen. The specimen shown in all panels is the phallic structure from D. melanogaster and measures approximately 100–150 μm in thickness as determined by scanning electron microscopy measurements (see ref. 3). (a) This specimen was mounted in glycerin jelly (RI ~ 1.47) and imaged with a dry objective lens (RI of air = 1.00); therefore, the refractive index mismatch was severe. Note that the tip of the aedeagal apodeme (arrow ) was lost during image processing. (b) This specimen was mounted in euparal medium (RI when dry ~1.52) and imaged with oil as an immersion medium (RI = 1.51) using the multi-immersion lens described in Fig. 1b. Note the severe compression of the data set in (a) vs. (b). (c, d) These images depict one complete data set that has been volume rendered as viewed from the side of specimen closest to (panel c) and farthest from (panel d) the sources of illumination and detection (laser and photomultiplier tube [PMT], respectively). (e, f ) The structure shown in panels c and d was imaged again after flipping the mount. In this example, (f ) is now the side of specimen closest to the laser and PMT, and (e) is the farthest away. Panels (c) and (e) both depict the “shield side” of the hypandrium; a comparison of the two renderings clearly shows a significant loss of data in (e). Likewise, a comparison of panels (d) and (f), which depict the other side of the specimen, shows significant data loss in panel (d) as judged by the partial loss of the phallic envelope (ph env). Panels a and b were rendered using the surface rendering function in the Surpass module in Imaris; panels (c–f ) were rendered using the blend function in Surpass
1.2 Volume Visualization
The depth dimension of 3-D confocal data sets can be viewed in a number of ways. Confocal optical sections can be viewed either individually by successively slicing through a volume or simultaneously as a sequenced array of x, y images with volume depth indicated for each slice. These techniques are extremely useful, but they can be insufficient when an overall picture of the 3-D volume is needed.
Common 3-D rendering techniques for confocal data visualization include volume and isosurface rendering. Advantages of these methods include the ability to (1) produce lighting and shading effects which improve perception of depth and texture, (2) vary opacity settings in order to visualize internal structures, (3) enhance surface textures, and (4) create models that can be rotated interactively (or made into movies) for visualization of the spatial interrelationship of structures from all viewing angles. In instances where imaging conditions are optimized (i.e., aberration free or very nearly so), it is possible to use advanced 3-D visualization techniques to create accurate representations of the original object along all axes (x, y, and z).
This chapter describes the mounting, imaging, and 3-D visualization techniques that we have used with great success for confocal imaging of thick autofluorescent insect cuticular structures.
2 Materials
2.1 Obtaining Specimens
Drosophila melanogaster (wild type) can be ordered from a variety of sources: (1) scientific supply houses which distribute live materials such as Carolina Biological Supply Co. (www.carolina.com) and Ward’s Natural Science Supply company (www.wardsci.com) and (2) Drosophila stock centers such as the Bloomington Drosophila Stock Center at Indiana University at Bloomington Indiana for mutant animals (http://flystocks.bio.indiana.edu/) and the UC San Diego Drosophila Species Stock Center (https://stockcenter.ucsd.edu/info/welcome.php). A complete listing of stock centers can be found on Flybase (http://flybase.org).
2.2 Coverslips for Mounting and Spacing
Top and Bottom Glass
Fisher Scientific brand cover glass No. 1.5 (0.16–0.19 mm nominal thickness), 22 × 50 mm (Fisher scientific catalog # 12544D).
Related posts:
 Confocal Imaging of Butterfly Tissue
 Confocal Imaging of Fluorescently Labeled Proteins in the Drosophila Larval Neuromuscular Junction
 Imaging Tools for Analysis of the Ureteric Tree in the Developing Mouse Kidney
 Live Confocal Analysis of Mutant- and Drug-Treated Drosophila Embryos
 Evaluating Confocal Microscopy System Performance
 Laser Scanning Confocal Microscopy: History, Applications, and Related Optical Sectioning Techniques
Stay updated, free articles. Join our Telegram channel

Full access? Get Clinical Tree


