(1)
National High Magnetic Field Laboratory and Department of Biological Science, The Florida State University, Tallahassee, FL, USA
Abstract
In a few short years, the Internet (in terms of the World Wide Web) has become a powerful informational resource for the original scientific literature pertaining to biological investigations using the laser scanning confocal microscope. However, there still remains an obvious void in the development of educational Web sites targeted at beginning students and novices in the field. Furthermore, many of the commercial aftermarket manufacturers (for example, those offering live-cell imaging chambers) have Web sites that are not adequately represented in published compilations, and are therefore somewhat difficult to locate. In order to address this issue, several educational sites dedicated to optical microscopy and digital imaging that are being constructed and hosted at The Florida State University are currently turning their attention to the increasing application of confocal microscopy in the biological and materials sciences. The primary focus of this effort is to create new sections on the existing sites that address the important educational issues in confocal microscopy, as well as creating indices of links to both the confocal scientific literature and the Web sites of manufacturers who supply useful accessories.
Key words
Confocal microscopyInternetWebHTMLJavaFlashInteractive tutorialsDigital videoImage processingStreaming media1 Introduction
Ten years before the Internet became a practical vehicle for the dissemination of information on an international basis due to the introduction of hypertext transfer protocol (HTTP; 1–3), the first practical laser scanning confocal microscopes were being developed in several laboratories and emerging as a serious instrument for probing the intricacies of biological systems at high resolution [4–8]. Confocal microscopy was becoming more than just a novelty in the early 1980s due to the upswing in applications of wide-field fluorescence to investigate cellular architecture and function [9–11]. As immunofluorescence techniques [12, 13], as well as the staining of subcellular structures using synthetic fluorophores [14], became widely practiced in the late 1970s, microscopists grew increasingly frustrated with their inability to distinguish or record fine detail in wide-field instruments due to interference by fluorescence emission occurring above and below the focal plane. It therefore comes as no surprise that the introduction of the laser scanning confocal microscope, featuring highly focused beam scanning in a raster pattern across the stationary specimen with the elimination of out-of-focus signal through the application of conjugate pinhole apertures, was immediately embraced by the research community.
The first edition of HTTP was functional for the transfer of hypertext documents, but was unable to support graphics, multimedia (audio and video), or proprietary file formats, such as Microsoft Word or Adobe PostScript. Likewise, the first prototype confocal microscopes were limited in their ability to readily process the potentially large amount of data that could be collected from three-dimensional specimens. In the mid-1980s, desktop computers, which would ultimately, in later years, be widely utilized to control sophisticated confocal microscopes, were still in their infancy with comparatively (by today’s standards) slow processor speeds, memory capacity, and operating systems that were limited in their ability to handle graphics. Tasks that are routine on modern confocal microscopes, such as three-dimensional volume rendering, computer control of laser intensity and wavelength, and the creation of video sequences on the fly, were beyond the reach of most computers in the 1980s and early 1990s.
The first commercial confocal microscope prototype was developed by researchers at the Medical Research Council (MRC) Laboratory of Molecular Biology in Cambridge, United Kingdom during the late 1980s [15, 16]. The microscope was accompanied by a powerful software package, entitled SOM (Scanning Optical Microscope), which was amazingly advanced for the period and drew as much attention as the microscope itself. In fact, the software and frame store buffer were so efficient that many investigators ultimately employed them for routine wide-field imaging with conventional cameras. Introduced to the scientific community in 1987 as the Bio-Rad MRC 500, the laser scanning confocal microscope quickly gained widespread recognition in the early 1990s, and was utilized to achieve spectacular results that were previously unattainable with wide-field instruments [17, 18]. During the mid-1990s, as the confocal microscope was becoming a staple of many research programs, the Internet HTTP protocol started to rapidly evolve from a trivial request/response application into a true messaging vehicle capable of transferring a wide spectrum of media formats between localized servers and remote clients. Ultimately, HTTP would become the underlying foundation for electronically linking digitally encoded documents through a virtual international World Wide Web of interconnected computer systems.
By 1997, the Web was burgeoning in popularity due, in no small part, to the introduction of novel software applications, such as Java [19] and Flash [20], and the adaptation of standards for transmission of audio and video multimedia files. During this period, client software (termed “Web browsers”) also became increasingly more sophisticated as the competing packages from various manufacturers were incrementally being equipped with the ability to display a larger array of image formats, interface with audio sound systems, and embed specialized “plug-in” modules to enable the control capabilities of emerging interactive (Java and Flash) software. The rapid advances in Internet software development were paralleled by equally dramatic steps in the capability of personal computers to multi-task and handle the continuously increasing hardware demands of video, audio, and other memory-hungry applications. At the turn of the century, a third critical factor in the utility of the Internet, search engine technology, had advanced to the stage where the millions of Web sites being cataloged on a daily basis could be logically categorized and sequentially hyperlinked (ranked) according to a variety of criteria for fast and efficient searches. The final component of the Web explosion from the year 2000 onward was the adoption of widespread home broadband Internet connections; broadband being defined as a connection of 768 kilobits per second (kbps) or higher downstream bandwidth (compared to the 36 kbps downstream bandwidth available over a phone line). In June of 2000, approximately 35 % of American adults had dial-up access to the Internet, with 3 % possessing broadband access. By April 2008, these numbers had shifted to 55 % of adults with broadband access, with a mere 9 % still using dial-up. The massive increase in broadband penetration rates vastly extended the practical reach of Web sites supporting rich content such as the above mentioned streaming video, high quality image galleries, and interactive java and flash applications, and enabled these Web sites to serve as a practical tool accessible outside of major institutions with dedicated Internet connections [21].
Advances in the development of computer hardware and software resources that led to widespread popularization of the Internet during the late 1990s and early twenty-first century also found their way into the evolution of confocal microscopes. These high speed computer systems, which could now be purchased for a couple thousand dollars, enabled the development of increasingly sophisticated software applications for confocal microscopy. New graphical interfaces were developed using Microsoft Foundation Classes [22] and the Visual C++ object-oriented programming language [23], featuring tab-style monitor display for image acquisition and processing, as well as computer control of lasers, photomultipliers, scanning mirrors (pan and zoom), and microscope configuration [24]. The introduction of acousto-optic tunable filters and modulators [25] enabled fine control of specific region scanning and laser intensity, while advanced protocol control processor software [24] could be programmed through macro command scripts for tight control of sequential scanning and successive recording of events, such as fluorescence resonance energy transfer (FRET), photobleaching recovery techniques (FRAP and FLIP), photoactivation, and time-course studies.
As the Web grew in popularity and became a viable alternative to walk-in libraries, a majority of the relevant scientific publications in fields relating to confocal microscopy began to make their content available on-line in the form of abstracts, HTML documents, and downloadable portable document format (PDF; 26) files that could be viewed in a Web browser and printed locally. These journals are now formally indexed by such services as PubMed (National Center for Biotechnology Information and National Institutes of Health; 27), Chemical Abstracts (American Chemical Society; 28), and PhysicsWeb (Institute of Physics; 29), as well as being informally cataloged by the popular Internet search engines (i.e., Google and Yahoo!; 30, 31) and, to a lesser degree, through the numerous Web sites of researchers in the field [32, 33].
Today, virtually every laboratory involved with confocal microscopy has the potential ability to maintain a site that assists users, the general public, and interested scientists with information relating to equipment, specimens, scheduling, and image galleries, in addition to educational tutorials. Several Web sites [34–44] have been developed by researchers, students, and the microscope manufacturers to specifically address current educational topics in disciplines related to confocal microscopy; however, most of these sites are limited in scope. Unfortunately, exhaustive Web searches have revealed scant educational information other than hyperlinks directly from the search engine return pages to PubMed for the original research articles, which are often difficult to understand for beginning students. To address this issue, the microscopy educational Web sites described in detail below are being populated with information on confocal microscopy in the form of well-illustrated review articles, interactive Java tutorials, image galleries, links to related Web sites, and the original research reports on PubMed, as well as the sister indexing services.
2 Microscopy Educational Web sites
For the past 14 years, the Optical Microscopy Research Group in the National High Magnetic Field Laboratory at The Florida State University (FSU) has been involved in the construction of educational Web sites targeted at undergraduate and graduate students in microscopy. The Molecular Expressions Web site [45], which is the largest product of this effort and hosts approximately 35,000 unique daily visitors (as determined by Internet Protocol; IP addresses), currently is 9500+ HTML pages in size and contains over 75 digital image galleries featuring a variety of contrast-enhancing techniques, such as phase contrast, fluorescence, darkfield, differential interference contrast (DIC), confocal, Hoffman modulation contrast, and brightfield. The site also offers hundreds of review articles on various topics in optical microscopy [46], which are accompanied by over 500 interactive Java tutorials that enable the visitor to experiment with variables in a manner similar to operating an actual microscope. Included in the many features on this site are an introduction to the physics of light and color, basic principles of the optical microscope, advanced and specialized contrast-enhancing techniques, fluorescence, photomicrography, digital image acquisition and processing, stereomicroscopy, laser scanning confocal microscopy, and a virtual museum of microscopes developed through the ages [47]. Similar Web sites are offered at no charge to the general public by Nikon (MicroscopyU; 48) and Olympus (Microscopy Resource Center; 49). Recently, Olympus has introduced an educational Web site (Olympus FluoView Resource Center; 43) dealing specifically with confocal microscopy.
Among the most useful features of the microscopy educational Web sites is that, unlike printed material, the dynamic nature of HTML enables the ability to continuously modify electronic documents in a timely manner in order to maintain current information. As an example, review articles and interactive tutorials dealing with rapidly expanding fields, such as the technology of diode and diode-pumped solid-state lasers [50, 51], can be easily modified to incorporate new information on these valuable light sources as it becomes available. In addition, Web-based tables and figures, such as the example in Table 1 cataloging the available laser sources for confocal microscopy (which is useful in comparing wavelength profiles during the complex task of matching fluorophore requirements with illumination sources), can be readily modified and maintained to ensure that the latest information is available. Finally, in contrast to the static reference sections of printed scientific publications, HTML listings of literature references can be hyperlinked to the originating journal Web sites or to indexing service databases, such as PubMed [27], which enable researchers and students to conveniently view abstracts and/or download PDF files of the original research reports, news commentaries, and review articles.
Table 1
Microscopy
Source | UV | Violet | Blue | Green | Yellow | Orange | Red | Near-IR |
|---|---|---|---|---|---|---|---|---|
Ar-Ion | 351, 364 | – | 457, 477, 488 | 514 | – | – | – | – |
Diode | – | 405, 440 | – | – | – | – | 635, 640 | 650, 660, 670, 685 |
DPSS | 355 | 430, 442 | 457, 473 | 532 | 556, 561 | 593 | 638 | 660, 671 |
He-Cd | 325, 354 | 442 | – | – | – | – | – | – |
He-Ne | – | – | – | 543 | 594 | 612 | 633 | – |
Kr-Ar | – | – | 488 | – | 568 | – | 647 | 676 |
Kr-Ion | – | – | – | – | – | – | 647 | 676, 752 |
Mercury | 365 | 405, 436 | – | 546 | 579 | – | – | – |
Xenon | – | – | 467 | – | – | – | – | – |
Mt Hal | 365 | 435 | 495 | 520, 545 | 575 | – | 625 | 685 |
3 Laser and Arc-Discharge Lamp Spectral Lines in Wide-Field and Confocal
The compilation of currently available laser sources for confocal microscopy presented in Table 1 is an excellent example of a rapidly evolving research frontier that can greatly benefit from the dynamic nature of the Internet. New semiconductor continuous wave and pulsed lasers have been reported at an unprecedented rate over the past couple of years, necessitating periodic updates to this table in order to preserve the timeliness and accuracy of information presented to visitors. Other educational Web site features that require frequent monitoring are listings of Internet resources with hyperlinks to external Web sites that may be of interest to visitors. Typically about 10–15 % of the external links on the combined FSU microscopy educational Web sites require editing on a semi–annual basis due to changes in the URLs.
Addressing topics of interest to science education in the K-12 arena, the breeding ground for future researchers using confocal microscopy techniques, the Web programming team at FSU has developed a site entitled Science, Optics and You [52], which is a microscopy curriculum package being targeted at middle and high school teachers, students, and parents. These activities are designed to promote the asking and answering by students of fundamental questions related to light, color, and optics. The program begins with basic information about lenses, shadows, prisms, light and color, and related topics in optics, leading up to the application of sophisticated instruments, such as microscopes, binoculars, digital cameras, and telescopes. The goal of Science, Optics and You is for students to acquire the skills with which they can conduct optical and microscopic analysis using entry-level microscopes on a variety of specimens, ultimately resulting in more advanced investigations on research instruments. This program is supported by Web-based student and teacher activities, interactive tutorials, a timeline in optics, and biographies of pioneers in light and optics. In addition, two low-cost microscopes designed for students, the Digital Blue QX3 (and QX5) and the Olympus MIC-D, are thoroughly reviewed, and a short introduction to confocal microscopy techniques is included. Illustrated in Fig. 1 are several interactive Java tutorials that serve as typical examples of the material designed for beginning students on the FSU microscopy and Science, Optics and You educational Web sites.

Fig. 1
Interactive Java tutorials based on common optical aberrations (astigmatism) (a) and the production of elliptically polarized light by a de Sénarmont compensator (b). Visitors to the Web site are able to operate the tutorials using sliders (off-axis distance and polarizer rotation angle), pull-down menus (specimen selection), and radio buttons (slow or fast compensator axis). The wavefront trajectories are dynamically controlled by the sliders in (b) and the entire compensator can be rotated using the cursor. Changes to the Airy pattern, point spread function, specimen image, and ray trace diagram (a) are continuously updated as the slider position is altered
The interactive Java tutorial featured in Fig. 1a demonstrates the basic fundamentals of the optical astigmatism aberration [53]. Students learn from this tutorial that the aberration is manifested by the off-axis image of a specimen point appearing as a line or ellipse instead of a point. Depending on the angle of the off-axis rays entering the lens, the line image may be oriented in either of two directions, tangentially (meridionally) or sagittally (equatorially). The intensity ratio of the unit image will diminish, with definition, detail, and contrast being lost as the distance from the center is increased. Somewhat more complex in nature, the tutorial illustrated in Fig. 1b demonstrates how a de Sénarmont compensator (implemented by several of the manufacturers in commercial differential interference contrast microscopes) is composed of a linear polarizer combined with a quarter-wavelength retardation plate, and is capable of producing either linear, elliptical, or circularly polarized light, depending upon the orientation of the polarizer vibration axis with respect to the fast and slow axes of the retardation plate. This interactive tutorial explores the relationship between wavefronts emanating from the compensator as the polarizer is rotated through its useful range [54]. Using customized Java class libraries, the tutorial presented in Fig. 1b has been designed to rotate through three-dimensional virtual space using the mouse cursor.
More advanced tutorials [55] on the microscopy educational Web sites are designed to explore complex techniques, such as creation and optical displacement of the wavefront field in differential interference contrast, the origin of specimen contrast using a condenser annulus and phase ring in phase contrast microscopy, the interaction of birefringent materials with linearly and circularly polarized light in optical microscopy, and the effect of condenser numerical aperture in darkfield microscopy. In the fast-paced arena of digital imaging in optical microscopy, a large collection of tutorials [56] is available to teach students how the fundamental tools of digital image processing can be utilized to manipulate, rehabilitate, edit, resize, rotate, and store images captured with an optical microscope (or other digital image recording device). These interactive tutorials each consider a specific algorithm or related series of algorithms that are useful for processing digital images. In addition, review articles on each topic are included for in-depth study in far greater detail.
3.1 Confocal Microscopy Educational Web Sites
The Olympus FluoView Resource Center Web site [43] is primarily focused on delivering educational materials targeting laser scanning confocal microscopy. Included on this site are review articles and interactive Java tutorials on a variety of topics relating to confocal techniques, including basic fluorescence excitation and emission fundamentals, resolution and contrast, spectral bleed-through artifacts, acousto-optic tunable filters, objectives, lasers, photomultipliers, scanning systems, and signal-to-noise considerations. The Web site also contains an exhaustive listing of useful fluorochromes, which is periodically updated as new synthetic probes are reported, as well as an extended glossary of common terms that attempts to simplify the complex nomenclature of fluorescence microscopy and related techniques. A literature section on the site describes the most current books available on confocal microscopy and provides links to the appropriate pages from booksellers on the Internet. Two of the other FSU educational Web sites, Molecular Expressions [45] and Nikon’s MicroscopyU [48], also contain extensive information on confocal microscopy, including review articles, interactive tutorials, digital image galleries and streaming videos of time-lapse image sequences. The following discussion focuses primarily on these three Web sites with references to individual sections.
The broad range of applications available to laser scanning confocal microscopy and discussed on the Olympus FluoView Web site includes a wide variety of studies in neuroanatomy and neurophysiology, as well as morphological studies of a wide spectrum of cells and tissues. In addition, the growing use of new fluorescent proteins is rapidly expanding the number of original research reports coupling these useful tools to modern microscopic investigations. Other applications include fluorescence resonance energy transfer, stem cell research, photobleaching studies, lifetime imaging, multiphoton microscopy, total internal reflection, DNA hybridization, membrane and ion probes, bioluminescent proteins, and epitope tagging. Many of these powerful techniques are described in detail on the Web site while others are the subject of interactive tutorials. A series of specific review articles [57] focuses on a variety of relevant topics, including the colocalization of fluorophores, fluorescent proteins, optical highlighters, epitope tagging, stem cells, resonance energy transfer and photobleaching techniques (FRET and FRAP), multiphoton microscopy, total internal reflection (TIRFM), and in situ hybridization (FISH). The Web site also includes numerous image galleries and links to related resources on the Internet. The hyperlinked resources include manufacturers and distributors of fluorescent filters, digital cameras, antibodies, fluorescent protein vector sources, lasers, specimen chambers, photometric detectors, live-cell imaging supplies, courses and workshops on microscopy, and software for three-dimensional volume rendering.
One of the hallmark interactive tutorials on the FluoView Web site, a Java-powered laser scanning confocal microscope simulator [58], is illustrated in Fig. 2. This tutorial explores multi-laser fluorescence scanning confocal imaging coupled to transmitted DIC with the Olympus FluoView FV1000 microscope software interface as a model. Using a series of selectable prerecorded image stacks for specimens, the tutorial initializes with a randomly selected stack being scanned along the lateral x–y plane at a modest speed of 20 microseconds per pixel, and the detector channels being set very close to the optimum values with simultaneous scanning in all three channels. Imaging depth in the axial (z) direction is adjusted with the z-axis position slider (see Fig. 2) according to a range determined by the thickness of each specimen. Upon initialization, each channel corresponding to a fluorophore present in the specimen is activated and labeled with the specific probe being imaged. The transmitted light channel (TD) is turned off by default. Lasers are preassigned (and fixed) to the channels according to the following order: argon-ion (488 nm)—Channel 1; green helium–neon (543 nm)—Channel 2; and red helium–neon (633 nm)—Channel 3. The TD channel produces transmitted light differential interference contrast images using the argon-ion laser set at 488 nm.

Fig. 2
Laser Scanning Confocal Microscope Simulator interactive tutorial based on the software interface of the Olympus FluoView FV1000 microscope. Specimens in the tutorial were acquired as optical stacks with the FV1000, and image parameters, including intensity, bleed-through, and noise levels, are based on the fluorophore emission spectral profiles. The tutorial is also equipped with a “Help” feature that enables the visitor to right-click on an object in the interface, such as a button, slider, or pull-down menu, to launch a pop-up that describes the function of that control
Visitors are able to interact with the confocal microscope simulator tutorial by adjusting the voltage, gain, and offset values for each channel and immediately see the effect on the image. In addition, similar to the actual software, the tutorial is equipped with an automatic photomultiplier high voltage (Auto HV) control that maintains a constant signal level while increasing or decreasing the microscope scan speed. The individual laser intensities are also controllable (through a range of 0–100 %) with sliders and arrow buttons adjacent to each laser activation checkbox (identical with the actual software). Additional features that simulate the microscope software and add a realistic “feel” to the tutorial are the Auto Contrast control for a software best-guess initial setting of the detector channel levels (typically utilized for pre-scanning a specimen), a look-up table for adjustment of the gamma, intensity, contrast, and pseudocolor for each channel, as well as simulation of rapid specimen scanning.
In order to simulate image acquisition of specimens having strongly overlapping fluorophore emission spectra using the spectral imaging detector channels, the confocal simulator tutorial is equipped with a dialog box illustrating the emission spectra of the selected fluorophores superimposed over the detector slit settings for channels 1 and 2 (the spectral imaging channels). In a manner similar to the microscope software, the tutorial allows users to observe the effects of altering slit size and wavelength range while the simulator is scanning a specimen in order to demonstrate in real-time how increasing or decreasing these variables affects specimen contrast, intensity, and spectral bleed-through. A unique feature of this tutorial is that simulation of bleed-through is based on the degree of overlap between actual fluorophore emission spectral profiles. In our laboratory, students and entry-level technicians are first trained using the confocal microscope simulator software, and must display a minimum level of understanding and expertise before they are deemed qualified to operate the actual microscope.
3.2 Confocal Microscopy: Laser Scanning Systems and Modes Tutorials
Fundamental to a basic understanding of laser scanning confocal microscopy is a working knowledge of the scanning system and the types of modes available to examine specimens and record images in three dimensions. The three basic requirements of a laser scanning confocal microscope system are to bring the laser illumination to a focal point on the specimen, scan a selected area of the surface in a raster pattern, and then gather only the secondary fluorescence that originates from the immediate region being excited by the focused laser beam. During scanning, the focal point size should exhibit even illumination and be maintained as small as possible, two requirements that necessitate the objective rear aperture being completely filled with light throughout the scanning cycle. The interactive tutorial illustrated in Fig. 3a examines how the galvanometer-driven mirrors and optical system of a typical confocal microscope are configured to enable the objective rear aperture to be continuously filled with light during the raster scanning operation [59].

Fig. 3
Interactive Java tutorials describing the basic optical configuration of a typical laser scanning system (a) and the most common scanning modes available on commercial instruments (b). The scanning system configuration presented in (a) features a single galvanometer mirror, scanning lens, tube lens, and uses a single lens element to represent the objective rear aperture. A virtual laser beam incident on the galvanometer is scanned across the specimen surface (only the x-direction is shown in the tutorial). Scanning modes (b) are grouped into single line scanning, two-dimensional (2D), and three-dimensional (3D) categories that can be enabled using the appropriate radio button
The wide range of laser scanning modes available in the control software of most commercial confocal microscopes (see Fig. 3) enables investigators to fine-tune acquisition strategies in order to optimize data collection for three-dimensional imaging, time-lapse analysis, and a host of other specialized applications. Among the common scanning modes featured by most commercial microscopes are point, line, free line, parallel plane, and rectangle scanning over one or more dimensions. The interactive tutorial presented in Fig. 3b reviews various scanning mechanisms in confocal microscopy utilizing a cube-shaped virtual specimen [60].
One of the primary advantages of confocal microscopy is the ability to gather a stack of multiple images from relatively thick specimens through optical sectioning across a selected volume. Traditionally, serial sections are collected by raster scanning the x-y lateral dimensions in selected increments along the microscope optical (z) axis to produce a digital rendition of the specimen volume (3D scanning, x-y-z-t; Fig. 3b). However, in modern commercial instruments, scanning modes are extremely versatile and serial optical sections can also be collected diagonally in horizontal (Rectangular-z-t scanning mode; Fig. 3b) planes or vertically in single slices (x-z-t and y-z-t; 2D scanning in Fig. 3b) to produce profile views of the specimen. Point scanning (not illustrated in the tutorial) allows the instrument to collect data from a single point at any location within the scanning range of the specimen volume. In practice, point scanning enables rapid collection of data that can be utilized to monitor fluorescence emission intensity changes in dynamic settings, such as localized ion concentration investigations in living cells. Line scanning along the x, y, or z axis, or diagonally between axes, provides intensity information across a single set of coordinates in the lateral or axial dimension. This scanning mode is useful for obtaining accurate quantitative information about rapid physiological events, such as calcium waves or sparks. The free line scanning mechanism, available in some commercial configurations, can be used to gather intensity changes over a period of time along the length of a freely drawn line, such as the trace of a neural axon or across a cellular junction.
3.3 Confocal Microscopy: Laser Tutorials
The laser systems commonly employed in point-scanning confocal microscopy are high-intensity monochromatic light sources, emitting one or more spectral lines, which are useful as tools for a variety of techniques including optical trapping, lifetime imaging studies, spinning disk systems, photobleaching recovery, photoactivation and photoconversion, as well as total internal reflection fluorescence [61]. Many of the common lasers used in confocal microscopy are the subject of review articles and interactive tutorials on the Olympus FluoView Resource Center Web site [43, 62]. Among the lasers reviewed on the site are the traditional argon-ion, helium–cadmium, helium–neon, krypton–argon, and the newer diode lasers.
As a distinguished and heavily utilized member of the common and well-explored family of ion lasers, the argon-ion laser [63] operates in the visible and ultraviolet spectral regions by utilizing an ionized species of the noble gas argon. Argon-ion lasers function in continuous wave mode when plasma electrons within the gaseous discharge collide with the excited laser species to produce light. The argon-ion laser is capable of producing approximately 10 wavelengths in the ultraviolet region and up to 25 in the visible region, ranging from 275 to 363.8 nm and 408.9 to 686.1 nm, respectively (see Fig. 4a). In the visible light spectral region, the lasers can produce up to 100 W of continuous-wave power with the output concentrated into several strong lines (primarily the 488 and 514.5 nm transitions). The gain bandwidth on each transition is on the order of 2.5 GHz. Argon-ion gas laser discharge tubes have a useful life span ranging between 2,000 and 5,000 h, and operate at gas pressures of approximately 0.1 Torr.

Fig. 4
Animated laser interactive Java tutorials describing the internal anatomy and laser cavity of the two most common lasers used in confocal microscopy. (a) Argon-ion gas laser emitting five spectral lines (351, 364, 457, 488, and 514 nm). (b) Helium–neon gas laser also emitting five spectral lines (543, 594, 612, 633, and 1,523 nm). The tutorials are both controlled with wavelength and speed sliders
An unfortunate side effect of the high discharge currents and low gas pressure employed by argon-ion lasers is an extremely high plasma electron temperature, which generates a significant amount of heat. In most cases, high power (2 to 100 W) argon-ion laser systems are water-cooled through an external chiller, but lower power (5–150 mW) models can be cooled with forced air through an efficient fan. Argon-ion lasers utilized in confocal and other fluorescence microscopy techniques are generally of the lower power variety, which produce between 10 and 100 mW of power in TEM(00) mode at 488.0 nm. The laser cavity for these smaller systems is approximately 35–50 cm in length and about 15 cm in diameter, and can be housed in a small cabinet with an integral fan to supply fresh, cool air.
Helium–neon lasers (Fig. 4b) are among the most widely utilized laser systems for a broad range of biomedical and industrial applications, and display a superior Gaussian beam quality that is virtually unrivaled by any laser [64]. These lasers are readily available at relatively low cost, have compact size dimensions, and exhibit a long operating life (often reaching 40,000–50,000 h). The low power requirements, superior beam quality (virtually a pure Gaussian profile), and simple cooling requirements (convection) make helium–neon lasers the choice system for many confocal microscopes. In the past, the application of helium–neon lasers in confocal microscopy was somewhat hampered by the relatively low intensity and red emission wavelength. This difficulty has been overcome in part by the development of new lasers having additional spectral lines. The emission at 633 nm (termed the He-Ne line) of the common helium–neon laser has been supplemented by development of variants having emissions in the green (543 nm), yellow (594 nm), orange (612 nm), and near infrared (1,523 nm) spectral regions. Typical power output values for the 633 nm red spectral line range from 0.5 to 10 mW up to a maximum of about 75 mW. The introduction of semiconductor and diode lasers having spectral lines in similar wavelength regions may ultimately lead to a reduction in the use of helium–neon lasers for confocal microscopy.
3.4 Confocal Microscopy: Photomultiplier Tutorials
In modern wide-field fluorescence and laser scanning confocal optical microscopy, the collection and measurement of secondary emission gathered by the objective can be accomplished by several classes of photosensitive detectors, including photomultipliers, photodiodes, and solid-state charge-coupled devices (CCDs). In confocal microscopy, fluorescence emission is directed through a pinhole aperture positioned near the image plane to exclude light from fluorescent structures located away from the objective focal plane, thus reducing the amount of light available for image formation. As a result, the exceedingly low light levels most often encountered in confocal microscopy necessitate the use of highly sensitive photon detectors that do not require spatial discrimination, but instead respond very quickly with a high level of sensitivity to a continuous flux of varying light intensity [65].
Photomultipliers, which contain a photosensitive surface that captures incident photons and produces a stream of photoelectrons to generate an amplified electric charge, are the popular detector choice in many commercial confocal microscopes. These detectors contain a critical element, termed a photocathode, capable of emitting electrons through the photoelectric effect (the energy of an absorbed photon is transferred to an electron) when exposed to a photon flux. The general anatomy of a photomultiplier consists of a classical vacuum tube [66] in which a glass or quartz window encases the photocathode and a chain of electron multipliers, known as dynodes, followed by an anode to complete the electrical circuit. When the photomultiplier is operating, current flowing between the anode and ground (zero potential) is directly proportional to the photoelectron flux generated by the photocathode when it is exposed to incident photon radiation.
In laser scanning confocal microscopy, the specimen is scanned in a raster pattern by the focused illumination beam, and the resulting fluorescence emission forms a point image that is sequentially detected by a photomultiplier. Most commercial confocal microscopes feature photomultipliers that are limited in dynamic range to 8 bits or 256 gray levels with a wavelength-dependent detection efficiency ranging between 15 and 30 %. Compared to cooled CCD cameras, which typically feature a 10 to 14-bit dynamic range scale and 40–60 % detection efficiency over a wide wavelength range, photomultiplier performance is significantly less. However, in a majority of confocal applications (especially live-cell imaging; 67) fewer than 255 photons per pixel are ever collected, well within the dynamic range of the photomultiplier tube. Furthermore, the excellent linearity of the photomultiplier response and background noise rejection properties renders this detector ideal for confocal microscope applications.
In the side-on photomultiplier tube design, photons impact an internal photocathode and eject electrons from the front face (as opposed to the rear side as in the end-on designs). These ejected photoelectrons have trajectories angled at the first dynode, which in turn emits a larger quantity of electrons angled at the second dynode (and so on). Incident light is detected through the curved side of the envelope in side-on photomultipliers [68]. Due to their high performance ratings and relatively low cost, side-on photomultiplier designs are the most widely used tubes for general photometric applications, such as spectrophotometry, fluorimetry, and laser scanning confocal microscopy.
Channel photomultipliers represent a new head-on monolithic design that incorporates a unique detector having a semitransparent photocathode deposited onto the inner surface of the entrance window. The photomultiplier features similar functionality to conventional units, but with dramatically increased sensitivity and high quantum efficiency. Individual photoelectrons released by the photocathode enter a narrow and curved semiconductive channel that serves in place of the traditional dynode chain. Each time an electron impacts an inner wall of the channel, multiple secondary electrons are emitted. The interactive tutorial presented in Fig. 5b explores how electrons are multiplied within the conductive chain of a channel photomultiplier [69].

Fig. 5
Animated interactive Java tutorials describing and illustrating the internal anatomy of a side-on (a) and channel (b) photomultiplier. The tutorials depict cut-away drawings of the photomultiplier tubes with virtual photons, represented by yellow arrows, incident on the photocathodes to produce photoelectrons (blue spheres ). Operation of the tutorial includes a gain slider to increase or decrease the number of electrons created each time an electron collides with the channel, and the tutorial speed slider to regulate the speed of the electrons passing through the photomultiplier. The tutorial can be halted at any point by clicking on the stop button (Color figure online)
3.5 Confocal Microscopy: Fluorophore Colocalization Tutorials
Two or more fluorescence emission signals can often overlap in digital images recorded by confocal microscopy due to their close proximity within the specimen. This effect is known as colocalization and usually occurs when fluorescently labeled molecules bind to targets that lie in very close or identical spatial positions. Colocalization is an important concept that students must learn to differentiate from spectral bleed-through. The interactive tutorial described in Fig. 6 explores the quantitative analysis of colocalization in a wide spectrum of specimens [70] that were specifically designed either to demonstrate the phenomenon, or to alternatively provide examples of fluorophore targets that lack any significant degree of colocalization.

Fig. 6
Colocalization scatterplot analysis interactive tutorial of multiply stained specimens in confocal microscopy. The specimen data collected with the microscope is presented in the specimen image window, while the corresponding scatterplot is graphed in the neighboring window. Plots of the available channel permutations (Red–Green, Red–Blue, and Green–Blue) can be displayed using the Colocalization Channels set of radio buttons. In addition, each channel in the Specimen Image window can be toggled on or off using the checkboxes in the Channels menu. A three-dimensional rendering of the colocalization scatterplot (number of pixels plotted on the z axis) can be obtained by activating the 3D radio button. This view can be rotated within the window using the mouse cursor. Colocalization coefficients automatically displayed beneath the scatterplot graph include Pearson’s, Overlap, and Global (k1 and k2), as described on the Web site [70]
Colocalization, in a biological manifestation, is defined by the presence of two or more different molecules residing at the same physical location in a specimen [71, 72]. Within the context of a tissue section, individual cell, or subcellular organelle viewed in the microscope, colocalization may indicate that the molecules are attached to the same receptor, while in the context of digital imaging, the term refers to colors emitted by fluorescent molecules sharing the same pixel in the image. In confocal microscopy, specimens are recorded as a digital image composed of a multi-dimensional array containing many volume elements termed voxels that represent three-dimensional pixels. The size of a voxel (or detection volume) is determined by the numerical aperture of the objective and the illumination wavelength (which are combined to determine the lateral resolution), as well as the confocal detector pinhole diameter (z-axis resolution). Thus, the colocalization of two fluorescent probes in a specimen, such as Alexa Fluor 488 having green emission and Cy3 with orange-red emission, is represented in the image [73] by pixels containing both red and green color contributions (often producing various shades of orange and yellow).
It is important to note that colocalization does not refer to the likelihood that fluorophores with similar emission spectra will appear in the same pixel set in the composite image. Accurate colocalization analysis is only possible if the fluorescence emission spectra are sufficiently well separated between fluorophores and the correct filter sets (or spectral slit widths) are used during the acquisition sequence. If spectral bleed-through artifacts are present because of a high degree of spectral overlap between the fluorophore emission spectra, or due to the use of incorrect filter combinations or scanning configuration, colocalization measurements will be meaningless. To avoid artifacts, the fluorophores must be carefully matched to the power spectrum of the illumination source (laser lines in confocal microscopy) to obtain the maximum excitation efficiency while still maintaining a useful degree of separation between emission wavelengths. In most cases, the judicious choice of fluorophores for colocalization analysis is paramount in obtaining satisfactory results.
3.6 Confocal Microscopy: Spectral Bleed-Through Tutorials
Bleed-through (often termed crossover or crosstalk) of fluorescence emission, due to the very broad bandwidths and asymmetrical spectral profiles exhibited by many of the common fluorophores, is a fundamental problem that must be addressed in both wide-field and laser scanning confocal fluorescence microscopy. The phenomenon is usually manifested by the emission of one fluorophore being detected in the photomultiplier channel or through the filter combination reserved for a second fluorophore. Bleed-through artifacts often complicate the interpretation of experimental results, particularly if subcellular colocalization of fluorophores is under investigation or quantitative measurements are necessary, such as in resonance energy transfer (FRET) and photobleaching (FRAP) studies. Identification of bleed-through artifacts and their differentiation from colocalization is the subject of several interactive tutorials and review articles on the Olympus FluoView Resource Center Web site [70, 74–76].
The interactive tutorial illustrated in Fig. 7 explores spectral bleed-through [76] in laser scanning confocal microscopy and the mechanisms available to reduce or eliminate the artifact. Fluorescence emission from the specimen is displayed in each of three separate photomultiplier detection channels, labeled Ch1, Ch2, and Ch3, which are positioned in adjacent windows above the tutorial control panel. Upon initialization, the laser output power settings are set to levels that normally exhibit a significant amount of spectral bleed-through from one channel to the next when imaging adequately labeled specimens in order to clearly demonstrate the manifestations to beginning students. The primary exercise of this tutorial is designed to provide instruction and practice on how to control bleed-through by proper adjustment of the laser power, photomultiplier voltage and gain, and the detector entrance slit bandwidths (in spectral imaging instruments) or fluorescence emission barrier filter (Channel 3 in the tutorial) wavelength profile.

Fig. 7
Interactive Java tutorial designed to demonstrate spectral bleed-through with triple-labeled specimens in confocal microscopy. The tutorial features a similar control panel motif to the confocal microscope simulator tutorial [58], except that each channel is provided with a separate image window to more clearly demonstrate bleed-through artifacts from one channel into another. The sequential scan checkbox, which is not activated by default, can be used to demonstrate the presence and absence of bleed-through
In order to operate the tutorial, users can employ the HV, Gain, and Offset sliders for each channel to adjust the signal level and quality by clicking on the arrow buttons at the top and bottom, or anywhere inside the indicator boxes (each containing a gray level bar; see Fig. 7). When the channel voltage, gain, and offset values are changed, the level bar is automatically adjusted to show the new value, which is also indicated numerically beneath the indicator box. These values can also be adjusted proportionally, by clicking on the Auto HV button, in order to maintain constant signal levels when increasing or decreasing the scan speed. Laser intensity values for the individual illumination sources can be controlled (through a range of zero to 100 %) with the sliders and arrow buttons adjacent to each laser activation checkbox. The lasers can also be toggled on or off using the appropriate checkbox.
The best fluorophores for confocal or wide-field fluorescence microscopy have absorption maxima that closely match the laser or arc-discharge spectral lines utilized to excite the probe. Choosing fluorophores with the highest quantum yields for the least abundant targets will assist in balancing overall fluorescence emission. In addition, probes with narrow emission spectra may dramatically reduce the problem of bleed-through, but will not eliminate it altogether. The optical filter sets chosen to examine fluorophore emission should be closely matched to the spectral profiles of the probe with regards to bandwidth size and location. Also, interference filter blocking levels often vary by manufacturer and should be checked.
Additional interactive tutorials on the Olympus FluoView Web site relating to bleed-through when imaging synthetic fluorophores and fluorescent proteins include an analysis [77] of fluorescent probe excitation efficiency as a function of laser wavelength (tutorial not illustrated) and a discussion of choosing fluorophore combinations for confocal microscopy (see Fig. 8). The fluorophore excitation efficiency tutorial examines why the absorption and fluorescence emission spectral profiles of a fluorophore are two of the most important criteria that must be scrutinized when selecting probes. In addition to the wavelength range of the absorption and emission bands, the molar extinction coefficient for absorption and the quantum yield for fluorescence emission should be considered. At laser excitation levels that do not saturate the fluorophore, fluorescence intensity is directly proportional to the product of the extinction coefficient and the quantum yield. This interactive tutorial examines how these relationships can be utilized to match fluorophores with specific lasers for confocal microscopy.

 Confocal Imaging of Butterfly Tissue
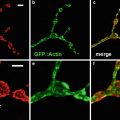 Confocal Imaging of Fluorescently Labeled Proteins in the Drosophila Larval Neuromuscular Junction
 Vital Imaging of Multicellular Spheroids
 Imaging Tools for Analysis of the Ureteric Tree in the Developing Mouse Kidney
 Evaluating Confocal Microscopy System Performance
 Laser Scanning Confocal Microscopy: History, Applications, and Related Optical Sectioning Techniques


Related posts:
Confocal Imaging of Butterfly Tissue
Confocal Imaging of Fluorescently Labeled Proteins in the Drosophila Larval Neuromuscular Junction
Vital Imaging of Multicellular Spheroids
Imaging Tools for Analysis of the Ureteric Tree in the Developing Mouse Kidney
Evaluating Confocal Microscopy System Performance
Laser Scanning Confocal Microscopy: History, Applications, and Related Optical Sectioning Techniques
Stay updated, free articles. Join our Telegram channel
Full access? Get Clinical Tree
