Fig. 5.1
Phased array or microconvex transducer, a low frequency (1–5 MHz) probe with small footprint. These transducers tend to be more compact allowing easier imaging and maneuverability within the intercostal space
The heart can be visualized in various modes depending on the point of interest. In B-mode or brightness mode, the structures are displayed in 2-dimensional (2D) images. This mode is better for anatomical evaluation and helps intensivists to have a visual assessment of the global ventricular function and valve integrity in the acute setting. The ‘M-mode’ or motion mode displays images over a time on a single plane when a scan line is placed over the structures of interest. This mode is better for assessing the movements and excursion of structures such as the free ventricular wall or valve leaflets.
Doppler techniques are useful in assessing valve integrity and also for calculation of velocity-time integral (VTI) and cardiac output measurements. Doppler ultrasound measures the frequency of returning echoes that are reflected from a moving object. The Doppler effect is the increase in sound frequency as a sound source moves toward the observer and the decrease in sound frequency as the source moves away (similar to sirens from an ambulance). For cardiac imaging, the red blood cell is the target [4]. Doppler shift is the change in frequency between the sound transmitted from the transducer and the sound reflected back from the moving objects (static objects do not cause frequency shifts). Once the frequency of the reflected wave is identified, the known frequency of the transmitted wave can be used to calculate the velocity of the moving object (Box 5.1). When using Doppler, it is important to emphasize that the ultrasound beam of interrogation should be as close to parallel (cosine 0 = 1) or within 20° to the direction of red blood cell flow in order to obtain accurate velocities. As the angle Θ increases, the corresponding cosine becomes progressively less than one, resulting in underestimation of the Doppler shift. Note that the cosine of 90° is zero; hence, no Doppler shift would occur if interrogating at an angle that is perpendicular to flow.
Box 5.1. Doppler Velocity
In the above equation, V is the blood flow velocity, c is the speed of sound in blood (1,540 m/s), 2 is a correctional factor for transit time of the ultrasound wave, and Θ is the angle of intercept of the ultrasound beam. F T is the ultrasound frequency that the transmitter emits and F S is the backscattered frequency that returns to the transducer. Note that the cosine of 90° is 0; hence, no Doppler shift would occur if the ultrasound beam is perpendicular to flow. Any angle higher than 20° would lead to underestimation of velocities and inaccurate calculation of hemodynamic parameters.
With pulsed-wave Doppler (PWD), flow velocities are measured in one specific location or a small sample volume. The transducer sends out a pulsed signal to a depth chosen by the operator and listens for the reflected frequency shift from that depth, allowing the computer to calculate the velocity. A single crystal sends and receives ultrasound beams. The ultrasound is reflected from moving red blood cells and is received by the same crystal. The pulse repetition frequency (PRF) is the frequency at which the crystal emits a short burst of sound waves. Since the same crystal receives the ultrasound wave, the maximal frequency shift that can be determined by PWD is one-half the PRF, or the Nyquist limit. PWD measures flow velocities at a specific location, within a sample volume. A limitation of PWD is that velocities higher than the Nyquist limit cannot be measured due to aliasing. Aliasing in a phenomenon that results in red blood cells (RBCs) appearing to be moving in a direction opposite to their actual direction. In other words, if the RBCs within a sample volume are moving at a velocity that is greater than half the PRF, aliasing will occur, where flow will appear to be going in the opposite direction and Doppler signals are recorded on opposite sides of the baseline. Continuous wave Doppler (CWD), on the other hand, allows the measurement of velocities along an entire line of interrogation. The transducer uses two crystals in this modality; one continuously transmits pulses at a very high frequency, while a separate crystal continuously is able to receive returning echoes. Although CWD is not able to identify the exact site of highest frequency shift or velocity along its line of interrogations, it is not limited in its ability to measure high velocity RBCs like when using PWD.
Color flow Doppler (CFD) is frequently utilized in the ICU to evaluate for major valvular failure. Color Doppler is a form of PWD but with multiple sample volumes over an area. CFD samples multiple sites using multiple ultrasound beams (multigated) and displays intracardiac blood flow direction and velocity using colors. CFD converts the frequency shift at each sampled site to a preset color scheme and superimposes these colors onto 2D imaging. The higher the velocity, the brighter the color, and the direction of flow is set by the operator, traditionally set as red (flow toward transducer), blue (away from transducer), and green (mix of directions or turbulent flow). The width and size of abnormal intracavitary flows are used to quantify degree of valvular regurgitation [4].
Basic Anatomy
It is important to have an understanding of the orientation of the various cardiac chambers in relation to one other and to know the direction of blood flow, especially when using Doppler measurements. The atria act as receiving chambers and a conduit to the ventricles, which pump blood to the pulmonary and systemic circulation. The left atrium (LA) is the posterior-most cardiac chamber and has thicker walls compared to the right atrium (RA). The left ventricle (LV) is situated posterior to right ventricle (RV) and has thicker walls compared to the RV. The two ventricles are separated by the interventricular septum. The LV outflow tract (LVOT) consists of the anterior mitral valve leaflet and the LV free wall up to the aortic valve (AV) (Fig. 5.2). The LVOT directs blood from the LV toward the AV superiorly and rightward.
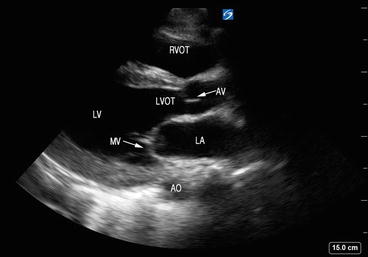
Fig. 5.2
Structures seen via the parasternal long-axis view (PLAX). The LVOT consists of the anterior mitral valve leaflet and the LV free wall up to the AV. LA left atrium, MV mitral valve, LV left ventricle, LVOT left ventricular outflow tract, RVOT right ventricular outflow tract, AO aorta, AV aortic valve
The atrioventricular valves are located between atrium and ventricle and consist of the annulus fibrosis, valvular leaflets, chordae tendineae, and papillary muscles. The valves are surrounded by dense fibrous tissue forming a partial or complete ring or annulus, which helps anchor and support the valve. In general, the function of the valves will be affected by impairment of any of the components of the valvular apparatus or the ventricular wall. The mitral valve (MV) resides in the left atrioventricular groove and has two leaflets: anterior leaflet, which is located closest from the aorta, and posterior leaflet, which is contiguous with the posterolateral LV wall (Fig. 5.3). The anterior and posterior leaflets connect at the anterolateral and the posteromedial commissures (Fig. 5.4). There are two distinct papillary muscles that are attached to the LV: anterolateral and posteromedial (Fig. 5.5). The chordae tendineae connect the papillary muscle to the mitral annulus and leaflet. The anterolateral papillary muscle has dual blood supply from the left anterior descending artery, whereas the posteromedial papillary muscle has single blood supply by the posterior descending branch of the right coronary artery and is more prone to infarction during myocardial ischemia, leading to severe valvular failure. The tricuspid valve (TV) is located between the RA and RV and has three leaflets: anterior, posterior, and septal. On the ventricular side of the tricuspid valve leaflets, the chordae tendineae are connected to three papillary muscles in the right ventricle.
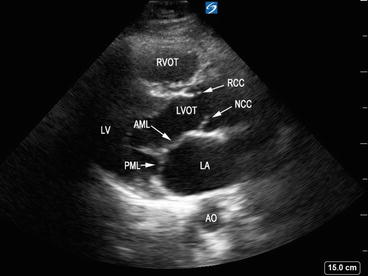
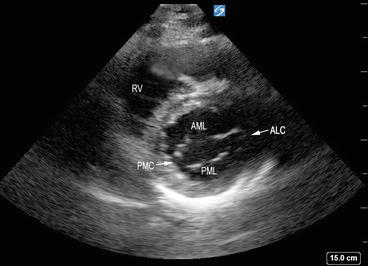
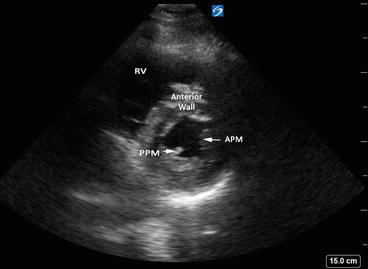
Fig. 5.3
Parasternal long-axis view showing mitral valve leaflets. AML anterior mitral leaflet, PML posterior mitral leaflet, LA left atrium, LV left ventricle, LVOT left ventricular outflow tract, RVOT right ventricular outflow tract, AO aorta, RCC right coronary cusp, NCC noncoronary cusp
Fig. 5.4
Parasternal short axis view demonstrating anterior and posterior mitral leaflets joining at the anterolateral and the posteromedial commissures. AML anterior mitral leaflet, PML posterior mitral leaflet, anterolateral and posteromedial commissures (ALC and PMC, respectively), RV right ventricle
Fig. 5.5
Parasternal short axis – midpapillary view showing anterolateral and posteromedial papillary muscles. APM anterolateral papillary muscle, PPM posteromedial papillary muscles, RV right ventricle
The aortic and pulmonic valves or the semilunar valves are smaller in size compared to the atrioventricular valves. Named semilunar valves after their three crescent-shaped cusps, they are situated between the ventricle and great vessels and consist of three leaflets supported by an annulus. The AV separates the LVOT from the ascending aorta and has three leaflets or cusps: the left coronary cusp, the right coronary cusp (named after the respective sinuses of Valsalva which give rise to the main coronary arteries), and the posterior or noncoronary cusp (Fig. 5.6). They are composed of collagenous fibers that anchor into the media of the aorta and provide structural support of valvular structures, transmitting stress on the valve cusps on to the aortic wall. The AV commissures are the small spaces between each cusp’s attachment-point. The sinotubular junction is at the level of attachment of the cusps to the wall of the aorta. The pulmonic valve divides the right ventricular outflow tract (RVOT) from the pulmonary artery and is located anterior, superior, and to the left of the aortic valve. It has three cusps, which are defined by their relationship to the AV and are thus termed anterior or nonseptal, right, and left cusps. In contrast to the AV valve, the cusps of the pulmonic valve are supported by freestanding musculature with no direct relationship with the muscular septum; its cusps are much thinner and lack a fibrous continuity with the anterior leaflet of the tricuspid valve.
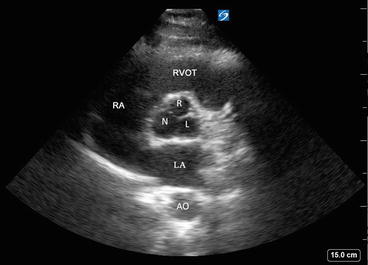
Fig. 5.6
Parasternal short axis view of the aortic valve showing aortic leaflets or cusps (right (R), left (L), and noncoronary (N)). RVOT right ventricular outflow tract, RA right atrium, LA left atrium, AO aorta
Cardiac Physiologic Concepts
Systole is the segment of the cardiac cycle from the closure of the MV to AV closure, and the onset of systole is coincident with the onset of the QRS complex or ventricular depolarization on electrocardiogram (EKG). It ends with ventricular repolarization, which occurs at the end of the T wave. During systole the myocardial fibers contract circumferentially and longitudinally, causing inward motion of the endocardium and myocardial wall thickening resulting in ejection of blood to the aorta and pulmonary artery. The “true” measure of LV function is best defined by contractility, or the ability of the heart to perform work under different loading conditions. This ability to eject blood to deliver sufficient oxygen to tissues is the essential function of the heart (Box 5.2). Ventricular systolic function depends on contractility, preload (initial ventricular pressure), afterload (resistance offered by great vessels and end systolic wall stress), and ventricular geometry [5].
Box 5.2. Definitions
Cardiac output (CO): volume of blood pumped by left ventricle in one minute. Average in males 5.6 L/min, female 4.9 L/min
Stroke volume (SV): amount of blood pumped by the left ventricle with one cardiac cycle
SV = end diastolic volume (EDV) − end systolic volume (ESV)
Ejection fraction (EF): fraction of blood ejected by the left ventricle (LV) during the ejection phase of the cardiac cycle or systole; expressed in percentage
EF = (SV/EDV) × 100
CO = stroke volume (SV) × heart rate (HR)
Cardiac index (CI) = CO/body surface area (BSA)
Unfortunately, contractility cannot be assessed at a single point in time because it would require the plotting of measured blood volumes ejected at a range of filling pressures (i.e., various loading conditions or volume states), an impractical feat outside of experimental conditions. This is often forgotten in clinical practice, where we instead are forced to measure and record LV systolic performance under a specific set of loading conditions at a single point in time during a specific stage in critical illness or recovery. In a dynamic setting, such as in the ICU or emergency department, the “contractile function,” most often denoted by “ejection fraction” (EF) may change (i.e., after volume resuscitation, initiation of medications that can reduce the afterload, use of balloon pumps or ventricular assist devices). Thus, interplay of multiple factors influences the measured EF by affecting both preload and afterload conditions. These include use of vasopressors, coexistent valve dysfunction, volume status, and presence of myocardial insults such as sepsis, ischemia, stress, and inflammation. Such changes in function can occur within hours or days in the ICU, a fact increasingly recognized by intensivists and often underappreciated in the traditional echocardiography lab, where exams are infrequently repeated and often done under a similar set of stable, resting, and loading conditions.
Image Acquisition and Interpretation
With adequate training in CCE, intensivists can assess global and regional ventricular function, as well as qualitative and quantitative valvular function. In a recent statement, the American Society of Echocardiography (ASE) identified the role of a focused cardiovascular examination to be based on a predefined image acquisition and interpretation protocol to facilitate initial management in critically ill patients [6]. Acquisition of optimal images requires a good understanding of the options available on the ultrasound machine (gain, depth, zoom, etc.) and subtle transducer manipulations (Box 5.3). A constant orientation to the various planes in which the sound waves traverse and dissect the cardiac structures is important (Fig. 5.7). In general, a systematic approach should be taken with regard to the echocardiographic exam. Once the patient position is optimized and the best ultrasonographic window found, the gain and depth should always be optimized. Always keep the structure of interest in the center of the screen. Subsequently, images should be acquired in a goal-directed, systematic fashion each time, with evaluation of each view to look for ventricular dysfunction and valvular abnormalities.
Fig. 5.7
Basic echocardiographic views and corresponding planes. Image courtesy of Guy Aristide, MD
Box 5.3. Terminologies related to transducer handling
Move: Transducer is shifted across the thoracic wall to a different position.
Tilt: Transducer is gently pointed along the same tomographic plane with a rocking motion.
Angle: Transducer is angulated to obtain a different tomographic plane
Rotate: The tip is rotated at the same position to obtain an intersecting tomographic plane.
Images should be acquired using a phased array probe. A “cardiac” exam preset should be selected if using a portable ultrasound machine rather than a dedicated echocardiography machine. This ensures that the machine uses a high frame rate since the heart is a rapidly moving organ. By convention, the screen marker is at the upper right-hand corner of the screen. The ASE recommends that the probe marker should in general point in the direction of either the patients’ head or left side [7]. An electrocardiogram (EKG) should be placed on the patient, if specific portions of the cardiac cycle are being interrogated (i.e., systole vs. diastole), however this is not an essential requirement for goal-directed echocardiography. On the monitor, structures closest to the transducer appear on the top or near field and deep structures appear on the bottom of the screen or far field. When color Doppler is used, the color gain should be increased to the point that it just begins to create background noise and then decreased to the level that optimizes color flow imaging of blood flow. The size of the color flow sector should be optimized as well because the frame rate for color flow imaging is inversely proportional to the area of imaging [4].
Patient Positioning and Standard Views
Positioning is often limited in the ICU patient due to the myriad of equipment such as drips, monitors, EKG leads, indwelling catheters, and devices, leading to suboptimal imaging. Critically ill patients may also not always have good acoustic windows, especially those who are mechanically ventilated, have advanced chronic obstructive pulmonary disease (COPD), chest trauma, or are severely obese. Hence whenever possible, positioning of the patient in the bed should be optimized in order to maximize the chances of the best image quality. A good working knowledge of the positioning and orientation of the transducer for each view is also of paramount importance. The transducer should be held like a pencil and stabilized by placing the ultrasonographer’s hypothenar eminence on the patient, so as to obtain a steady image of the structure of interest (Fig. 5.8). Adequate pressure should be applied to the transducer and lubricant gel should be used to obtain good images.
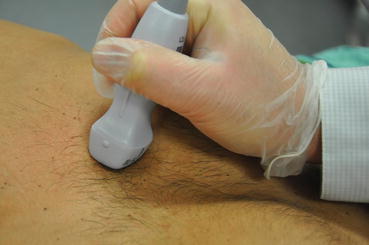
Fig. 5.8
Transducer holding technique. Note the transducer probe is stabilized by placing the ultrasonographer’s hypothenar eminence on the patient
Critically ill patients are generally examined in the supine position. Since a portion of the heart is located behind the sternum, patients can be turned to the left lateral position, with the left arm abducted in order to widen the intercostal space and move the heart away from the sternum. This is particularly useful for obtaining good parasternal and apical views. Since critically ill patients often cannot move on their own, using pillows or soft wedges to obtain a lateral decubitus position helps optimize the desired view. For the subcostal view, the patient should be supine; bending the legs at the knees helps decrease abdominal wall tension and improves visualization.
With basic CCE, there are five different views that are commonly used: parasternal long axis, parasternal short axis, apical four chamber, apical five chamber, and subcostal (Fig. 5.7). The long axis plane is parallel to the long axis of the LV (line drawn from the apex to the base of the heart) and short axis is perpendicular to the long axis [7]. The four-chamber plane is marked by a plane through LV apex and intersects LV, RV, and atria (perpendicular to both long and short axes). Note that each patient is different, hence exact positioning and orientation of the transducer on the chest wall will vary from patient to patient, depending on the anatomical position and orientation of the heart. If good acoustic images cannot be obtained on one tomographic plane, gentle tilting, rotating or angling of the footprint, or repositioning the patient in a lateral decubitus position should be attempted to obtain the desired image.
Parasternal Long-Axis (PLAX) View
In this view, the transducer is placed on the third or fourth rib space along the left parasternal region with the marker on the probe pointing facing the right shoulder (Fig. 5.9). The ideal image includes the LV cavity in the long axis (elongated horizontally, not oblong) with the MV and AV in a single plane. In the PLAX view, the right ventricular outflow tract (RVOT) is in the upper portion of the image, as it is the closest to the transducer (Fig. 5.10). The interventricular septum (IVS) divides the RVOT from the LV. The posterior wall of the LV is imaged in this view but the LV apex may be missed. The LA can be seen in the lower right-hand portion of the screen. The AV is visualized as thin linear echogenic structures separating the LV from the aortic root. The upper aortic cusp corresponds to the right coronary cusp and the lower aortic cusp to the noncoronary cusp (Fig. 5.3). The MV is located furthest from the transducer, below the aortic root. The posterior leaflet is attached to the posterior LV wall and the anterior leaflet is closest to the aorta, in close proximity to the noncoronary AV cusp. The papillary muscles can be visualized well in this view, attaching to the mitral leaflets by the chordae tendineae (Fig. 5.10).
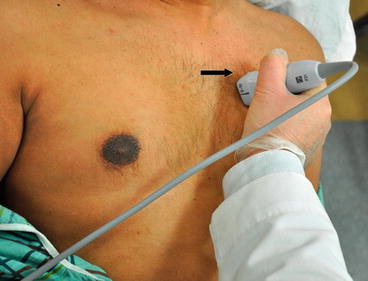
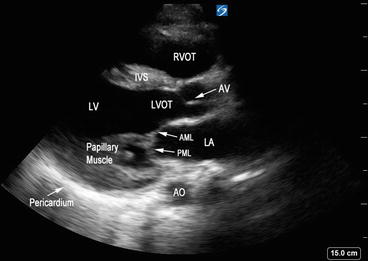
Fig. 5.9
Transducer orientation in parasternal long axis. Note the marker on the probe (thick arrow) pointing toward the right shoulder
Fig. 5.10
Parasternal long-axis view with left ventricular outflow tract and mitral valve in the same plane. Interventricular septum (IVS) divides the right ventricular outflow tract (RVOT) from left ventricle (LV). LA left atrium, LV left ventricle, LVOT left ventricular outflow tract, RVOT right ventricular outflow tract, AO aorta, AV aortic valve, AML anterior mitral leaflet, PML posterior mitral leaflet
The PLAX view is useful for assessment of LV chamber size and contractility, segmental wall function, wall thickness, and the interventricular septum. Color Doppler can be utilized to evaluate for aortic or mitral valvulopathies. This is the best view to visualize the coaptation of the mitral leaflets and visualize the dynamics of the annulus, chordae, and papillary muscle to determine the cause of pathology. PLAX was the preferred window of examination for estimation of LV function in a prospective study of emergency medicine physicians performing focused bedside CCE [8]. However, caution should be exercised in assessment of LV size as off-axis views can lead to erroneous assessment of LV size and function.
Parasternal Short Axis (PSAX) View
From the PLAX view, with steady hands the transducer is turned 90° clockwise, so that the pointer is oriented toward the left shoulder to achieve PSAX view (Fig. 5.11). Optimal image would include a concentric view of the walls of the left ventricular chamber that appear as a circle, along with right ventricular cavity that appears as a semicircle (Fig. 5.12). By angling the transducer superiorly toward the base of the heart, the AV level is obtained with all three leaflets: right, left, and noncoronary cusps in view (Fig. 5.6). The AV lies posterior to the RVOT and anterior to the LA. The pulmonic valve can also be seen in long axis in this plane with RV outflow tract by gently angling superiorly. Angling the transducer inferiorly will bring the mitral valve into view. The anterior leaflet is on top, closer to the RV, and the posterior mitral leaflets can be seen at the bottom of the screen, further away from the transducer (Fig. 5.4). Angling further down, a view with anterolateral and posteromedial papillary muscles is seen (Fig. 5.5). The mid-ventricular or papillary muscle level is where assessment of LV function should be performed. This mid-ventricular level allows assessment of segmental endocardial motion, wall thickening, and septal kinetics. Angling the transducer superiorly to inferiorly, from the base to the apex, can give the intensivist a general idea of the global systolic function of the LV.
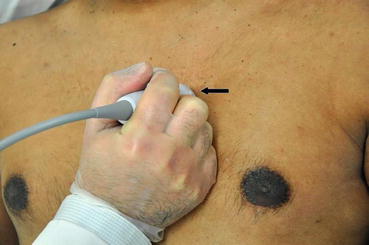
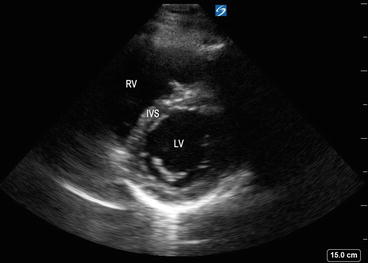
Fig. 5.11
Transducer orientation in parasternal short axis view. Note the marker on the probe (thick arrow) pointing toward the left shoulder
Fig. 5.12
Parasternal short axis view with left ventricular chamber appearing as a circle, along with right ventricular cavity that appears as a semicircle. LV left ventricle, RV right ventricle, IVS interventricular septum
Apical Four-Chamber (A4C) View
In the “apical four-chamber” (A4C) view, the transducer is placed near the apex of the heart or point of maximum impulse (inferolateral to the left nipple) with the transducer pointing to the right shoulder. The transducer may have to be moved slightly medially until the heart falls into view. The probe marker should be facing a 2–3 o’ clock position (Fig. 5.13). With the ideal image, the LV appears elliptical and tapered with a rounded apex and all four cardiac chambers and the atrioventricular valves are visualized (Fig. 5.14). If the image is off-axis, the LV appears foreshortened and can lead to incorrect conclusions with assessment of relative wall thickness and EF. The A4C view is good for measurement of EF, stroke volume, wall thickness, and segmental wall function. It is also used to assess the MV and TV anatomy and color Doppler analysis can be utilized for assessment of regurgitation and stenosis. In the A4C view, the anterior mitral leaflet can be seen adjacent to the aorta and the posterior mitral leaflet on the lateral wall. The chordae tendineae can be seen attaching the leaflet to the papillary muscle. Color Doppler can be used in this view to assess for mitral regurgitant flow back into the LA (Fig. 5.15). The A4C is one of the most difficult views to obtain in critically ill patients for basic CCE and repetitive practice is needed to achieve proficiency [6, 9].
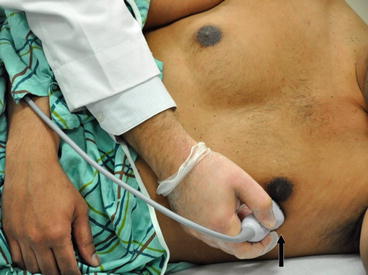
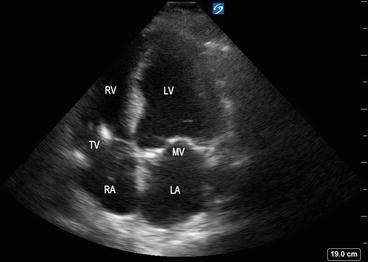
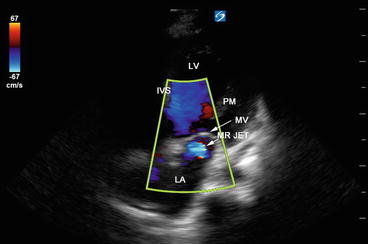
Fig. 5.13
Transducer orientation in apical four-chamber view. The marker on the probe is facing 3 o’clock position. For better visualization the patient is positioned in left lateral decubitus position
Fig. 5.14
Apical four-chamber view showing left atrium (LA), mitral valve (MV), left ventricle (LV), right atrium (RA), tricuspid valve (TV), and right ventricle (RV)
Fig. 5.15
Color Doppler flow mapping showing mitral regurgitant flow back into the left atrium. LA left atrium, MV mitral valve, MR jet mitral regurgitant jet, IVS interventricular septum, LV left ventricle, PM papillary muscle
Apical Two-Chamber (A2C) View
From the A4C view, the transducer is rotated counterclockwise by about 60° in order to obtain this view. This view is useful to evaluate LV function and regional wall motion abnormalities (Fig. 5.16). LV EF can be quantified from this view using the biplane method of discs (Simpson’s method).
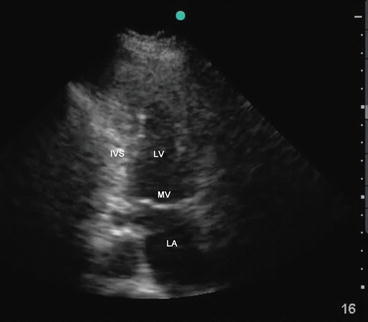
Fig. 5.16
Apical two-chamber view showing left atrium (LA), mitral valve (MV), and left ventricle (LV). IVS interventricular septum
Apical Five-Chamber (A5C) View
This view is obtained by slightly angling the probe upward or anteriorly from the A4C view to bring out the left ventricular outflow tract (LVOT) (Fig. 5.17). The aortic valve will be in the center of the image. Although this view may not be part of basic CCE, it is useful for calculating the velocity time integral (VTI) across the LVOT and for assessment of stroke volume. This view is also useful for assessing aortic stenosis and regurgitation.
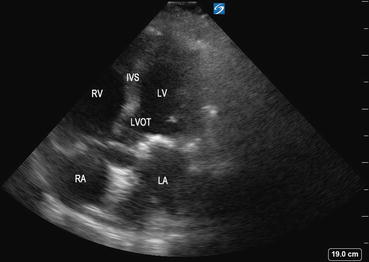
Fig. 5.17
Apical five-chamber view demonstrating the left ventricular outflow tract (LVOT ), interventricular septum (IVS), left atrium (LA), left ventricle (LV), right atrium (RA), and right ventricle (RV). The circular structure in the center of the image is the aorta
Subcostal (SC) View
The “subcostal” view is especially useful in intubated patients and also in decompensating patients for a quick view of the cardiac chambers and pericardium. This view may often be the only adequate anatomical window available in patients with poor parasternal or apical views. In the supine position, the transducer is placed in the subcostal area, under the xiphoid process, and it should point to the patient’s left shoulder (Fig. 5.18). The transducer should be held on its top surface so that it lies relatively flat on the patient’s abdomen, with the marker pointing to 3’o clock position and angling cephalad. Imaging during deep inspiration or during a ventilator delivered breath will bring the diaphragm down and facilitate the subcostal approach. The four chambers and part of the liver are visualized in the SC view (Fig. 5.19). The entrance of the inferior vena cava (IVC) into the right atrium is visualized by angling the probe further posteriorly and rotating counterclockwise. Determination of the IVC diameter and its respiratory variation is helpful in the assessment of volume status—see Chap. 4 for further discussion (Fig. 5.20).
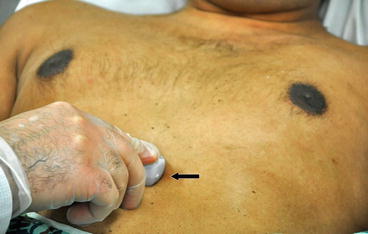
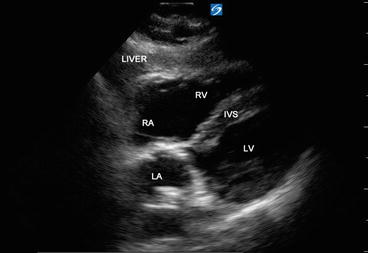
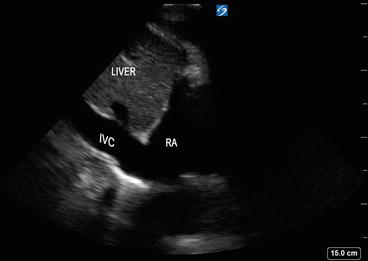
Fig. 5.18
Transducer orientation in subcostal view with probe marker facing 3 o’clock position
Fig. 5.19
Subcostal long axis view showing all four cardiac chambers and part of liver. Interventricular septum (IVS), left atrium (LA), left ventricle (LV), right atrium (RA), and right ventricle (RV )
Fig. 5.20
Inferior vena cava (IVC) is visualized by angling the probe further posteriorly and rotating counterclockwise in the subcostal view. RA right atrium
Basic Competencies
Critical care physicians with basic training in CCE should be able to perform a goal-directed examination to answer specific questions related to patient management. Competence in obtaining the abovementioned four basic views and in interpretation is essential. The ACCP consensus statement identifies qualitative assessment of LV cavity size, LV systolic function, distinguishing homogeneous from heterogeneous patterns of LV contraction, and detecting severe valvular regurgitation using color Doppler as part of basic CCE practice [2]. Once other causes of acute hypotension such as cardiac tamponade and severe RV dysfunction are ruled out, the examiner should focus on the ventricular function and valve integrity (Box 5.4). All examinations should be performed in multiple views so as not to make erroneous conclusions from one tomographic plane. Global ventricular dysfunction is seen with conditions such as sepsis and myxedema, while acute cardiac ischemia may cause regional wall motion abnormalities. It is also important to repeat serial examinations to assess ventricular function at different loading conditions.
Box 5.4. Questions to ask during basic CCE when suspecting LV or valvular dysfunction
What is the size of the left ventricular cavity: small, normal, or severely dilated?
Is the left ventricle adequately filled?
How is the contractility of the left ventricle? Categorize as normal, hyperdynamic, moderate dysfunction, or severe dysfunction.
Is there evidence of global or regional wall motion abnormalities?
Can the hemodynamic compromise be explained on the basis of severe valvular regurgitation or stenosis?
Related posts:

Stay updated, free articles. Join our Telegram channel

Full access? Get Clinical Tree


