Fig. 15.1
Phased array transducer used for TCCS. IM index mark on the probe corresponds to index mark on the screen
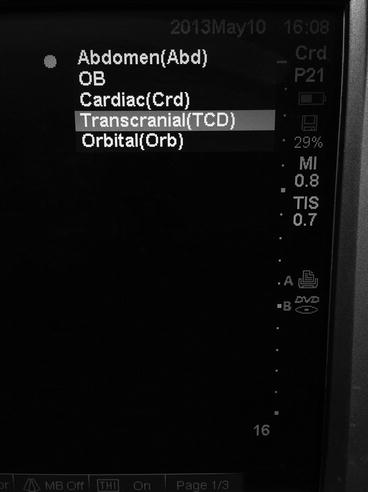
Fig. 15.2
Selection of transcranial preset. Select “Transcranial” from the list of presets available for the phased array transducer probe
Patient Factors
The patient is positioned supine with the head resting comfortably back on the bed during transtemporal insonation. During transforaminal insonation the patient is ideally positioned sitting up with the head flexed forward; however, the patient can also be positioned on his/her side with the chin in contact with the chest. While no specific adverse effects have been reported with the diagnostic use of standard TCD/TCCS probes, the general principle of ALARA (as low as reasonably achievable) must be kept in mind, with the duration of insonation restricted to that which is clinically essential. This is particularly true because transcranial insonation typically requires maximal acoustic power output. About 5–20 % of patients have an inadequate transtemporal window for performance of TCCS [7, 8]. Risk factors for absence of transtemporal window include older age, female sex, and measured skull thickness [7, 8].
Image Acquisition and Interpretation
Image Acquisition
The sector-shaped image on the screen obtained from the phased array probe is oriented with the index mark on the upper left aspect of the image. The examiner ideally stands behind the patient’s head, although any position that allows the elbow to rest on the patient’s bed or be held close to the examiner’s side is acceptable; arm fatigue can be expected to develop rapidly. Insonation is initially performed through the transtemporal acoustic window, with the transducer placed immediately anterior to the upper border of the tragus and superior to the posterior zygomatic arch (Fig. 15.3). The index mark on the probe is directed anteriorly and rotated at a 10–20° angle superior to the axial plane (Fig. 15.4) with the transducer itself tilted at a 10–20° angle cephalad to the axial plane (Fig. 15.5). If the desired image is not obtained, the probe can be moved within the approximate area delineated by the circle in Fig. 15.3 until the desired initial grayscale image is obtained. If no recognizable anatomical features are seen, it is possible that the patient does not have an acoustic window on that side.
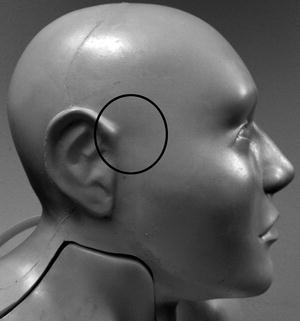
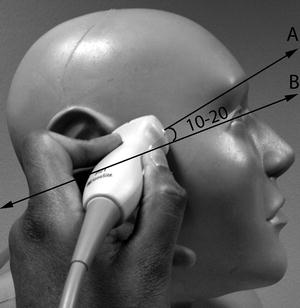
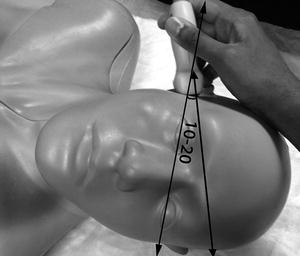
Fig. 15.3
Transtemporal window. The phased array probe can be moved within the circle until the midbrain is identified on B-mode
Fig. 15.4
Probe position for TCCS – lateral view of transtemporal insonation. The transducer is rotated slightly so the index mark on the phased array probe points in the direction A, which is at about a 10–20° angle to the anatomical axial plane, depicted by line B
Fig. 15.5
Probe position for TCCS – anteroposterior view of transtemporal insonation. The transducer is tilted slightly cephalad, at a 10–20° angle to the anatomical axial plane
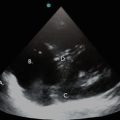
The single most important anatomical feature to identify at this point is the midbrain (Fig. 15.6), at a depth of about 5–8 cm, with the “Mickey Mouse ears” of the crus cerebri seen turned on their side. This is comparable, but not identical, to the image obtained with computed tomography (CT) imaging at this level (Fig. 15.7). Once this plane of imaging is obtained, other prominent anatomical features can be rapidly identified, including the lesser sphenoid wing of the temporal bone and the basal cisterns, particularly the interpeduncular and quadrigeminal cisterns (Figs. 15.6 and 15.7). The normal anatomical distribution of the major intracranial arteries and the circle of Willis is shown in Fig. 15.8. Once the midbrain is identified on the grayscale image, the color box is positioned over the expected anatomical location of the vessel(s) of interest, with “red” typically depicting flow toward and “blue” flow away from the probe. The most important intracranial artery to identify is the middle cerebral artery (MCA), seen as a curved vessel extending out toward the probe with flow directed toward the probe (depicted in red in Fig. 15.9) from a point anterior and lateral to the midbrain that is the point of bifurcation of the internal carotid artery, at about 4–6 cm depth. The A1 segment of the anterior cerebral artery (ACA) is seen extending from the internal carotid artery (ICA) bifurcation in the opposite direction, anteriorly, and toward the midline, with flow away from the probe (depicted in blue in Fig. 15.9). The ipsilateral (blue) and contralateral (red) A1 segments appear to meet in the midline (where the anterior communicating artery is typically not visualized) with the two A2 segments (which can often not be individually distinguished) extending anteriorly from this point, in the midline, with flow away from the probe (blue in Fig. 15.9). Minimal downward (caudal) angulation of the probe from this plane will reveal the distal internal carotid artery (ICA) following its entry into the skull, in continuity with proximal MCA, with flow directed toward the probe. Placing the color box around the midbrain itself, in the original plane of insonation, will reveal the posterior cerebral artery (PCA) curving around the crus cerebri and the midbrain from its point of origin (the bifurcation of the basilar artery) in the interpeduncular cistern. The ipsilateral PCA P1 segment demonstrates flow toward the probe (red in Fig. 15.9), which changes to flow away from the probe (blue) in the P2 segment following the completion of the bend in the PCA around the crus cerebri.
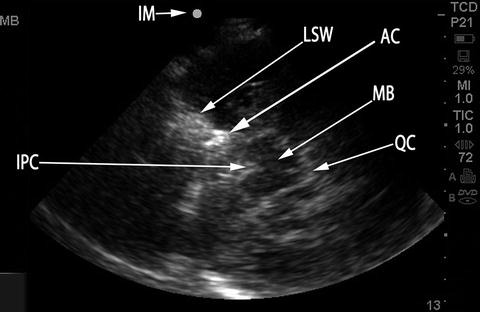
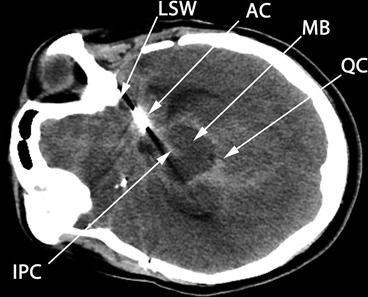
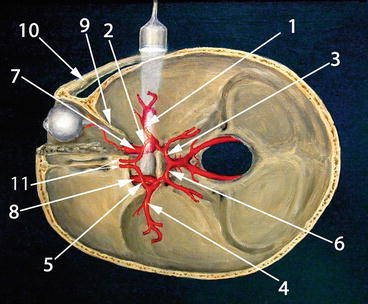
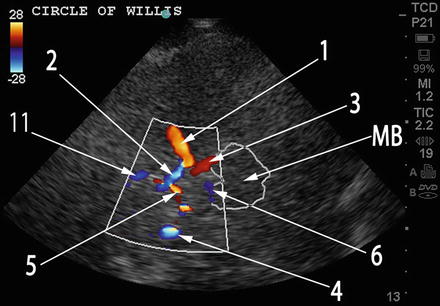
Fig. 15.6
B-mode image at level of the midbrain. Compare to Fig. 15.7, which depicts CT imaging at the same level in the same aSAH patient, with the same anatomical features labeled. IM index mark (corresponds to Index Mark on transducer), MB midbrain, LSW lesser sphenoid wing, AC aneurysm clip, QC quadrigeminal cistern, IPC interpeduncular cistern
Fig. 15.7
CT axial image at level of midbrain. Compare to Fig. 15.6, which depicts B-mode image at the same level in the same aSAH patient, with the same anatomical features labeled. The CT image has been rotated 90° to the left for easier comparison to the ultrasound image. MB midbrain, LSW lesser sphenoid wing, AC aneurysm clip, QC quadrigeminal cistern, IPC interpeduncular cistern
Fig. 15.8
Normal anatomical distribution of intracranial arteries. Compare to Fig. 15.9, which is a duplex image of the circle of Willis in approximately the same anatomical plane with the same labeling. 1 Ipsilateral MCA, 2 ipsilateral ACA A1 segment, 3 ipsilateral PCA P1 segment, 4 contralateral MCA, 5 contralateral ACA A1 segment, 6 contralateral PCA P1 segment, 7 ipsilateral ICA, 8 contralateral ICA, 9 lesser sphenoid wing, 10 zygomatic arch, 11 bilateral ACA A2 segments (This figure was adapted from http://en.wikipedia.org/wiki/File:Transcranial_doppler.jpg under the terms of GNU Free Documentation License, Version 1.3 by Rune Aaslid)
Fig. 15.9
TCCS duplex image of the circle of Willis. Compare to Fig. 15.8 which depicts normal anatomical distribution of intracranial vessels in approximately the same anatomical plane with the same labeling. 1 ipsilateral MCA, 2 ipsilateral ACA A1 segment, 3 ipsilateral PCA P1 segment, 4 contralateral MCA, 5 contralateral ACA A1 segment, 6 contralateral PCA P1 segment, 11 bilateral ACA A2 segments (cannot be distinguished on TCCS)
Increasing the depth of insonation to 13 cm or greater and extending the color box will sometimes reveal the contralateral intracranial vessels, depending on the quality of the acoustic window. This is most feasible when performing insonation through a large decompressive craniectomy defect. When visible, the contralateral ACA A1 segment and PCA P2 segments are seen with flow toward the probe (red), while the contralateral MCA and PCA P1 segment are seen with flow away from the probe (blue), as seen in Fig. 15.9. An attempt at interrogation of the contralateral vessels may be the only recourse when a patient has a viable transtemporal acoustic window on only one side.
To visualize the vertebrobasilar circulation, the patient’s head is flexed forward and the transducer firmly positioned in the suboccipital region with use of copious conductive gel to permit acoustic transmission through the hair at the nape of the neck. The probe is angled so that the long axis of the probe passes through the nasion, permitting insonation through the foramen magnum (Fig. 15.10). The most important structure seen on the grayscale image will be the foramen magnum, a large circular hypoechoic structure in the midline between about 2–7 cm of depth (Fig. 15.11). The color box is placed so that it covers the foramen magnum and the expected location of the basilar artery deeper to the foramen, within the cranial vault. The two vertebral arteries are visualized on either side of the foramen magnum, with flow away from the probe (blue in Fig. 15.11), extending intracranially to a point of confluence at about 6–8 cm of depth, beyond which the basilar artery is seen extending distally into the cranial vault, also with flow away from the probe (blue in Fig. 15.11). This confluence typically results in the “Y” shape seen in Figs. 15.11 and 15.12. The distal bifurcation of the basilar artery is typically not visualized with TCCS.
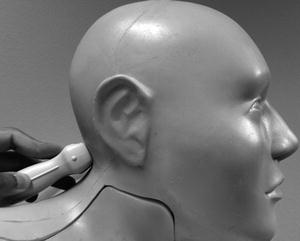
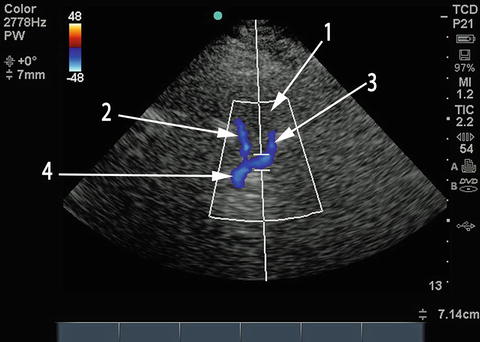
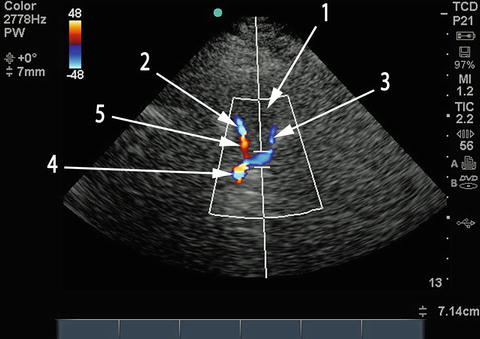
Fig. 15.10
Probe position for TCCS – transforaminal (suboccipital) window. Probe is placed below occipital protuberance with head flexed (head flexion not demonstrated in this image), probe points toward the nasion
Fig. 15.11
Transforaminal view of vertebral and basilar arteries. The hypoechoic circular structure labeled 1 is the foramen magnum. Right (2) and left (3) vertebral arteries meet to form the basilar artery (4), producing the characteristic Y shape on duplex imaging
Fig. 15.12
Aliasing in the vertebrobasilar circulation. Repeat TCCS performed on the same patient with aSAH several days following Fig. 15.11. Identical image to Fig. 15.11, except aliasing is seen in the distal right vertebral (5) and proximal basilar (4) arteries. 1 foramen magnum, 2 right vertebral artery with aliasing in the distal segment labeled 5, 3 left vertebral artery, 4 basilar artery now with aliasing
Once the vessels of interest are identified, pulse Doppler is selected with a sample volume size of about 3–10 mm. The sample volume is then placed on the arterial segment of interest (Fig. 15.13). Since the anatomical orientation of the artery can be clearly visualized, an effort must be made to obtain an insonation angle as close as possible to zero degrees for flow toward the probe and 180° for flow away from the probe (Figs. 15.13 and 15.14). When this is not possible, most POC machines with TCCS capability permit angle correction through manual delineation of the direction of flow within the vessel. The machine then corrects the calculated velocity using a formula that includes the angle of insonation. Using angle correction is generally not recommended when the angle of insonation is greater than 60° or when a sufficiently long arterial segment is not available to accurately depict the direction of flow. Once the sample volume is appropriately positioned (and angle correction performed if so desired), the spectral Doppler reading is obtained (Fig. 15.15). The Doppler frequency shift recorded within the sample volume is converted to flow velocity, depicted on the y-axis, against time, on the x-axis. One complete cardiac cycle on the spectral Doppler waveform is then traced out and the machine calculates the parameters of interest, including the peak systolic velocity (PSV), end-diastolic velocity (EDV), the mean cerebral blood flow velocity (mCBFV – otherwise known as the time averaged peak or TAP), and the pulsatility index {PI = (PSV-EDV)/mean flow velocity or MFV}.
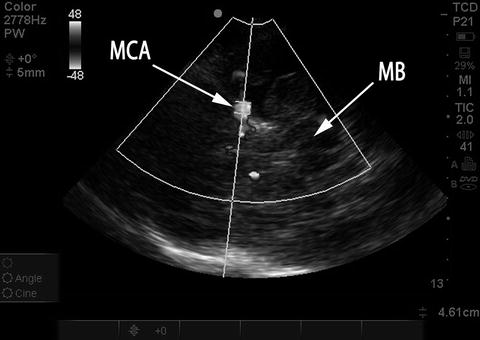
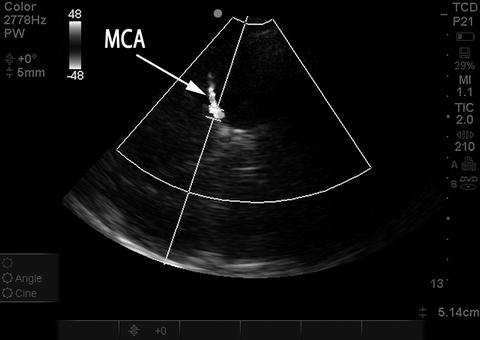
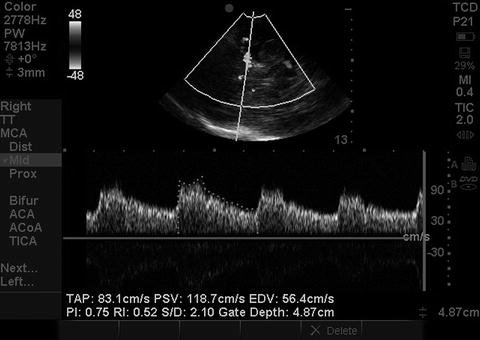
Fig. 15.13
Placement of sample volume on MCA, good angle of insonation. Duplex color image rendered in black and white. The sample volume has been placed in the MCA M1 segment. Note excellent angle of insonation, in-line with direction of flow in the MCA. MB midbrain, MCA middle cerebral artery
Fig. 15.14
Placement of sample volume on MCA, suboptimal angle of insonation. Duplex color image rendered in black and white. Same patient and examination as in Fig. 15.13. Probe has been moved slightly and the sample volume is again placed on the MCA M1 segment; however, there is now a relatively steep angle of insonation to the direction of flow in the MCA, which will artificially lower the measured mCBFV. Probe position needs to be altered slightly to optimize angle of insonation, seen in Fig. 15.13
Fig. 15.15
Spectral Doppler waveform. Spectral Doppler waveform obtained from sample volume placement on MCA shown in Fig. 15.13. The mCBFV is depicted here as the time averaged peak (TAP). PSV peak systolic velocity, EDV end-diastolic velocity, PI pulsatility index
When the blood flow velocity within an arterial segment is relatively high relative to the set color scale, aliasing may occur. Aliasing is visible as an abrupt change in color duplex examination within a segment of the artery (but not the entire artery) from the expected color appropriate to the direction of flow to the opposite color: red to blue or vice versa. The presence of aliasing can be clinically useful, since regions of aliasing are more likely to represent higher velocities and can be preferentially sampled when looking for vasospasm (Fig. 15.12). Most aliasing does NOT represent vasospasm; however, and if so desired, aliasing can be eliminated by increasing the range of the color scale.
Once the intracranial vessels have been interrogated, measuring the velocities in the distal cervical internal carotid arteries, immediately prior to their entry into the skull, should be performed when evaluating for vasospasm. These extracranial ICA (exICA) velocities are used to calculate the Lindegaard ratio (mCBFVMCA/mCBFVexICA). The transducer is placed in the submandibular region at the angle of the jaw and directed upward and slightly medially, toward the ipsilateral eye (Fig. 15.16). The exICA is a linear (sometimes tortuous) vessel with flow away from the probe (blue in Fig. 15.17) and is typically medial to the internal jugular vein, which is distinguished by the presence of flow toward the probe (red) and a venous pattern of pulsation. The most important distinguishing feature of the exICA, compared to the external carotid artery, is the presence of substantial diastolic flow in the exICA. As with intracranial vessels, obtaining an angle of insonation as close to 0° or 180° as possible is important; otherwise, perform angle correction.
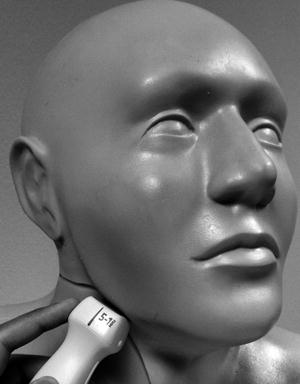
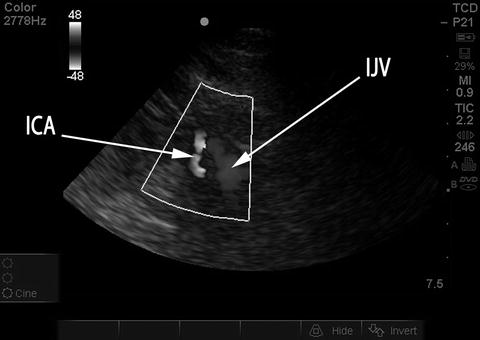
Fig. 15.16
Probe position for TCCS – submandibular insonation. Probe is placed below angle of the jaw and directed upward and slightly medially
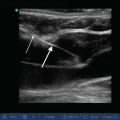
Fig. 15.17
Extracranial ICA and IJV seen on submandibular insonation. Duplex color image rendered in black and white. ICA internal carotid artery, was blue in original duplex image depicting flow away from probe. IJV internal jugular vein, was red, with flow toward the probe
Image Interpretation
The most important parameter obtained from TCCS is the mCBFV, since most angiographic correlation to vessel caliber has been performed with this parameter. The range of “normal” velocities used at the University of Michigan is shown in Table 15.1.
Table 15.1
Normal range of mean cerebral blood flow velocities
Intracranial artery | Normal range of mCBFV (cm/s) |
|---|---|
Middle cerebral artery (MCA) | 37–81 |
Anterior cerebral artery (ACA) | 25–77 |
Posterior cerebral artery (PCA) | 18–58 |
Intracranial internal carotid artery (ICA) | 19–69 |
Vertebral artery | 16–56 |
Basilar artery | 21–57 |
Extracranial internal carotid artery (ExICA) | 28–48 |
1.
Cerebral vasospasm after aSAH
Reduction in vessel caliber caused by cerebral vasospasm following aSAH will result in an elevation in mCBFV, since velocity of blood flow is inversely proportional to the square of the vessel radius [9]. A mCBFV <120 cm/s in the MCA is reliable for the exclusion of hemodynamically significant vasospasm and mCBFV >200 cm/s is specific for severe vasospasm [1, 10]. Elevations in velocity between 120 and 200 cm/s may be caused by either hyperdynamic flow or vasospasm. Hyperdynamic flow frequently results from factors such as the catecholamine surge following aSAH, anxiety, pain, fever, anemia, and the use of inotropic agents. The Lindegaard ratio (mCBFVMCA/mCBFVexICA) can be used to differentiate hyperdynamic flow from vasospasm [1, 10]. A ratio >3 likely represents mild vasospasm and a ratio >6 severe vasospasm. Thresholds for the identification of vasospasm have been validated primarily in the MCA. However, normal MCA velocities are almost always higher than ipsilateral normal ACA, ICA, and PCA velocities. Therefore, an elevation in the velocity (or corresponding ratio to ipsilateral exICA velocity) in any of these other arteries above thresholds validated for vasospasm in the MCA are very likely to represent vasospasm in those vessels as well; this is especially true when the mCBFV in any of these other arteries exceeds 200 cm/s. Normal velocities in the posterior circulation are typically lower than in the anterior circulation. In one study, a basilar velocity >85 cm/s and a ratio of basilar to extracranial (measured in the neck, not transforaminal) vertebral mCBFV >3 had 92 % sensitivity and 97 % specificity for basilar narrowing of more than 50 % on angiography [11]. While mCBFV identifies large vessel vasospasm and not tissue ischemia, a PI ≤ 0.58 may identify patients with large vessel vasospasm at higher risk for subsequent clinical neurological decline [12].
2.
Get Clinical Tree app for offline access

Determination of brain death
The American Academy of Neurology’s Quality Standards Subcommittee requires that the determination of brain death using TCD/TCCS be made on the basis of reverberating flow (Fig. 15.18) or short systolic spikes (Fig. 15.19) recorded in the anterior circulation (typically the MCA) bilaterally as well as in the posterior circulation (basilar) [1]. While the presence of such diffuse reverberating flow or short systolic spikes is considered incompatible with clinical recovery, the absence of flow signal cannot be used to determine brain death, since the inability to detect signal is commonly the result of inadequate windows or other technical factors.
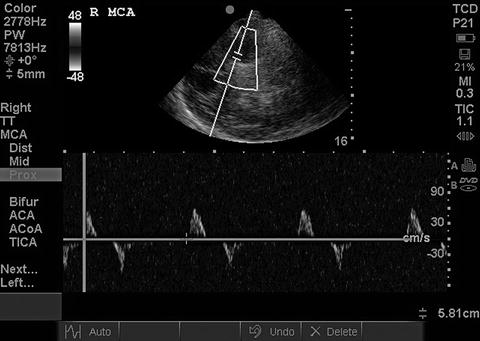
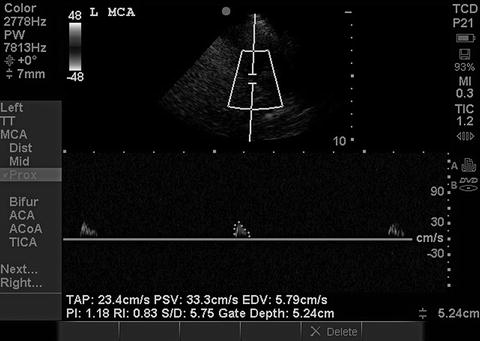
Fig. 15.18
Reverberating flow in brain death. Reverberating systolic/diastolic flow seen in the MCA. When present in both MCAs and the basilar, this is incompatible with clinical recovery
Fig. 15.19


Short systolic spikes in brain death. Short systolic spikes with no diastolic flow in the MCA. When present in both MCAs and the basilar, this is incompatible with clinical recovery
Related posts:

Stay updated, free articles. Join our Telegram channel
Full access? Get Clinical Tree