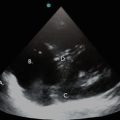
Fig. 7.1
Apical four-chamber view, showing complete ventricular collapse in a patient with large pericardial effusion and cardiac tamponade. RA right atrium, PE pericardial effusion, LA left atrium, LV left ventricle
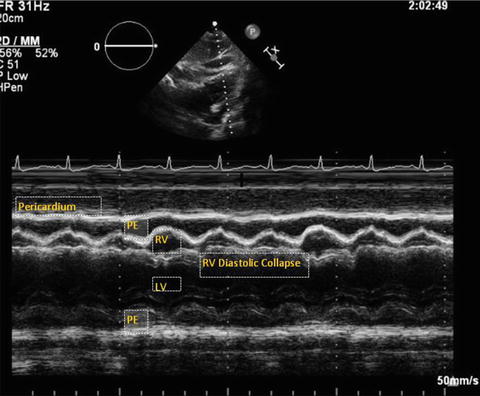
Fig. 7.2
M-mode from parasternal long axis view in a patient with cardiac tamponade. Note the right outflow tract collapse in diastole. PE pericardial effusion, LV left ventricle, RV right ventricle
Basic Anatomy of the Pericardium
The pericardium is normally 1–2 mm thick and consists of an outer parietal layer and an inner visceral layer. The parietal pericardium is a thicker fibrous layer that surrounds the heart and the visceral pericardium and is contiguous with the epicardium. The enclosed space between the two layers forms the pericardial sac, which normally contains around 5–10 mL of fluid. The parietal pericardium meets with the visceral pericardium around the great vessels to form the pericardial reflections. The pericardium encases all four chambers of the heart and extends 1–2 cm up the great vessels. The pericardial layers provide an enclosed chamber effectively isolating the heart from the rest of the structures in the mediastinum, allowing dynamic movements during the cardiac cycle, aiding cardiac filling during diastole, and providing lubrication [10]. Usually, the pericardial pressure reflects the pleural pressure and varies between – 5 cm H2O during inspiration and + 5 cm H2O during expiration [11, 12].
Pericardial Effusion and Tamponade Physiology
Pericardial effusions can result from various causes including, but not limited to, inflammatory or infectious etiologies, trauma, or malignancy (Table 7.1). Normally, the pericardium can stretch up to a point, termed the reserve volume, to accommodate changes in pericardial fluid volume; however, once the reserve volume is exceeded, pericardial compliance decreases. Further increases in the pericardial volume will then result in dramatic increases in pericardial pressure and hence affect atrioventricular filling, as described in detail below, with resultant hemodynamic effects.
Table 7.1
Various etiologies causing pericardial effusion
Infection |
Viral infections (Coxsackie, Echo, Adeno, Cytomegalovirus) |
Bacterial (Staphylococcus, Pneumococcus, Salmonella, Mycobacteria) |
Parasitic (amoebiasis, Echinococcus) |
Malignant |
Metastatic (primary lung, breast, lymphoma, leukemia) |
Primary cardiac tumors (rhabdomyosarcoma, angioma) |
Inflammation |
Autoimmune (SLE, rheumatoid arthritis) |
Uremia |
Post-myocardial infarction |
Traumatic |
Blunt trauma |
Penetrating injuries |
Radiation |
Drugs |
Procedure related |
Post-cardiac surgery |
Pacemaker and catheter related |
Cardiopulmonary resuscitation |
Idiopathic |
Catastrophic causes |
Aortic dissection |
Post infarction LV rupture |
Penetrating chest trauma |
Pericardial Compliance
When pericardial fluid accumulates, the compliance of the parietal pericardium initially increases, resulting in a stable intrapericardial pressure. When the pericardial reserve volume is exceeded, pericardial compliance begins to fall and the intrapericardial pressure rises, and the central venous pressure must increase to maintain a gradient that allows cardiac filling. When the stretch threshold of the pericardium is exceeded, pericardial compliance markedly decreases, resulting in rapid increases in pericardial pressure with increasing volume (Fig. 7.3). At this point, the intrapericardial pressure may first equalize with the right ventricular diastolic pressure, and then with the left ventricular diastolic pressure. Critical tamponade occurs when all cardiac chambers have equal diastolic pressure. At this inflection point, there is collapse of the right-sided cardiac chambers and the cardiac output can suddenly drop (Fig. 7.3). Circulation at this point is maintained only through an increase in heart rate, contractility, and peripheral arteriolar vasoconstriction. Left untreated, this can result in circulatory failure and death [13].
Fig. 7.3
Pericardial pressure-volume curves in relation to cardiac output. (a) Rapid accumulation of pericardial fluid leads to a rise in the pericardial pressure. Once the fluid overcomes the pericardial reserve volume and reaches the pericardial stretch threshold, the pressure in the pericardial space increases dramatically causing chamber collapse and impairing cardiac output. (b) With gradual accumulation of pericardial fluid, the pericardium is able to acclimate and stretch to a further extent prior to reaching the pericardial stretch threshold where cardiac output falls. Image courtesy of Guy Aristide, MD
Rate of Accumulation
The rate of accumulation of pericardial fluid and the total fluid volume determine the relative hemodynamic impairment caused by excess fluid in the pericardial space (Fig. 7.3). Conditions like uremic pericarditis or malignancy-related effusion can cause gradual accumulation of a large volume (>2 L) of fluid in the compliant pericardium, potentially causing minimal symptoms and no hemodynamic effects. However, in acute conditions, such as cardiac free wall rupture from pacemaker lead placement, rapid accumulation of even small amounts of pericardial fluid (50–80 mL) can exceed the pericardium’s ability to stretch and can cause hemodynamic compromise [14].
Interventricular Dependence
As the pericardial pressure exceeds the central venous and pulmonary venous pressure, diastolic filling is impaired and becomes increasingly influenced by the respiratory variation in intrathoracic pressures. During inspiration, as the intrathoracic pressure becomes more negative, central venous blood flow to the right atrium and right ventricle (RV) is augmented; at the same time, there is pooling of blood in the pulmonary veins, thereby reducing flow to the left atrium. As the RV is preferentially filled during inspiration, the interventricular septum bows into the left ventricle (LV), causing a drop in cardiac output and hence a drop in blood pressure with inspiration (Fig. 7.4). The opposite holds true with expiration, when the intrathoracic pressure increases and causes diminished return of blood from the vena cava to the right side of the heart and increased flow from the pulmonary veins into the left side of the heart. As more blood is accommodated in the LV, the ventricular septum bows toward the RV. This over-filling and under-filling of the heart with respect to respiration forms the basis for “pulsus paradoxus,” a classic clinical finding associated with cardiac tamponade. Although not specific for cardiac tamponade, an inspiratory drop in blood pressure of more than 10 mmHg in patients with pericardial effusion has a pooled sensitivity of 82 % for cardiac tamponade [13]. Moreover, the severity of the pulsus paradoxus correlates with the severity of hemodynamic compromise in cardiac tamponade [15]. However, caution should be used when interpreting this finding in patients with severe obstructive lung disease, severe volume depletion, right or left ventricular hypertrophy, or in those on invasive positive pressure ventilation. The clinician must be cognizant that cardiac tamponade is a clinical diagnosis and that neither presence of an elevated pulsus paradoxus nor an echocardiography finding of a pericardial effusion establishes the diagnosis of tamponade.
Fig. 7.4
Illustration of respirophasic cardiac physiology in a spontaneously breathing patient with pericardial effusion and tamponade. With inspiration, the intrathoracic pressure becomes more negative leading to increased right heart filling and bulging of the interventricular septum into the left ventricle and decreased left ventricular filling and stroke volume. The converse is true with expiration where the left heart filling is increased, leading to septal bowing into the right ventricle. Image courtesy of Guy Aristide, MD
Patient Considerations
The patient should be examined in the supine or left lateral decubitus position. Suboptimal positioning of the patient will result in unsatisfactory images, especially in critically ill patients who are often on ventilatory support. It is worthwhile for the intensivist to take the time to reposition the patient in a left lateral decubitus position if adequate images are not obtained in a supine position. This position will move the cardiac structures away from the sternum, allowing for improved imaging. The ultrasound machine itself should be positioned such that the machine controls can be easily adjusted by the intensivist. The transducer should be held like a pencil and stabilized by resting the hand holding the transducer on the patient’s body (Fig. 7.5). If the patient is able to follow directions, the left arm should be positioned under the patient’s head when in the lateral decubitus position. Although electrocardiographic (EKG) monitoring is helpful in determining timing of systole and diastole, it is not an absolute necessity while performing emergency point-of-care ultrasonography, when time is of the essence.
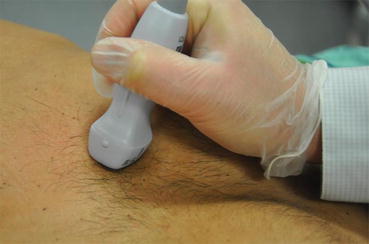
Fig. 7.5
Note the phased array transducer is held steadily like a pencil and stabilized by resting the hand on the patient’s body. A steady hold with subtle manipulations is required for optimal cardiac images
Image Acquisition and Interpretation
Image acquisition and interpretation requires an awareness of the plane in which sound waves are transmitted by the footprint, or surface, of the ultrasound probe and the resulting orientation of the 2-D images of the cardiac structures that are generated by the reflected waves. On the monitor, structures closest to the transducer appear at the top of the screen (or near field) and deep structures appear on the bottom (or far field). The leading edge of the beam is marked on the probe and corresponds to the mark on the monitor. By convention, for cardiac imaging the marker is typically on the upper right-hand corner of the screen. The gain can be adjusted to amplify the sound beam and obtain a clearer view. Pericardial fluid can be visualized in a long axis, or sagittal, plane as well as in short axis, or transverse, plane.
Image Acquisition
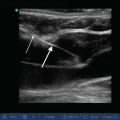
The cardiac and pericardial structures must be visualized in multiple echocardiographic views to confidently rule out the presence of a pericardial effusion. The pericardial layers appear as a thin, bright, echogenic line around the myocardium (Fig. 7.6). The normal thickness of the pericardium is 1–2 mm. In the normal pericardium, there is less than 25 mL of serous fluid in the pericardial sac formed by the visceral and parietal pericardium. A simple pericardial effusion is visualized as an anechoic (black) area on B-mode, contiguous to the adjacent cardiac structures and separating the echogenic layers of the pericardium (Fig. 7.7). With advanced practice, M-mode and pulsed wave Doppler can be utilized to assess for findings of cardiac tamponade.
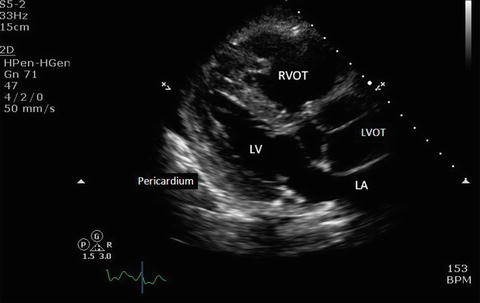
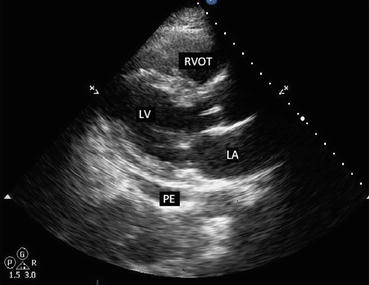
Fig. 7.6
Parasternal long axis view showing the pericardium and adjacent structures. The pericardium appears as a thin, bright, echogenic line around the myocardium. LV left ventricle, LA left atrium, RVOT right ventricular outflow tract, LVOT left ventricular outflow tract
Fig. 7.7
Parasternal long axis view in a patient with small pericardial effusion. Note the black, echo-free space adjacent to the left ventricle. PE pericardial effusion, LV left ventricle, LA left atrium, RVOT right ventricular outflow tract
Parasternal Long Axis (PLAX)
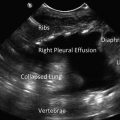
In the parasternal long axis view, the transducer is placed on the third or fourth intercostal space along the left parasternal region with the probe marker pointing toward the patient’s right shoulder (Fig. 7.8). If the views are suboptimal in the supine position, the patient should be examined in left lateral decubitus position. The depth and gain should be adjusted to optimize the image. Subtle rotation and angling of the probe will ensure that the heart is visualized as a horizontal, elliptical-shaped structure in this view (Fig. 7.7). The normal pericardium is a highly reflective, bright echogenic layer surrounding the cardiac chambers. A pericardial effusion is visualized as a black, anechoic, or echo-free space within the pericardium, separating the two echogenic layers (Fig. 7.7). When the volume of fluid is small, it can be seen as an anechoic space present posterior to the left ventricle and may be seen only in systole. Using the caliper feature, the pericardial fluid can be measured both anteriorly and posteriorly. The right ventricular outflow tract (RVOT), which is seen in the near field, can display diastolic chamber collapse with tamponade physiology. This view is also useful to differentiate pericardial from pleural effusion, which appears posterior to the descending aorta (Fig. 7.9). Localized pericardial effusions, which sometimes can cause hemodynamic instability, can be seen with the PLAX view. Echogenic material with stranding between the pericardial layers may also be seen in this view, indicating the presence of an exudative pericardial effusion from malignant, infectious, or inflammatory etiologies. Additionally, M-mode can be employed from the PLAX 2-D view to closely assess for chamber collapse.
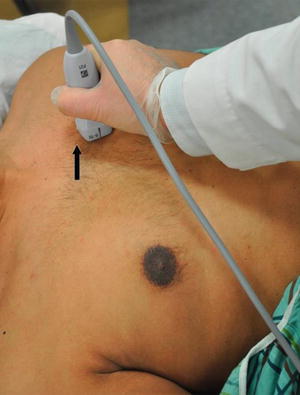
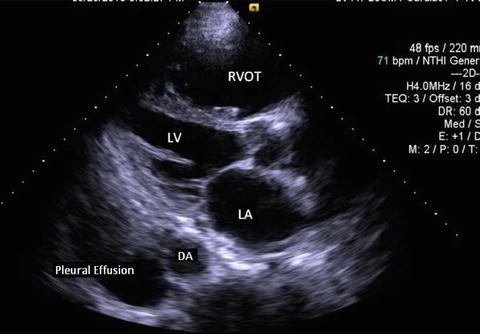
Fig. 7.8
Parasternal long axis view. The transducer is placed in the third or fourth intercostal space along the left parasternal region. The probe marker (arrow) should be facing the 10 o’ clock position toward the patient’s right shoulder
Fig. 7.9
Parasternal long axis view in a patient with a pleural effusion. Note the black, echo-free space located posterior to the descending aorta. LV left ventricle, LA left atrium, RVOT right ventricular outflow tract, DA descending aorta
Parasternal Short Axis (PSAX)
From the PLAX view, the transducer is turned 90°, so that the probe marker is now pointing toward the patient’s left shoulder to achieve the PSAX (Fig. 7.10). A cross-sectional image of the left ventricle, with all four walls and part of the right ventricle, can be seen in this view (Fig. 7.11). The PSAX view is particularly useful to study respirophasic movements of the interventricular septum. The dynamic movements of the septum with respiratory variation should alert the clinician to the possibility of increased pressure in the pericardial space. By gently angling anteriorly to the aortic valve level such that the probe is facing the right shoulder, the RVOT, aortic, tricuspid, and pulmonic valves can be visualized. The RVOT can be seen at the top of the screen and can be assessed for diastolic chamber collapse.
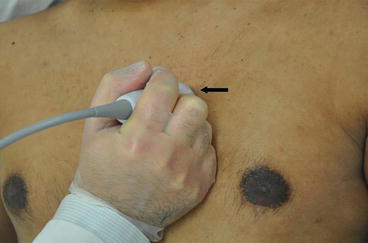
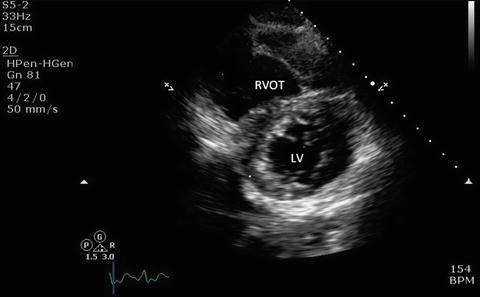
Fig. 7.10
Parasternal short axis view. From the parasternal long axis view, the transducer is turned clockwise to the 2 o’ clock position such that the probe marker (arrow) is now pointing toward the patient’s left shoulder. Angling the probe up and down allows one to scan up and down from apex to base
Fig. 7.11
Parasternal short axis view showing left ventricle, right ventricle, and the interventricular septum. LV left ventricle, RVOT right ventricular outflow tract
Apical Four Chamber (A4C)
In the apical four-chamber view, the footprint of the probe is placed near the apex of the heart or point of maximum impulse with the probe marker pointing to the left shoulder (Fig. 7.12). A left lateral decubitus position and subtle adjustment of the probe will further optimize this view such that the heart appears elliptical and not foreshortened (Fig. 7.13). Both the PLAX and the A4C views are optimal for visualizing pericardial effusions. The A4C view can demonstrate RA and RV diastolic collapse and the paradoxical movement of the interventricular septum that occurs with tamponade physiology. The Doppler sample box can be placed over the mitral and tricuspid valves to assess Doppler velocities.
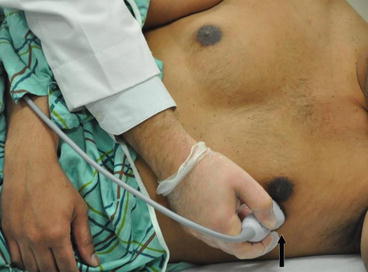
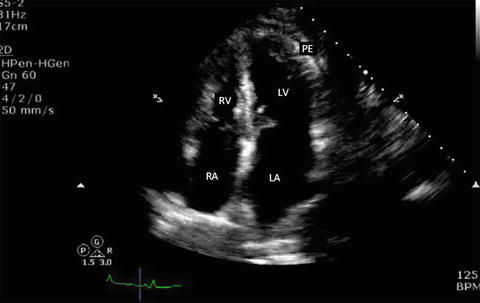
Fig. 7.12
Apical four-chamber view. The transducer is placed at the apex or point of maximal impulse. The probe marker (arrow) is placed at the 2–3 o’ clock facing the patient’s left shoulder
Fig. 7.13
Apical four-chamber view in a patient with small pericardial effusion. Note that the anechoic space adjacent to the LV apex. Note that the right ventricle is collapsed in diastole (mitral valves are open in diastole). RA right atrium, RV right ventricle, LA left atrium, LV left ventricle, PE pericardial effusion
Apical Five Chamber (A5C)
This view is obtained by slightly angling the probe anteriorly from the A4C view to bring out the left ventricular outflow tract (LVOT). Pulsed wave Doppler (PWD) recordings can reveal exaggerated respiration-dependent phasic changes in the LVOT outflow velocities reflecting changes in stroke volume.
Subcostal (SC)
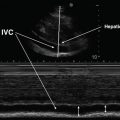
The subcostal (or subxiphoid) view is especially useful in intubated patients. In the supine position, the probe is placed in the subxiphoid area with the marker pointing to the 3 o’ clock position and the probe angled at 15° cephalad (Fig. 7.14). The four chambers and part of the liver are visualized in the SC view (Fig. 7.15). Occasionally a pericardial cyst or epicardial fat pad can be seen and should be distinguished from an effusion. The entrance of the inferior vena cava (IVC) into the right atrium is seen by angling the probe further posteriorly and rotating counterclockwise. This view is critical when ruling out tamponade, as it is a quick and easy way to assess for inspiratory collapse of the IVC [16]. The SC view is of high utility in evaluating the right atrium for chamber collapse. Additionally, the SC view can be utilized for real-time echocardiographic guidance for pericardiocentesis via the subxiphoid approach.
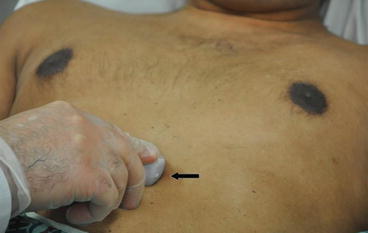
Fig. 7.14


Subcostal view. With the patient in the supine position, the probe is held on the top surface and placed in the subxiphoid area at a 15° angle with the marker (arrow) pointing to the patient’s left at the 3 o’ clock position
Related posts:

Stay updated, free articles. Join our Telegram channel
Full access? Get Clinical Tree
