Fig. 6.1
Graphic representation of the echocardiographic views used for evaluating the right ventricle. (a) Parasternal long-axis view, (b) long-axis view of the inflow tract, (c) parasternal short-axis view at the base of the heart, (d) parasternal short-axis view at the level of the papillary muscles, (e) apical four-chamber view, and (f) subcostal view. Ao aorta, LA left atrium, LV left ventricle, PA pulmonary artery, RA right atrium, RV right ventricle, RVIT RV inflow tract, RV LAX RV long-axis, RV SAX RV short-axis, RVOT RV outflow tract (Reprinted with permission from Jurcut R, Giusca S, La Gerche A, Vasile S, Ginghina C, Voigt JU. The echocardiographic assessment of the right ventricle: what to do in 2010? Eur J Echocardiogr. 2010;11(2):81–96)
Dimensions and Right Ventricular Wall Thickness
In the ICU setting, the bedside RV echocardiography begins with an assessment of RV size. RV dimension is best estimated at end-diastole from a right ventricle-focused apical four-chamber view. In this view the RV normally has a triangular shape, which becomes more oval as its pathologic dilation occurs. The RV should appear smaller than the LV and usually no more than two thirds the size of the LV in the standard apical four-chamber view. There are many quantitative parameters that can help the intensivist evaluate the RV size. Diameter >42 mm at the base and >35 mm at the mid level indicates RV dilation [11] (Fig. 6.2). In all complete echocardiographic studies, at least the RV basal measurement should be reported. In practice however, the easiest way to do so is to compare the RV to the LV. The RV inner surface area at end-diastole should normally be no more than 0.6 that of the LV. Moderate RV dilation would elevate this ratio to 0.7–0.9 and severe dilation to >1 [12]. RV dimensions are highly dependent on probe rotation by the user, which can result in an underestimation of RV width. Care should be taken to obtain the image demonstrating the maximum diameter of the RV without foreshortening. Relative RV enlargement, as suggested by an RV to LV end-diastolic diameter ratio ≥0.9, is predictive of in-hospital mortality and may be useful in identifying which patients require more aggressive therapy in patients presenting with acute PE [13]. The distal right ventricular outflow tract (RVOT) diameter can be visualized in the left PSAX view at the level of the pulmonic valve, while the left PLAX view allows for the measurement of the proximal diameter of the RVOT (Fig. 6.3).
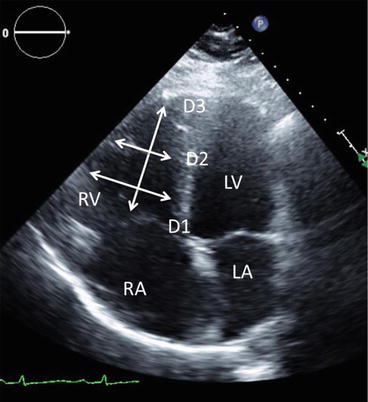
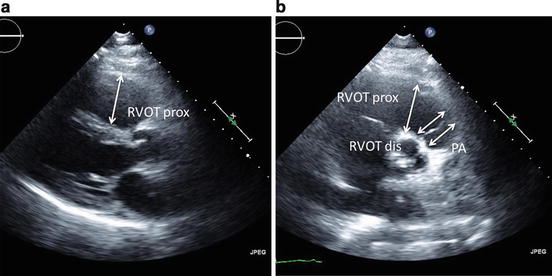
Fig. 6.2
Apical four-chamber view demonstrating measurements of the right ventricle obtained at end-diastole. RV right ventricle, RA right atrium, LV left ventricle, LA left atrium, D1 basal RV measurement, D2 mid-RV measurement, D3 base-to-apex measurement
Fig. 6.3
Measurement of the right ventricular outflow tract. (a) The left parasternal long-axis view allows for the measurement of the proximal portion of the RVOT, also referred to as the “proximal diameter.” (b) The left parasternal short-axis view demonstrating RVOT at the level of the pulmonic valve yields the “distal diameter.” RVOT prox proximal right ventricular outflow tract, RVOT dis distal right ventricular outflow tract, PA pulmonary artery
In patients receiving mechanical ventilation adequate imaging from the parasternal view is frequently limited due to interposition of the inflated lung between the heart and chest wall. Alternatively, a comparison of the areas of the RV and LV cavities can be made from the subcostal four-chamber view as described in the apical four-chamber view, either by measurement or visual gestalt. Additionally, the subcostal four-chamber view affords a good look at the RV free wall. RV wall thickness is measured in diastole using either M-mode or two-dimensional imaging. Thickness >5 mm indicates RV hypertrophy (RVH) and may suggest more chronic RV pressure overload in the absence of other pathologies (Fig. 6.4) [14] (Table 6.1).
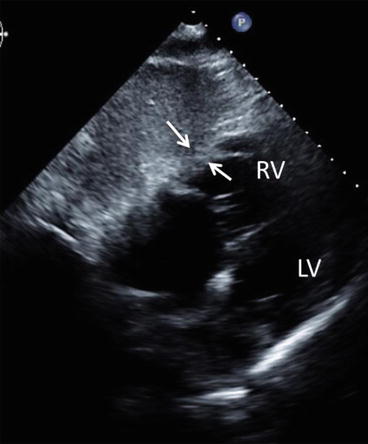
Fig. 6.4
Measurement of RV thickness. RV free wall thickness measurement obtained at end diastole at level of the tricuspid valve chordae tendineae in the subcostal four-chamber view. RV right ventricle, LV left ventricle
Table 6.1
Suggested measurements
Measurements | Suggested views | Brief description | Abnormal | Illustrations |
|---|---|---|---|---|
Dimensions | ||||
RV dimensions | Apical four chamber, alternatively subcostal views | Measurements of RV chamber dimensions in end diastole should include the diameters above the tricuspid valve annulus and in the mid-RV cavity, as well as the distance from the TV annulus to the RV apex | RV basal >42 mm | Fig. 6.2 |
RV mid >35 mm | ||||
RV longitudinal >86 mm [11] | ||||
RV outflow tract | Parasternal three chamber and short axis | RVOT PLAX Prox >33 mm | Fig. 6.3 | |
RVOT PSAX Dist >27 mm [23] | ||||
RV thickness | Subcostal views | Subcostal four-chamber view for measurements of RV free wall thickness has demonstrated a higher reproducibility than other views | RV wall thickness >5 mm [14] | Fig. 6.4 |
RA dimension | Apical four chamber | RA end-systolic area >18 cm2 [23] | Fig. 6.9 | |
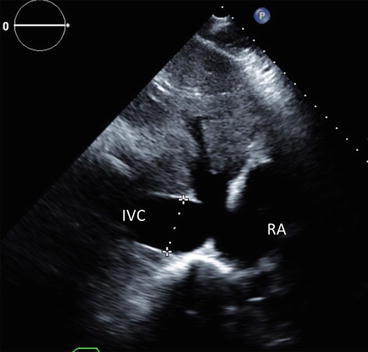
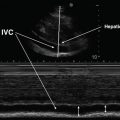
IVC dimension | Subcostal views | The subcostal view permits imaging and measurement of the IVC and also assesses inspiratory collapsibility. IVC diameter should be measured just proximal to the entrance of hepatic veins | Normal (3 mm Hg): <21 mm and >50 % collapsibility | Fig. 6.10 |
Intermediate (8 mm Hg): <21 mm and <50 % collapsibility or >21 mm and >50 % collapsibility | ||||
High (15 mm Hg): >21 mm and <50 % collapsibility [32] | ||||
RV function | ||||
TAPSE | Apical four chamber | With the M-mode cursor aligned through the anterior tricuspid annulus in the apical four- chamber view, longitudinal displacement of the annulus toward the apex during systole can be recorded | <16 mm [28] | Fig. 6.8 |
RV S’ | Apical four chamber | The sample volume is usually placed at or below the tricuspid annulus | <10 cm/s [25] | Fig. 6.7 |
FAC | Apical four chamber | Planimetry of the RV cavity area is traced across the TV annulus along the endocardium and then around the apex at the end-diastolic and end-systolic frames | <35 % [23] | Fig. 6.6 |
RV and pulmonary hemodynamics | ||||
sPAP | 4(TR velocity max)2 + RAP [33] | >40 mm Hg | Fig. 6.11 | |
mPAP | 4(early PI velocity)2 + RAP | >25 mm Hg | Fig. 6.11 | |
PVR | TR velocity (m/s) / TVI RVOT (cm) x 10 + 0.16 (Woods units) [46] | >3 Wood units | ||
Interventricular Septal Morphology
The normal septal curvature is convexed toward the RV cavity, imparting a crescentic shape to the RV in cross section. An acute rise in the pulmonary pressure may frequently occur in critically ill patients. In such conditions, during systole, the RV faces an increased resistance in the pulmonary vasculature. As a result, the RV contraction time becomes prolonged and continues past the beginning of the LV diastole. The LV relaxes, and the pressure inside it falls, while the RV pressure remains high. This difference transiently pushes the IVS to the left, into the LV. Such paradoxical septal wall motion can be readily appreciated on echocardiography, and it represents a distinct sign of RV systolic failure. In the PSAX, the LV assumes a progressively more D-shaped cavity as the ventricular septum flattens and progressively loses its convexity with respect to the center of the RV cavity during diastole. Although patients with relatively isolated RV volume overload have the most marked shift of the ventricular septum away from the center of the RV at end-diastole (with relatively more normal septal geometry at end-systole), patients with relatively isolated RV pressure overload have leftward septal shift away from the center of the RV at both end-systole and end-diastole, with the most marked deformation at end systole (Fig. 6.5) [1].
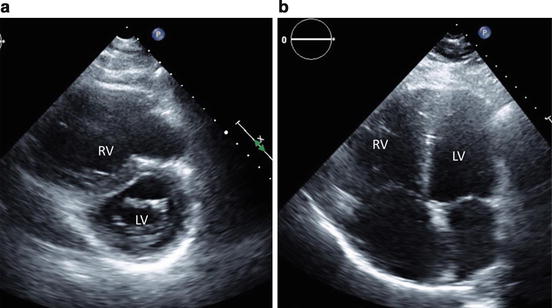
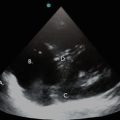
Fig. 6.5
Assessment of interventricular septum. (a) In the parasternal short-axis view, the left ventricle assumes a progressively more D-shaped cavity as the ventricular septum flattens and progressively loses its convexity with respect to the center of the RV cavity during diastole. (b) Paradoxical septal wall motion can be readily appreciated on apical four-chamber views, and it represents a distinct sign of RV systolic failure. PSAX parasternal long-axis, RV right ventricle, LV left ventricle
RV Systolic Function
A knowledge of RV systolic function may be essential in making hemodynamic decisions, considering thrombolysis in patients with PE and normal blood pressure [4], and in prognostication in RV infarction [15] and chronic cor pulmonale [16]. A visual gestalt of the contractility of the RV can be made by looking at the two major components of RV contraction: excursion of the free wall and the movement of the tricuspid annulus toward the apex. RV systolic function has been evaluated using several parameters, namely, myocardial performance (Right Ventricular Myocardial Performance Index or RIMP) [17], tissue Doppler velocity and tricuspid annular plane systolic excursion (TAPSE) [16], 2-D RV fractional area change (FAC) [18], 2-D RV ejection fraction (EF) [19], three-dimensional (3-D) RV EF [20], tissue Doppler-derived tricuspid lateral annular systolic velocity (S’) [21], and longitudinal strain and strain rate [22]. However, few are convenient and reliable for everyday use. The RV has a complex geometry that makes calculation of RV volume (and thus RV EF) by 2-D echo challenging. However, this limitation does not preclude alternative, non-volumetric methods of RV function assessment.
Fractional Area Change (FAC)
Two-dimensional FAC, defined as (end-diastolic area – end-systolic area)/end-diastolic area × 100, provides an estimate of RV systolic function. FAC is obtained by tracing the RV endocardium both in systole and diastole from the annulus, along the free wall to the apex, and then back to the annulus, along the interventricular septum (Fig. 6.6). Two-dimensional FAC <35 % indicates RV systolic dysfunction [23]. The RV FAC does not require geometric assumptions and correlates with the RV EF. However, incomplete visualization of the RV cavity (more common in the setting of RV enlargement) as well as suboptimal endocardial definition leads to relatively high inter- and intra-observer variability [24]. Nevertheless, FAC was found to correlate best with the reference standard of MRI-derived RV EF [18]. Reduced FAC also represents an independent predictor of death in patients with acute myocardial infarction and evidence of LV dysfunction [15].
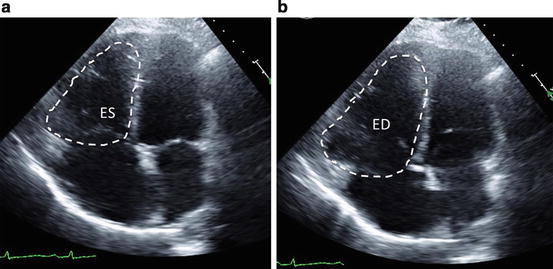
Fig. 6.6
Assessment of RV systolic function: fractional area change. Fractional area change is obtained by tracing the RV endocardium both in (a) end-systole and (b) end-diastole from the annulus, along the free wall to the apex, and then back to the annulus, along the interventricular septum. ES end-systole, ED end-diastole
S’ of the Tricuspid Annulus
Among the most reliably and reproducibly imaged regions of the right ventricle are the tricuspid annulus and the basal free wall segment. These regions can be assessed by pulsed tissue Doppler and color-coded tissue Doppler to measure the longitudinal velocity of excursion [25] (Fig. 6.7). This velocity has been termed the RV S’ or systolic excursion velocity. To perform this measure, an apical four-chamber window is used with a tissue Doppler mode region of interest highlighting the RV free wall. Certain echo platforms also allow for color-coded Doppler-derived S’ analysis offline. The pulsed Doppler sample volume is placed in either the tricuspid annulus or the middle of the basal segment of the RV free wall. A S’ <10 cm/s should raise the suspicion for abnormal RV function [21]. However, these measurements assume that the function of a single basal segment represents the function of the entire RV, which can be misleading in conditions that include regional wall motion abnormalities, such as RV infarction or PE. S’ appears to have prognostic value in different clinical scenarios including pulmonary hypertension [26] and inferior myocardial infarction [27].
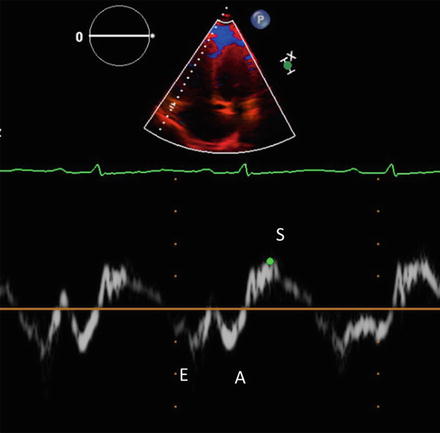
Fig. 6.7
Assessment of RV systolic function: RV S’ or systolic excursion velocity. An apical four-chamber window is used with a tissue Doppler mode region of interest highlighting the RV free wall at tricuspid annulus. S tissue Doppler velocity during systole, E tissue Doppler velocity during early ventricular filling, A tissue Doppler velocity during atrial contraction
Tricuspid Annular Plane Systolic Excursion (TAPSE)
The systolic movement of the base of the RV free wall provides one of the most visibly obvious movements on normal echocardiography. TAPSE is a method to measure the distance of systolic excursion of the RV annular segment along its longitudinal plane, from a standard apical four-chamber window. TAPSE is usually acquired by placing an M-mode cursor through the tricuspid annulus and measuring the amount of longitudinal motion of the annulus at peak systole (Fig. 6.8). TAPSE is simple, less dependent on optimal image quality, and reproducible, owing in part to the lack of reliance on RV endocardial definition or geometric assumptions, and it does not require sophisticated equipment or prolonged image analysis [28]. Therefore, it might represent the best validated tool to objectively assess RV function in the ICU setting with similar limitations concerning the assessment of possible regional dysfunction as described for S’. Current literature indicates that a TAPSE cutoff value <17 mm yielded a high specificity for diagnosis of RV dysfunction [29]. TAPSE has been shown to correlate well with MRI-derived RV EF [30], and values below 1.8 cm predict long-term mortality in patients with PH [16].
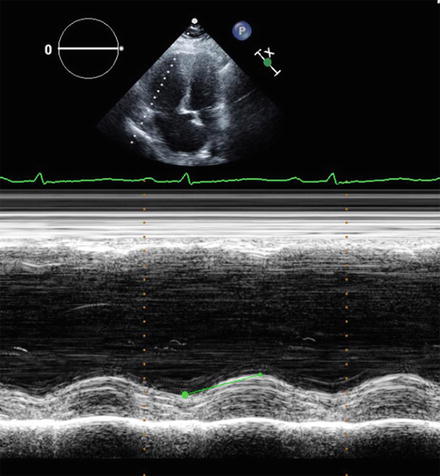
Fig. 6.8
Assessment of RV systolic function: tricuspid annular plane systolic excursion (TAPSE). TAPSE is acquired by placing an M-mode cursor through the tricuspid annulus and measuring the amount of longitudinal motion of the annulus at peak systole
Right Atrium
The primary transthoracic window for imaging the right atrium (RA) is the apical four-chamber view. From this window, RA area is estimated by planimetry, using an upper reference limit of 18 cm2 [23] (Fig. 6.9). Average indexed RA volume in healthy adults obtained by 2-D echo has been reported to be 16.76 ± 8.15 mL/m2 [31]; however, validated cutoff values associated with adverse outcomes have not been defined as of yet.
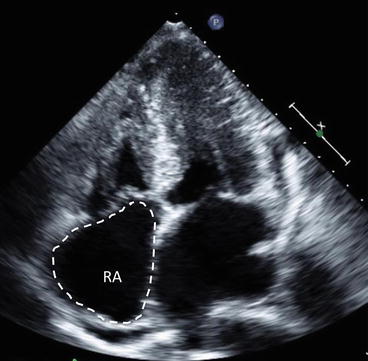
Fig. 6.9
Right atrial size measurement. RA area is estimated by planimetry in the apical four-chamber view. RA right atrium
Inferior Vena Cava (IVC) and RA Pressures
Estimation of right atrium pressure (RAP) is clinically relevant in many circumstances as an indicator of volume status and responsiveness to fluid challenge, as a sensitive diagnostic sign in patients with suspected cardiac tamponade, or as part of the echocardiographic estimation of PA pressures. The subcostal view permits imaging and measurement of the inferior vena cava (IVC) and also assesses inspiratory collapsibility. IVC diameter should be measured just proximal to the entrance of the hepatic veins (Fig. 6.10). For simplicity and uniformity of reporting, specific values of RA pressure, rather than ranges, should be used in the determination of systolic pulmonary artery pressure (SPAP). IVC diameter <2.1 cm that collapses >50 % with a sniff suggests a normal RA pressure of 3 mm Hg (range, 0–5 mm Hg), whereas IVC diameter > 2.1 cm that collapses < 50 % with a sniff suggests a high RA pressure of 15 mm Hg (range, 10–20 mm Hg) [32]. In scenarios in which IVC diameter and collapse do not fit this paradigm, an intermediate value of 8 mm Hg (range, 5–10 mm Hg) may be used. To accurately assess IVC collapse, the change in diameter of the IVC with a sniff and also with quiet respiration should be measured, ensuring that the change in diameter does not reflect a translation of the IVC into another plane.