Degenerative Disease of the Spine
Richard T. Kaplan
Leo F. Czervionke
Victor M. Haughton
Magnetic resonance (MR) has become the primary imaging modality for evaluation of degenerative disorders of the cervical, thoracic, and lumbosacral spine. The intervertebral disc, vertebrae, ligaments, spinal canal, and neural foramen may all be evaluated using MR techniques. Paramagnetic contrast agents are valuable for differentiating scar and recurrent disc herniation in the postoperative setting and occasionally are used preoperatively for detecting inflammatory processes that may accompany acute disc herniation, facet joint synovitis, and radiculitis.
This chapter deals with the spectrum of degenerative disease of the spine, including disc herniation, disc degeneration, spinal stenosis, spondylosis deformans, and osteoarthritis, and other degenerative disorders affecting the spinal column. The MR techniques used to image the spine are discussed. In addition, the significance of descriptive radiology terminology is noted, with the goal of stressing clinically significant imaging findings and reducing extraneous or irrelevant pseudo-quantification in radiology reports.
Magnetic Resonance Pulse Sequence Considerations
It is important to be aware of the MR pulse sequences available when designing protocols for examining the spine because the optimal MR technique will vary considerably, depending on the region of interest and on the pathologic process being studied.
In the lumbar spine, spin-echo (SE) and fast spin-echo (FSE) imaging sequences are optimal for evaluating degenerative spine disorders (Fig. 20.1). The major reason for the success of SE imaging in this region is that epidural and foraminal fat is abundant and stands out as high intensity on T1-weighted SE images compared with the relatively lower intensity of the adjacent thecal sac, herniated disc, or other tissue. On most T2-weighted gradient-recalled echo (GRE) and FSE images, the intensity of the epidural fat is similar to or less than that of CSF and does not always provide adequate contrast between the other tissues in the spinal canal. This is especially true in the lumbar neural foramen, where lateral herniated may be very difficult to visualize on T2-weighted FSE images and the same disc fragment is obvious on the T1-weighted SE image (Fig. 20.2).
Compared with the lumbar spine, the epidural space in the cervical and thoracic spine has little epidural fat. In the cervical spine, contrast is provided by the signal intensity differences related to the presence of prominent epidural veins and from CSF in the thecal sac. Therefore, GRE imaging is an important tool in the cervical spine for defining epidural disease. Furthermore, on conventional SE and FSE images, it is difficult to differentiate osteophytes from disc material. On GRE images, these can usually be easily differentiated because bone is markedly hypointense and disc is hyperintense, regardless of flip angle (Figs. 20.3 and 20.4) (1).
T2-weighted FSE images are routinely obtained in the sagittal and axial planes to evaluate the lumbar spine. These can be obtained in one-third to one-half of the acquisition time required for conventional T2-weighted SE sequences. FSE images are typically obtained using a multiple-echo pulse sequence with an effective echo time (TE) of approximately 100 ms. The relaxation time (TR) interval (determined by the patient’s heart rate) is generally in the range of 3,500 to 4,500 seconds. Axial T2-weighted FSE images are useful in the lumbar region to evaluate spinal canal size and particularly to evaluate the nerve roots of the cauda equina and the facet joints (Fig. 20.2). A major disadvantage of axial FSE imaging is the difficulty in differentiating disc from bone (Fig. 20.5). For this reason, GRE axial images are preferable to axial FSE images in the cervical spine. However, sagittal T2-weighted FSE techniques can produce images with exquisite spinal cord detail (Fig. 20.6) and are not nearly as sensitive to magnetic susceptibility artifacts as are GRE sequences. The use of fat-saturation techniques with FSE imaging can render active inflammatory conditions of the disc or facet joints more obvious.
Anatomic considerations also have an impact on the choice of MR pulse sequence. First, there is less of a need for ultrathin section, very high-resolution scans in the lumbar spine because disc spaces are relatively thick and foramina are large. In the cervical and thoracic spine, disc spaces are thinner and the neural foramina are smaller, so thinner slice thicknesses are necessary. Cervical spine imaging requires the use of contiguous slices, a factor that also favors GRE sequences, because contiguously acquired conventional SE scans may be degraded by cross-excitation artifacts (“cross-talk”) or necessitate very long scan times.
The sagittal plane is often adequate for demonstrating lumbar spine neural foramina because of the anatomic orientation of these canals, whereas the cervical foramina are obliquely oriented and require either oblique sectioning or three-dimensional (3D) reformatted images for optimal visualization.
Although computed tomography (CT) using thin sections (1 mm or less) and three-dimensional (3D) reformatting remains the gold standard for evaluation of the cervical neural foraminal stenosis, 3D FT GRE MR of the cervical neural foramen has become an acceptable alternative (Fig. 20.7). The 3D images are acquired using either T2*-weighted GRE or T1-weighted GRE (spoiled grass) sequences. The 3D spoiled grass (SPGR, GRE Medical Systems, Milwaukee, WI) sequence with intravenous gadolinium is especially valuable for evaluating the foramen because the epidural veins, prevalent in the cervical foramen,
enhance with paramagnetic contrast agents, whereas normal nerve roots do not enhance. However, the dorsal root ganglia do enhance with contrast because they lack a “blood–nerve barrier.” The size of the cervical neural foramina can be accurately evaluated, and any impinging osteophytes can be detected by using the 3D GRE technique (Fig. 20.8).
enhance with paramagnetic contrast agents, whereas normal nerve roots do not enhance. However, the dorsal root ganglia do enhance with contrast because they lack a “blood–nerve barrier.” The size of the cervical neural foramina can be accurately evaluated, and any impinging osteophytes can be detected by using the 3D GRE technique (Fig. 20.8).
 FIGURE 20.1 Appearance of an intervertebral disc on sagittal T1 spin-echo (A), T2 fast spin-echo (B), and fat-saturated T2 fast spin-echo images (C). The intervertebral disc has uniform intensity on the T1 spin-echo image. The nucleus (N) and inner annulus have relatively high intensity, whereas the outer annulus (O) has low intensity on T2 fast spin-echo images in panels B and C and on the axial T2 fast spin-echo image (D). The nucleus is brighter relative to the vertebral body on the fat-saturated image in panel C. |
Imaging Strategies
When imaging the lumbar spine with MR, SE/FSE sequences are generally the most useful for depicting the relevant anatomy. All patients evaluated for spinal disease should first be scanned with T1-weighted and T2-weighted (F)SE
sequences. In MR, one should capitalize on the ability to image the spine in multiple planes, which allows us to see the nerve roots in the foramina, the cephalocaudad extent of herniated disc material, and any changes in the disc architecture itself. In the lumbar spine, a 3- to 4-mm slice thickness is preferable for adequate resolution of the disc and neural foramen in the sagittal and axial planes. In the cervical and thoracic spine, a 2- to 3-mm slice thickness is necessary for routine sagittal and axial imaging. By virtue of more powerful gradients in state-of-the-art scanners as well as available 3-T systems, either very thin-section 2D GRE images or 3D volume reformatted images can optimally evaluate the cervical neural foramen.
sequences. In MR, one should capitalize on the ability to image the spine in multiple planes, which allows us to see the nerve roots in the foramina, the cephalocaudad extent of herniated disc material, and any changes in the disc architecture itself. In the lumbar spine, a 3- to 4-mm slice thickness is preferable for adequate resolution of the disc and neural foramen in the sagittal and axial planes. In the cervical and thoracic spine, a 2- to 3-mm slice thickness is necessary for routine sagittal and axial imaging. By virtue of more powerful gradients in state-of-the-art scanners as well as available 3-T systems, either very thin-section 2D GRE images or 3D volume reformatted images can optimally evaluate the cervical neural foramen.
 FIGURE 20.2 Lateral disc protrusion (arrow) at the L2–L3 level is easier to see on the T1-weighted image (A) but less conspicuous on the T2-weighted fast spin-echo image (B). |
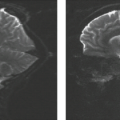
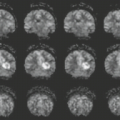
 FIGURE 20.3 Axial images through the cervical spine (three-dimensional Fourier transform gradient-echo magnetic resonance; 50/15/60, 30, 10, and 5 degrees) show that at a high flip angle, the cord is hyperintense and cerebrospinal fluid (CSF) is of low intensity. At 10 degrees the cord and surrounding CSF are isointense, and at 5 degrees the CSF is hyperintense to low-intensity cord. Note that neural foramina are clearly depicted on the 5-degree flip-angle image. Also note that bone is always of low intensity, whereas disc material is always of high intensity, regardless of flip angle. |
 FIGURE 20.4 A,B: Cervical spondylosis with osteophytes and bulging discs noted at multiple levels in gradient-echo images (panel A, echo time 9 ms; panel B, echo time 27 ms). Note that the osteophyte (white arrows) appears larger in panel B because of accentuation of its size by magnetic susceptibility artifact. This makes the spinal canal appear narrower in panel B than in panel A. Black arrows in panel A refer to posterior longitudinal ligament. |
 FIGURE 20.5 Cervical disc bulging shown on sagittal gradient echo (A) obtained with 30-degree flip angle and on corresponding sagittal T2-weighted fast spin echo (B). Because the intervertebral disc (white arrow) has high signal intensity in panel A compared with panel B, it is easier to differentiate the vertebral body from the disc material in panel A on the gradient echo. The spinal cord is visualized better in panel B, as is the thickened ligamentum flavum (black arrow). |
Coverage on the sagittal images should include the neural foramen bilaterally, and the conus medullaris must always be
imaged because it is not rare for a conus mass to present as radiculopathy or low back pain (Fig. 20.1). In the axial plane, the lumbar spine must be imaged with angled slices oriented parallel to each respective disc, and axial images should cover pedicle to pedicle through all lower lumbar intervertebral discs. However, nonangled contiguous axial image acquisition is preferable to angled sections for evaluation of the vertebrae, for spinal stenosis and pars interarticularis defects, and generally to avoid inadvertent omission of regions of the spine when selecting angled slices.
imaged because it is not rare for a conus mass to present as radiculopathy or low back pain (Fig. 20.1). In the axial plane, the lumbar spine must be imaged with angled slices oriented parallel to each respective disc, and axial images should cover pedicle to pedicle through all lower lumbar intervertebral discs. However, nonangled contiguous axial image acquisition is preferable to angled sections for evaluation of the vertebrae, for spinal stenosis and pars interarticularis defects, and generally to avoid inadvertent omission of regions of the spine when selecting angled slices.
 FIGURE 20.6 Comparison of sagittal T2-weighted fast spin-echo image (A) and gradient-echo image (B). The intervertebral discs have higher signal intensity relative to bone on the gradient-echo image. However, the spinal cord and ligaments are better visualized in panel A. |
T2-weighted FSE sequences are excellent for evaluating the spinal cord and cauda equina and for measuring the spinal canal. However, T2-weighted FSE sequences are less effective for evaluating bone marrow edema or marrow-infiltrating disease unless they are acquired with a fat-suppression technique or supplemented with STIR (short inversion-time inversion recovery) imaging. In the cervical spine, GRE images are more useful than FSE images in evaluating disc disease in axial plane. After cervical spine fusion or laminectomy, GRE images may be less useful due to their greater sensitivity to magnetic susceptibility artifact from metallic material. Using minimum TE and higher receiver bandwidth (e.g., 32 kHz), particularly with FSE acquisitions, one can minimize these artifacts.
In cervical and thoracic spine imaging, the initial sequence should include thin-section (3 mm), sagittal, T1-weighted, and T2-weighted scans with minimal or no interslice interval. Axial images should be performed using either 2D or 3D GRE techniques in the cervical spine, where a low flip angle is selected to generate high-intensity CSF (5-degree flip angle for 3D FT and 30-degree flip angle for 2D FT techniques). Aside from slice thickness, the benefit of GRE imaging in the cervical spine is more accurate distinction of disc material from osteophyte.
Thoracic spine imaging often is accomplished by the use of sagittal thin-section FSE images and is optimized with the concomitant use of saturation pulses and gradient moment nulling, as already discussed. In imaging for thoracic disc and spinal cord disease, T1-weighted SE and T2-weighted FSE sequences are obtained routinely. Axial images are optionally obtained if the sagittal scans show an abnormality. Herniated thoracic discs can be shown in axial plane on T1-weighted SE or T2-weighted FSE images.
It is important not only to evaluate the spinal column and associated structures, but also carefully to evaluate the paraspinal musculature for inflammation, localized muscle enlargement, or atrophy. Because the posterior paraspinal muscles are often partially obscured by the bright signal intensity related to the nearby surface coil, there is a tendency to overlook the paraspinal muscles in routine evaluation of MR spine images. Axial T2-weighted FSE images with fat saturation, inversion recovery with STIR, or contrast-enhanced T1-weighted images of the spine with fat saturation can be very helpful in revealing posterior
paraspinal muscular abnormalities or facet joint synovitis (Fig. 20.9). Obtaining these sequences is strongly recommended when patients have localized back pain or spinal instability and conventional MR imaging (MRI) of the spinal column structures fails to reveal the source of the pain. In cases of low back pain and normal or minor abnormal imaging findings on the lumbar spine MR study, one should consider evaluation of the lower thoracic spine, sacrum or the pelvic bone, and soft tissues. Care must be taken not to overlook occult sacral insufficiency fractures or a tumor of the lower pelvis or conus medullaris, which could be the source of the patient’s symptoms.
paraspinal muscular abnormalities or facet joint synovitis (Fig. 20.9). Obtaining these sequences is strongly recommended when patients have localized back pain or spinal instability and conventional MR imaging (MRI) of the spinal column structures fails to reveal the source of the pain. In cases of low back pain and normal or minor abnormal imaging findings on the lumbar spine MR study, one should consider evaluation of the lower thoracic spine, sacrum or the pelvic bone, and soft tissues. Care must be taken not to overlook occult sacral insufficiency fractures or a tumor of the lower pelvis or conus medullaris, which could be the source of the patient’s symptoms.
 FIGURE 20.7 Three-dimensional Fourier transform images showing a herniated disc (large arrow) at the C5–C6 level to the left of midline. Note that the cervical neural foramen is well shown on two image slices. The site of annular tear (small arrow) is also well shown. However, there is poor differentiation between the cervical spinal cord and the cerebrospinal fluid despite the 5-degree flip angle used. |
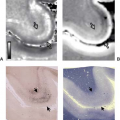
 FIGURE 20.8 Evaluation of cervical neural foramen using three-dimensional (3D) Fourier transform imaging in axial 3D gradient-echo image (A) with a 1-mm slice thickness and 5-degree flip angle. The neural foramen (between arrows) is well demonstrated, and there is adequate contrast between the cerebrospinal fluid and the spinal cord. In axial 3D spoiled grass (B) after administration of intravenous gadolinium-diethylenetriamine penta-acetic acid, the epidural venous network and other connective tissues enhance, surrounding the nerve root and nerve root sheath in the neural foramen (arrows). C: Reformatted 45-degree oblique coronal image with gadolinium enhancement demonstrates the size of the neural foramen and indicates the presence of mild neural foraminal narrowing (arrows) at the C5–C6 level on the left due to uncinate and facet hypertrophy. |
 FIGURE 20.9 Facet synovitis, C4–C5 left. Unenhanced axial T2 fast spin-echo image with fat saturation (A) shows hyperintense signal in the lamina (wavy arrow), articular facets, and surrounding soft tissues (arrows). The same areas enhance (arrows) on gadolinium-enhanced T1 spin-echo image (B) obtained with fat saturation. The findings could be seen in sterile or infectious synovitis. |
Anatomy of the Intervertebral Disc
The intervertebral disc is a complex structure consisting of several highly specialized connective tissues (2). A combination of hyaline cartilage, fibrocartilage, mucopolysaccharide, and dense collagenous fibrous tissue gives the discs the properties that confer flexibility and stability to the spine (3). The disc structure is usually described in terms of three components: the cartilaginous endplate, nucleus pulposus, and annulus fibrosus.
The cartilaginous endplate is a layer of hyaline cartilage that covers most of the vertebral endplate (Fig. 20.10). Surrounding the cartilaginous endplate is a ring of dense bone—the ring apophysis—that fuses to the vertebra in the second decade of life. The cartilaginous endplate attaches firmly to the osseous endplate by means of numerous collagenous fibers and strengthens the osseous endplate, which contains multiple perforations. Because of the perforations, Schmorl suggested that it should be classified with cancellous bone. Within the pores of the vertebral endplate are numerous vascular channels, which are the major source for the nutrients and, during imaging studies, the contrast medium, which diffuses into the disc (Fig. 20.11) (4,5). With degeneration of the disc, the perforations become less well defined and less conspicuous. One of the theories of disc degeneration is that endplate changes that impair diffusion into and out of the disc hinder the function of chondrocytes and fibroblasts in the disc.
The annulus fibrosus is a complex fibrous and fibrocartilaginous structure that consists of 12 to 15 layers, each with well-developed dense parallel fibrous bands (6) (Fig. 20.10). For descriptive purposes, it can be divided into outer and inner rings. The outer ring contains the densest fibrous lamellae. The fibers in this portion of the annulus originate and insert in the compact cortical bone in the ring apophysis (Fig. 20.12). These
fibers, because of their osseous attachments, may be described as Sharpey fibers after the English anatomist who described the collagenous structure of bone. The lamellae consist almost exclusively of dense type I collagen with little ground substance, unlike other portions of the disc. This portion of the disc on T2- or T1-weighted images has a low signal intensity (Fig. 20.13). The approximately 8,000 cells in each cubic millimeter of tissue within the outer ring of the annulus are almost exclusively fibroblasts. The outer annulus is thicker anteriorly than posteriorly.
fibers, because of their osseous attachments, may be described as Sharpey fibers after the English anatomist who described the collagenous structure of bone. The lamellae consist almost exclusively of dense type I collagen with little ground substance, unlike other portions of the disc. This portion of the disc on T2- or T1-weighted images has a low signal intensity (Fig. 20.13). The approximately 8,000 cells in each cubic millimeter of tissue within the outer ring of the annulus are almost exclusively fibroblasts. The outer annulus is thicker anteriorly than posteriorly.
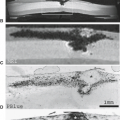
 FIGURE 20.10 Sagittal anatomic section through a normal lumbar intervertebral disc illustrating the cartilaginous endplate (arrowheads), the annulus fibrosus (A), nucleus pulposus (N), ring apophysis (white arrows), anterior longitudinal ligament (black arrows), and adjacent vertebral bodies. |
 FIGURE 20.11 Sagittal magnetic resonance images of a rabbit spine obtained before (A) and at 30 (B) and 120 (C) minutes after intravenous administration of gadoteridol, 0.3 mmol/kg. Note that contrast enhancement is evident first at the endplate (arrows, B) and then throughout the intervertebral disc (C). |
 FIGURE 20.12 Sagittal anatomic section of the L5–S1 intervertebral disc illustrating a dense collagenous lamellar structure in the peripheral annulus fibrosus (arrows). These dense fibers originate and insert in the ring apophysis. Medial to this dense collagenous structure is the central portion of the annulus fibrosus with a less well-defined lamellar structure and fibrocartilage. The nucleus pulposus occupies a small portion of the intervertebral disc. The dark pigment (P) stains part of the nucleus and the inner annulus. |
The inner ring of the annulus fibrosus contains fibrocartilage. Unlike the outer ring of the annulus, the inner ring contains predominantly chondrocytes and has plentiful ground substance. The collagen in the inner ring is less plentiful than in the outer ring. Because of the ground substance, the inner ring has a high signal intensity like the nucleus pulposus on T2-weighted images (Fig. 20.13) (7). The lamellae are less well defined and less fibrous than in the peripheral ring. The lamellae become less and less well defined toward the center of the disc. As the lamellar structure changes, the annulus becomes gradually less and less distinguishable from the nucleus pulposus (Fig. 20.14). The fibers in each layer of the inner or outer annulus run radially at an angle of about 30 degrees with respect to the endplates. Fibers in adjacent lamellae are nearly perpendicular to each other.
 FIGURE 20.13 Comparison of a sagittal anatomic section (A) with the exact corresponding magnetic resonance image (B) (repetition time 2,000 seconds, echo time 80 ms, spin echo). Note that the peripheral annulus has a low signal intensity (arrows), whereas the inner annulus and the nucleus pulposus, which have a mucopolysaccharide matrix, have a higher signal intensity. The lower signal intensity in the equator of the nucleus and annulus (arrowheads) is due to a higher concentration of collagen. |
 FIGURE 20.14 Axial cryomicrotome section through the L3–L4 intervertebral disc. No clear distinction exists between the inner annulus and nucleus pulposus. Concentric fiber bundles make up the outer annulus. The posterior disc margin is concave and does not deform the thecal sac. 1, Inner annulus; 2, outer annulus; 3, ligamentum flavum; 4, nucleus pulposus; 5, thecal sac containing cauda equina nerve rootlets; 6, epidural fat. |
The nucleus pulposus is also composed of fibrocartilage. It has approximately the same amount of ground substance as the inner annulus and approximately the same signal intensity as the inner annulus on T2-weighted images (Fig. 20.13). The collagen present in the nucleus is type II, which is stronger in compression and weaker in tension than type I. The collagen
in the nucleus is less well structured than in the annulus, giving it an amorphous appearance rather than a lamellar structure. The equator of the disc contains a higher collagen concentration than the remainder of the disc. The region of greater collagen concentration has a lower signal intensity than the remainder of the disc on T2-weighted images (Fig. 20.12) (7). The ground substance in the nucleus pulposus consists of hyaluronic acid and glycosaminoglycans, which contain the polysaccharides keratin and chondroitin sulfate. These substances have a high concentration of fixed negative charges that cause the disc to absorb water even in the presence of a high-pressure gradient (8). The mucopolysaccharide gel in the nucleus pulposus gives the disc its high intrinsic pressure, which allows it to resist compressive forces. When the nucleus is removed from the disc, it readily absorbs water and expands. Water in the disc is normally determined by the intradiscal pressure and the capacity of the disc to absorb water. When the load on the disc increases, water leaves the disc, and when the intradiscal pressure diminishes, water returns (9). These changes in water content result in a diurnal variation in height. The glycosaminoglycans are synthesized by the chondrocytes present in the nucleus pulposus. Diffusion through the vertebral endplates provides the nutrients necessary for the metabolism and function of these cells (5).
in the nucleus is less well structured than in the annulus, giving it an amorphous appearance rather than a lamellar structure. The equator of the disc contains a higher collagen concentration than the remainder of the disc. The region of greater collagen concentration has a lower signal intensity than the remainder of the disc on T2-weighted images (Fig. 20.12) (7). The ground substance in the nucleus pulposus consists of hyaluronic acid and glycosaminoglycans, which contain the polysaccharides keratin and chondroitin sulfate. These substances have a high concentration of fixed negative charges that cause the disc to absorb water even in the presence of a high-pressure gradient (8). The mucopolysaccharide gel in the nucleus pulposus gives the disc its high intrinsic pressure, which allows it to resist compressive forces. When the nucleus is removed from the disc, it readily absorbs water and expands. Water in the disc is normally determined by the intradiscal pressure and the capacity of the disc to absorb water. When the load on the disc increases, water leaves the disc, and when the intradiscal pressure diminishes, water returns (9). These changes in water content result in a diurnal variation in height. The glycosaminoglycans are synthesized by the chondrocytes present in the nucleus pulposus. Diffusion through the vertebral endplates provides the nutrients necessary for the metabolism and function of these cells (5).
The composition of the fibrocartilage in the intervertebral disc explains the observed phenomenon of contrast enhancement. Normally, with doses of contrast medium in the range of 0.1 mmol/kg and images obtained promptly after intravenous injection of contrast medium, enhancement is not observed in the intervertebral disc. With larger doses of contrast medium and with longer elapsed times before imaging, enhancement may be observed because of the slow accumulation of contrast medium by diffusion (4). The enhancement is observed first near the periphery of the disc and subsequently near the center (Fig. 20.11). Enhancement is greater when nonionic contrast media such as gadoteridol or gadodiamide are used because diffusion of the ionic medium is hindered by the fixed negative charges in the intervertebral disc (Fig. 20.15) (10).
The anterior longitudinal ligament (ALL) and posterior longitudinal ligament (PLL), although not normally considered part of the disc, are not easily distinguished from the disc (Fig. 20.14). The ALL, consisting of fibroblasts and collagen, forms a thin layer over the anterior and lateral surfaces of the disc (Fig. 20.10). Its fibers are in contact with the outermost layer of the annulus fibrosus. It contains some fibers that originate and insert in the compact cortical bone in the vertical portion of the vertebrae. The low signal intensity of the PLL is difficult to distinguish from the low signal intensity of the peripheral annulus fibrosus in either T1- or T2-weighted MR. The PLL has a similar composition and signal intensity. The thin band of collagenous fibers in the PLL is difficult to distinguish from the annulus fibrosus along the posterior aspect of the disc (Fig. 20.10). At the intervertebral disc level the fibers of the PLL diverge, have a horizontal orientation, and merge with the fibers of the annulus fibrosus. Between disc spaces, the PLL has mostly longitudinally oriented fibers. It forms a band approximately 1 mm thick and 3 mm wide between intervertebral discs, posterior to the retrovertebral plexus and ventral to the dural sac.
 FIGURE 20.15 Contrast enhancement of normal rabbit intervertebral discs after the administration of a nonionic or ionic gadolinium-containing chelate (0.3 mmol/kg). Contrast enhancement is greater from nonionic ProHance or Omniscan than for the ionic Magnevist. |
The disc normally lacks innervation and vascularity. Nerves, which may be nociceptors, have been identified in the ALL and PLL, in the facet joints, in the vertebral endplates, and arguably in the peripheral layer of the annulus fibrosus (3). Therefore, the disc is not normally a source of pain, although degeneration in the disc may lead to pain by means of stretching of nociceptor and nerve compression of the production of inflammation. Blood vessels are not normally found in cartilage. The nutrition of the intervertebral disc, as in other cartilaginous structures, is provided by diffusion.
Age-Related Changes in the Intervertebral Disc
The intervertebral disc undergoes marked changes with aging, which should be distinguished from the changes due to degeneration of the intervertebral disc (9,11,12,13,14). When age-related and degenerative changes are not distinguished, the incidence of degeneration is grossly exaggerated. The incidence of intervertebral disc degeneration increases with age, but most intervertebral discs in normal individuals do not show the changes in height, signal intensity, and morphology that characterize degenerating intervertebral discs. Despite increasing numbers of small tears and amount of pigment and collagen and decreasing amounts of glycosaminoglycans in the nucleus pulposus, most discs retain normal biomechanical function into the seventh and eighth decades of life (6,13). The magnitude of the age-related changes in the intervertebral disc can be illustrated by comparing the appearance of the neonatal, transitional and young-adult, and older-adult intervertebral discs.
In the neonate, with an incompletely ossified vertebral body, the space between vertebrae appears large. A portion of that space consists of unossified cartilaginous vertebral body. The disc itself contains a thin peripheral rim with a distinct lamellar structure, which corresponds to the peripheral annulus fibrosus (Fig. 20.16). This annular rim and the ossification centers in the vertebrae have low signal intensity on T1- and T2-weighted images. The remainder of the disc has moderately high signal intensity (15). Medial to the peripheral annulus is a thin layer of tissue with little lamellar structure that grossly has the same appearance as vertebral cartilage. It represents the inner portion of the annulus fibrosus. The remainder of the disc consists of a translucent substance—the nucleus pulposus. In the equator of the disc are thin streaks of tissue with syncytial cells that are remnants of the primitive notochord (13). The nucleus and annulus are sharply demarcated in the newborn. On gross inspection, vessels are evident in the vertebral cartilage near the future ring apophysis and in the ossifying center of the vertebra (Fig. 20.16). Otherwise, the disc appears avascular as in the adult.
 FIGURE 20.16 In the cryomicrotome (A) and magnetic resonance image (B) of the neonatal intervertebral disc, the unossified portion, small vascular channels can be identified (arrows). The annulus and nucleus are sharply demarcated. In the peripheral annulus, a lamellar structure is evident. |
During the first two decades of life, the disc develops the fibrous structure that characterizes the adult disc (16). During the second decade of life, the intervertebral disc can be characterized as transitional between the newborn and the adult disc. The transitional disc has lamellae of fibrocartilage with a distinct fibrous structure. The nucleus pulposus, which has an ill-defined border within the annulus, has become opaque rather than translucent because of the development of collagen fibers within it. The collagen content of the inner annulus and the equator of the disc has increased to the degree that these regions are less translucent and lower in signal intensity on T2-weighted MR (Fig. 20.17). The vertebral body and the ring apophysis have not yet ossified completely. On MR, the marked difference in signal intensity between the fibrous and fibrocartilaginous portions of the disc is evident.
Once the adult intervertebral disc has appeared, it continues to change with age. With aging, small concentric and transverse tears develop in the annulus (Fig. 20.18) (14,16). The former is characterized as delamination of the lamellae in the annulus fibrosus with the development of a mucoid substance or fluid in the space. These tears may be visualized on MR as a narrow band of higher-intensity signal, indicating the location of the mucoid substance or fluid. The latter are short disruptions in the annulus near the insertion of Sharpey fibers into the ring apophysis. These may be visualized on MR or CT as small collections of fluid. Rarely, gas may be identified in these tears. Both types of tears are common in adult discs with or without other signs of degeneration. These are, therefore, aging changes rather than degenerative changes.
 FIGURE 20.17 Sagittal anatomic image of the spine of a 13-year-old child. Note the decreased translucency of the nucleus pulposus. |
With aging, the composition of the intervertebral disc changes (8,17). Collagen increases and glycosaminoglycans decrease in the disc. These changes result in a lower affinity of the disc for water and therefore a decrease in the water content of the disc. The water content of the disc may diminish by 10% or 15% over five decades. Therefore, with aging the signal intensity of the disc diminishes by a few percent. Loss of the normal high signal intensity on T2-weighted images or loss of the normal intervertebral disc height is, however, not explained entirely by aging.
Anatomy of the Articular Facets
The facet joint is a true synovial-lined joint that allows the spine to bend. The plane of the facet joint varies from a near-sagittal plane in the cervical spine to an oblique coronal orientation in the thoracic and lumbar spine. The facet is the surface of the inferior or superior articular process. Each apposing facet is composed of a thin uniform layer of dense cortical bone and an overlying layer of cartilage. The facet joint in young normal persons contains a meniscus that usually disappears after the age of 40 years. The facet joint is lined by synovium. Anteriorly, the facet joint has no capsule and is bound only by the ligamentum flavum (18). The synovium anteriorly extends a variable distance posterior to the ligamentum flavum. In fact, the space posterior to the ligamentum flavum should be considered an extension of the facet joint. When the ligamentum flavum degenerates, the synovial-lined space posterior to the ligamentum flavum may distend and form a discrete synovial-lined cyst that can impinge on the thecal sac. Posteriorly, the facet joint is lined by a broad, thick, fibrous capsule.
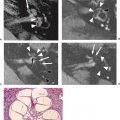
 FIGURE 20.18 Sagittal anatomic and magnetic resonance images. A: Sagittal cryomicrotome section of lower lumbar spine in an adult. With advancing age, the disc loses water and becomes fibrotic (1). A more normal disc is seen at the L5–S1 level. There are early degenerative changes seen in the nucleus pulposus at this level. The normal annulus fibrosus has 12 to 15 concentric lamellae (5). 1, Degenerated L4–5 disc; 2, L% vertebral body; 3, anterior longitudinal ligament; 4, Sharpey fibers; 5, anterior annulus; 6, posterior longitudinal ligament; 7, cartilaginous endplate; 8, nucleus pulposus. B: Sagittal anatomic sections illustrating transverse (arrow) and concentric tears (arrowheads) that develop in many older intervertebral discs. For comparison, a radial tear is illustrated (open arrows) at levels where disc degeneration is present. |
Degeneration of the Intervertebral Disc
The pathogenesis of intervertebral disc degeneration is not well understood. Trauma is not likely the major factor in disc degeneration. Epidemiologic studies show that a history of trauma is obtained in some patients with herniated intervertebral discs. Biomechanical studies show that the disc is less likely than the vertebral body to fail as the result of trauma (19). Repetitive cyclical loading of the disc may result in failure of annular fibers (20). Decreasing permeability of the vertebral endplates has been suggested as a cause for disc degeneration.
Despite the lack of consensus on the cause of disc degeneration, one morphologic feature characterizes discs with herniations, bulging, loss of height, and loss of signal intensity (21,22). The annular fissure (formerly tear), which is found consistently with the other degenerative changes in the intervertebral disc, is characterized in the biomechanical engineering studies of the disc as a primary failure of the annulus (23,24). Annular fissures are sometimes classified by their orientation (Fig. 20.19). The radial fissure involves all layers of the annulus fibrosus in its anterior, posterior, or possibly lateral portion (Figs. 20.18 and 20.20). The annular fissure can be seen effectively with precise anatomic sectioning techniques such as cryomicrotomy. It may be detected by MR as a band of high–signal-intensity tissue in the region of the disc normally characterized by low signal intensity (Fig. 20.21). It may also be visualized on contrast-enhanced MR as a strip of enhancement in the normally nonenhancing disc (Figs. 20.22 and 20.23). The annular fissure may, therefore, be a marker of disc degeneration. MR is less sensitive than cryomicrotomy or discography in detecting radial fissures (Fig. 20.24).
 FIGURE 20.19 Fissures of the annulus fibrosus. Fissures of the annulus fibrosus occur as radial (R), transverse (T), and/or concentric (C) separations of fibers of the annulus. The transverse fissure depicted is a fully developed, horizontally oriented radial fissure; the term “transverse fissure” is often applied to a less extensive separation limited to the peripheral annulus and its bony attachments. (From Fardon DF, Williams AL, Dohring EJ, et al. Lumbar disc nomenclature: version 2.0. Recommendations of the combined task forces of the North American Spine Society, American Society of Spine Radiology, and American Society of Neuroradiology. Spine J 2014;14:2525–2545 with permission.) |
 |
 FIGURE 20.21 A: Annular fissures posteriorly (arrows) at L4–L5 and L5–S1 levels in sagittal T2 fast spin-echo image. B: L4–L5 (arrow annular fissure) shown on axial gradient-echo image. |
 FIGURE 20.22 Sagittal T1-weighted spin-echo image after intravenous administration of gadolinium demonstrates enhancement in a posterior annular fissure (arrows) at the L4–L5 level. |
 FIGURE 20.23 A composite of a T1-weighted spin-echo image (A), a contrast-enhanced and fat-suppressed T1-weighted image (B), and a T2-weighted image (C) illustrating an annular fissure at L4–L5 characterized by contrast enhancement and high signal intensity in T2-weighted images. |
 FIGURE 20.24 Discogram (A) shows extravasation of contrast (arrow) through a posterior annular tear. Postdiscogram axial CT (B) shows a posterior annular tear (arrows) with extravasation along the posterior disc margin. |
Magnetic Resonance of Disc Degeneration
As a disc degenerates it loses water, fissures develop in the annulus, and the structural integrity of the annulus becomes compromised (Fig. 20.25). On MR, these changes are manifested as a decrease in disc space height and decreased signal intensity on T2-weighted image (Fig. 20.26) which may or may not be associated with disc bulging. It has been proposed that intervertebral disks that have diminished T2 signal intensity without evidence of disk collapse, herniation, or bulging differ from normal disks not only in water content but also in gross morphology, biochemistry, and biomechanics, and have the potential to cause low back or leg pain (25). In severe disc degeneration, the disc is collapsed and often contains gas (believed to be nitrogen), which is low intensity on T1- and T2-weighted images. Intradiscal gas is more obvious on T2*-weighted GRE images because of signal intensity loss related to magnetic susceptibility effects. CT is more sensitive than MR for detecting gas in a severely degenerating facet or intervertebral disc (Fig. 20.27).
Another characteristic of disc degeneration (intervertebral osteochondrosis) is alterations of the adjacent vertebral body architecture (Fig. 20.28). Affected vertebrae show increased density (“discogenic sclerosis”) on radiographs and CT. The MR appearance of degenerative discogenic vertebral changes has been classified (see Table 20.1) (Fig. 20.29 and 20.30) (14). While there is no consensus as to the clinical significance of the described “types” of marrow change within such a classification, type 1 changes have been reported as being associated with active low back symptoms and segmental instability (26). As vertebral endplates in type I or II may enhance with gadolinium contrast, it is most important to avoid confusion with less benign diseases like infection or metastases (Table 20.1).
Intervertebral Disc Infection
Intervertebral discitis is an inflammatory condition resulting in disc and vertebral endplate destruction and usually osteomyelitis in the adjacent vertebral bodies. In adults, the process is caused by infection that initially involves the cancellous bone
adjacent to the vertebral endplate, as the endplate is destroyed, the disc is destroyed, and fluid accumulates in the disc space. A paraspinal mass is often present at the affected level, but 25% also have other disc levels involved.
adjacent to the vertebral endplate, as the endplate is destroyed, the disc is destroyed, and fluid accumulates in the disc space. A paraspinal mass is often present at the affected level, but 25% also have other disc levels involved.
 FIGURE 20.25 Anatomic (A) and exactly correlating magnetic resonance (B) illustrating degenerative changes associated with a radial tear of the annulus fibrosus in a cadaver. At L4–L5, the intervertebral disc has diminished height, diminished signal intensity, and slight bulging of the posterior annulus. The radial tear (arrow) is evident on the anatomic sections as a dark band extending through the annulus. |
 FIGURE 20.26 Sagittal T2-weighted spin-echo image showing early degenerative disc disease at L4–L5 and marked signal intensity loss in the intervertebral disc at L5–S1 indicating advanced disc degeneration at this level. A posterior radial tear (arrows) has high signal intensity relative to adjacent bone and degenerating disc. |
On T1-weighted images, the vertebral body endplates in discitis are hypointense and sometimes slightly hyperintense, and the endplate cortex is ill defined or destroyed. The signal intensity within the disc is decreased on T1-weighted images but is almost always increased on T2-weighted images with discitis (Fig. 20.31). This is an important differential diagnostic point because in uncomplicated degenerative discogenic disease, the intervertebral disc has low signal intensity (27). Rudimentary or underdeveloped discs also appear to be slightly hyperintense on T2-weighted images, but the endplates are intact in this situation.
Vertebral osteomyelitis, seen as high signal intensity on T2-weighted images, often enhances intensely with paramagnetic contrast (Fig. 20.32). Endplate enhancement due to degenerative disease tends to be subtler unless a fat suppression technique is used. The intervertebral disc itself typically enhances intensely in discitis unless the disc space contains fluid sequestered from the contrast agent (Figs. 20.33 and 20.34). An inflammatory paraspinal and peridiscal mass usually accompanies discitis, and the paraspinal mass enhances with paramagnetic contrast. In chronic osteomyelitis and discitis, the disc space can be totally obliterated.
 FIGURE 20.27 Vacuum disc, vertebral subluxation at L4–L5, and degenerative discogenic vertebral disease. A: Computed tomography demonstrates gas in the L4–L5 intervertebral disc. Sagittal T1-weighted spin-echo image (B) and gradient-echo image (C) demonstrate gas (long arrow) in the L4–L5 disc, which has low signal intensity. Type I degenerative vertebral disease (small arrows) is seen in the adjacent vertebrae. Note anterior subluxation of L4 on L5. |
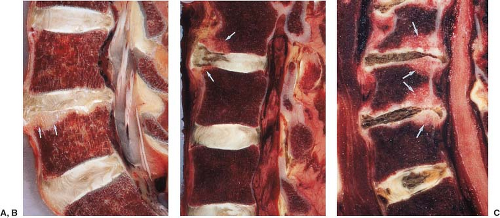 FIGURE 20.28 Vertebral marrow and endplate changes associated with degenerative disc disease. In the vertebrae adjacent to a degenerating L4–L5 disc (A), fatty degeneration (arrows) is noted in the marrow. A different type of reaction characterized by fibrosis and hyperemia of the marrow (arrows) is noted adjacent to another degenerating intervertebral disc with a radial tear (B). Sclerosis of the adjacent vertebral endplates (arrows) is illustrated by this anatomic section through the cervical spine (C). |
TABLE 20.1 Modic Classification of Vertebral End Plate Bone Marrow Degenerative Changes | ||||||||||||||||
|---|---|---|---|---|---|---|---|---|---|---|---|---|---|---|---|---|
|
 FIGURE 20.29 Type II discogenic vertebral disease. The distorted vertebral architecture (arrows) has high intensity on T1-weighted (A) and T2-weighted (B) spin-echo images. Loss of signal intensity in the intervertebral disc at L4–L5 and L5–S1 indicates disc degeneration. |
 FIGURE 20.30 Modic type 2 endplate bone marrow signal changes (black arrowheads). L5–S1 disc extrusion compressing thecal sac (white arrows). Mixed areas of low signal with the disc herniation may reflect annular material and possibly bone. |
 FIGURE 20.31 L2–L3 disc space infection and osteomyelitis. The vertebral endplates are destroyed and the adjacent vertebral bodies have abnormal signal intensity secondary to osteomyelitis on T1-weighted sagittal spin-echo image (A) and T2-weighted fast spin-echo image (B). The infected disc space (small arrows) has higher intensity than normal intervertebral disc. |
 FIGURE 20.32 Enhancing degenerative endplate disease. Unenhanced image (A) shows low signal intensity (arrow) in the vertebral bodies adjacent to the degenerating L5–S1 disc. Gadolinium-enhanced image (B) shows subtle enhancement in the adjacent endplates and vertebral body but no appreciable enhancement of the intervertebral disc itself. |
 FIGURE 20.33 Intense enhancement of vertebral endplates and vertebral bodies adjacent to degenerating disc at C5–C6. A: Unenhanced image shows low signal intensity in the vertebral bodies adjacent to the C5–C6 disc. B: Intense enhancement (arrows) in C5 and C6 vertebral bodies adjacent to the disc is accentuated by the fat suppression technique. The intervertebral disc endplates appear intact. |
Classification of Lumbar Disc Pathology
The terms used to describe bulging and herniated discs have historically been somewhat confusing and widely misused. It is important to understand first the morphologic classification of the various degrees of disc displacement and then to adopt a practical working classification for reporting purposes. In 2001 and more recently revised in 2014, combined task forces of North American Spine Society, American Society of Spine Radiology, and American Society of Neuroradiology published recommendations to standardize nomenclature and classification of lumbar disc pathology (28). The main nomenclature and classification recommendations are as follows (Figs. 20.35 and 20.36):
Disc bulge. A disc bulge represents a disc in which the contour of the outer annulus extends, or appears to extend, in the horizontal (axial) plane beyond the edges of the disc space, usually greater than 25% (90 degrees) of the circumference of the disc and usually less than 3 mm beyond the edges of the vertebral body apophyses (Fig. 20.2). This occurs due to tears in the oblique collagen bridges between the concentric annular fibers (Fig. 20.37), producing diffuse laxity of the annulus. The concentric annular fibers remain intact (Fig. 20.38). The MR appearance of disc bulging is symmetric uniform extension of the outer disc margin circumferentially (Fig. 20.39). An asymmetric disc bulge is the presence of more than 25% of the outer annulus beyond the perimeter of the adjacent vertebrae, more evident in one section of the periphery of the disc than another, but not sufficiently focal to be characterized as a protrusion (Fig. 20.2). A disc bulge by definition is not a herniation.

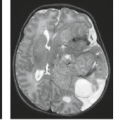
FIGURE 20.34 A: Disc space infection, osteomyelitis, and epidural abscess (arrows) at T12–L1 level compresses the conus medullaris. B: Note intense enhancement of the vertebral bodies and vertebral endplates. A thin, dark band of nonenhancement at the disc space level in panel B probably represents fluid in the disc space that is sequestered from the blood supply.

FIGURE 20.35 Graphical depiction of a normal lubar disc. Axial (left) and sagittal (right) images demonstrate that the normal disc, composed of central nucleus pulposus (NP) and peripheral annulus fibrosis (AF), is wholly within the boundaries of the disc space, as defined craniad and caudad by the vertebral body end plates and peripherally by the planes of the outer edges of the vertebral apophyses, exclusive of ostephytes. (From Fardon DF, Williams AL, Dohring EJ, et al. Lumbar disc nomenclature: version 2.0. Recommendations of the combined task forces of the North American Spine Society, American Society of Spine Radiology, and American Society of Neuroradiology. Spine J 2014;14:2525–2545, with permission.)

FIGURE 20.36 (Left) Normal disc for comparison; no disc material extends beyond the periphery of the disc space, depicted here by the broken line. (Middle) Symmetric bulging disc; annular tissue extends, usually by less than 3 mm, beyond the edges of the vertebral apophyses symmetrically throughout the circumference of the disc. (Bottom) Asymmetric bulging disc; annular tissue extends beyond the edges of the vertebral apophysis, asymmetrically greater than 25% of the circumference of the disc. (From Fardon DF, Williams AL, Dohring EJ, et al. Lumbar disc nomenclature: version 2.0. Recommendations of the combined task forces of the North American Spine Society, American Society of Spine Radiology, and American Society of Neuroradiology. Spine J 2014;14:2525–2545, with permission.)

FIGURE 20.37 Sagittal cryomicrotome image through the anterior portion of the L4–L5 intervertebral disc demonstrating nucleus pulposus (N), inner annulus (IA), and cartilaginous endplate (CE); vertically oriented annular fibers are called concentric fibers. These are joined by oblique and transverse collagen bridges (cb). Densely compacted outer collagen fibers (cf) are called Sharpey fibers (S). ALL, anterior longitudinal ligament; BE, vertebral body endplate.

FIGURE 20.38 Axial cryomicrotome section through the L3–L4 disc. The disc bulges diffusely in all directions and has a flattened or slightly convex posterior margin (1). 2, Anterior epidural venous space; 3, superior articular process of L4; 4, inferior articular cartilage of L3; 5, nerve root; 6, superior articular cartilage L4; 7, inferior articular process; 8, ligamentum flavum.
Disc herniation. A disc herniation is localized or focal displacement of disc material beyond the normal margin of the intervertebral disc space. Localized by definition refers to less than 25% (90 degrees) of the circumference of the disc. Disc material may include nucleus pulposis, cartilage, bone, or annular tissue (Fig. 20.40). The term “herniated nucleus pulposus,” is a misnomer because the herniated disc material often contains not only nuclear material but other disc components as well (Fig. 20.30). Herniated discs may be classified as either a protrusion or an extrusion, based on the shape of displaced material.
Disc protrusion. A disc protrusion is a herniated disc in which the greatest distance, between the edges of the disc material presenting outside the disc space is less than the distance between the edges of the base of that disc material extending outside the disc space. The base is defined as the width of the
disc material at the outer margin of the disc space of origin, where disc material displaced beyond the disc space is continuous with the disc material within the disc space (Fig. 20.41). Anatomic classifications refer specifically to “intra-annular disc protrusions” (29), which may be considered as two subcategories. Inner annular disruption (Fig. 20.42) is similar to the anatomic term “intradiscal mass displacement,” which represents a shift in the location of nuclear material within the disc due to ruptures in the innermost fibers of the annulus. This causes no appreciable focal contour abnormality of the disc margin on MR. In the second subcategory, subtotal annular disruption, there is displacement of nuclear and inner annular material through a defect (radial fissure or tear) involving the inner annular fibers and some outer annular fibers. However, a few overlying outer annular fibers remain intact. On MR images, this causes a small focal abnormality of the disc margin where the protruding disc is cone shaped with a wide waist. This appearance is widely referred to as a disc protrusion in routine clinical practice. However, it is important to keep in mind that with MR or CT, it is difficult or impossible to differentiate a small herniated disc that has extended through the inner annulus from a small herniated disc that has penetrated all layers of the annulus, because either may produce a focal contour abnormality along the posterior disc margin (Figs. 20.43 and 20.44).Related posts:

Stay updated, free articles. Join our Telegram channel

Full access? Get Clinical Tree