Scale
Description
Reference
(A) Physician measured
Disease specific
Expanded (Kurtzke) Disability Status Scale (EDSS)
20-Step ordinal scale. Benchmark position despite poor metric properties
Hobart et al. (2000)
Multiple Sclerosis Functional Composite (MSFC)
3 Functional domains with good metric performance
Cutter et al. (1999)
UK (Guys) Neurological Disability Scale (UKNDS)
12 Functional domains with good metric performance
Sharrack et al. (1999)
Generic
UK FIM+FAM
Generic scale with wide application in neurorehabilitation
Law et al. (2009)
(B) Patient measured
Disease specific
Multiple Sclerosis Impact Scale 29 (MSIS-29)
29-Item scale. Robust metric development and performance
Hobart et al. (2001)
Functional Assessment of MS (FAMS)
59-Item scale
Ritvo et al. (1997)
MS Quality of Life 54 (MSQOL-54)
54-Item scale incorporates the SF-36
Vickrey et al. (1995)
Leeds MSQoL
8-Item scale. Metrics suggest unidimensional performance (well-being)
Ford et al. (2001)
Generic
Short Form 36 Health Survey Questionnaire (SF-36)
Established generic instrument, metric performance in MS questioned
Hobart et al. (2004)
11.1.3.2 Unidimensional (Function Specific) Measures
The primary value of function-specific measures is as an adjunct to paraclinical “site-specific” measures in trials employing a “sentinel lesion” approach where patients are selected based on disease at a clinically eloquent CNS site such as the optic nerve, cerebellum or spinal cord. Symptom-specific assessment instruments (of which many are available—spasticity, fatigue scales, etc.) other than measures of affective function are not discussed here as their relevance lies with trials for symptomatic therapies rather than neuroprotective and repair therapies. Assessment of affective function is discussed due to its potential for confounding effect on patient/subject-based outcomes.
11.1.3.2.1 Visual Function
Visual impairment is a common clinical feature of MS with a significant impact on quality of life (Mowry et al. 2009). Pathological evidence of optic nerve involvement is found in 94–99% at autopsy (Toussaint et al. 1983). Normal visual function involves the complex integration of multiple systems, of which acuity, contrast sensitivity, colour vision and field-of-vision are amenable to detailed quantitative non-invasive clinical assessment. Acuity has traditionally been measured using the Snellen chart; however, logMAR scoring using a retro-illuminated Early Treatment Diabetic Retinopathy Study (ETDRS) chart is preferred for research application. ETRDS generates continuous data scores that are more amenable to statistical analysis. Sloan charts are of similar style but combine decrementing levels of contrast. The resultant contrast visual acuity provides a sensitive and reproducible measure of acuity deficits in MS (Kolappan et al. 2009). Colour vision can be comprehensively and quantitatively assessed by the Farnsworth-Munsell 100 hue test, requiring the subject to place 85 coloured tiles in order of hue. This test provides both quantification and spectral localisation of dyschromatopsia. The pivotal optic neuritis treatment trial confirmed that low contrast visual acuity and contrast sensitivity are sensitive and reliable measures for the detection and monitoring of visual dysfunction in MS (Balcer 2001; Optic Neuritis Study Group 2008). Visual fields can also be quantitatively assessed with static targets using a Humphrey perimeter or with kinetic targets using the Goldmann method. Taken together, the high quality of clinical outcomes marks the visual system as an attractive candidate pathway for detailed assessment in clinical trials
11.1.3.2.2 Cerebellar Function
Cerebellar dysfunction is common in multiple sclerosis with lifetime prevalence >70%. Assessment of tremor and/or dexterity forms the mainstay of available outcomes. The nine-hole peg test and finger-tapping test both provide objective and valid quantitative assessments of upper limb function but lack specificity to cerebellar dysfunction. Observer-dependent rating scales such as the Scale for the Assessment and Rating of Ataxia (SARA) or the International Cooperative Ataxia Rating Scale (ICARS) are either unvalidated in MS or shown to exhibit significant metric limitations (Schmitz-Hübsch et al. 2006). The Composite Cerebellar Functional Score (CCFS) comprising a dominant hand “nine-hole peg test” and “click test” (based on kinematic data regarding optimum assessment for upper limb goal directed multi-joint movement) represents a promising option for quantitative cerebellar assessment (du Montcel et al. 2008). However, validation in MS is awaited. A further challenge to cerebellar assessment (in any disease) is the avoidance of floor effect. Severe dysfunction renders assessment impossible with all currently available outcomes. These limitations make the use of cerebellar disease unattractive to trials adopting a “sentinel lesion” approach.
11.1.3.2.3 Spinal Function
The potential value of a spinal-specific scale is highlighted by the observation that a large component of disability due to MS reflects spinal pathology (Filippi et al. 1996). Accepting there are currently no high performing clinical scales for the assessment of spinal function in MS, commonly used outcomes are timed walk (as a component of MSFC) and/or inference from the EDSS. The challenge of measuring spinal function will be familiar to clinicians dealing with spinal cord injury (SCI) where only the detailed American Spinal Injury Association (ASIA) motor and sensory scoring systems have been demonstrated to exhibit favourable psychometric properties for their longitudinal use in clinical trials. However, formal metric evaluation of these scales in MS patients is awaited.
11.1.3.2.4 Affective Function
Mental health is a key determinant of patient perceptions regarding quality of life and can therefore be viewed as an independent clinically significant outcome (Rothwell et al. 1997). Furthermore, assessment of affective function is essential to interpreting outcomes based on global function and patient-reported measures. The most widely used assessment scale for depression in MS is the 21-item Beck Depression Inventory (BDI)—recently revised as the BDI-II. This generic instrument offers strengths of clinical familiarity, the ability to make cross-disease comparisons and an extensive existing literature. The BDI has also been endorsed by international consensus guidelines for the treatment of depression in MS (Goldmann Consensus Group 2005). However, the challenge of attributing physical symptoms to the syndrome of depression rather than MS per se has led to a debate regarding the specificity of physical symptoms of depression in MS. This complicates the use of generic instruments such as the BDI and the Hospital Anxiety and Depression Scale (HADS). Two disease-specific instruments have therefore been developed to address these issues. The comprehensive 42-item Chicago Multiscale Depression Inventory (CMDI) has been psychometrically validated in MS but lacks familiarity amongst clinicians (Chang et al. 2003). The rival 7-item Beck Fast Screen for Medically Ill Patients (B-FS) has also been validated in MS (Benedict et al. 2003). Comparative analysis of these two instruments, particularly with regard to responsiveness, is not yet available. Those designing a clinical trial at present therefore face a difficult choice between the generic BDI-II, and the two psychometrically favourable but less familiar disease-specific scales available.
11.1.4 Paraclinical Outcome Measures
Paraclinical outcome measures can be used as surrogates for clinical outcomes with the potential to avoid observer bias and increase statistical power to detect efficacy. However, they can also be used as direct measures of a biological process—required to demonstrate mechanism of putative therapeutic effect. They are therefore of particular importance in neuroprotective trials. Paraclinical parameters may have advantages over clinical parameters in their pathological specificity but crucially may also be more responsive (to changes in underlying pathology) and reproducible (with attendant benefit in detecting efficacy “signal” from test–retest “noise”).
11.1.5 Magnetic Resonance Imaging Measures
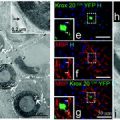
Magnetic resonance imaging (MRI) measures have consistently proven to be the most useful surrogate outcomes in MS clinical trials. Conventional MRI techniques (T2, T1 ± gadolinium (Gd), and fast fluid-attenuated inverse recovery [FLAIR]) have long been used as biomarkers for disease activity in clinical trials. Together with the emergence of methodologies that can begin to discriminate between distinct pathological processes such as inflammation, myelination status and neuronal loss, imaging-based measures represent a powerful tool for mechanistic evaluation of therapeutic intervention (Fig. 11.1). A summary is given below of the main techniques and how they may be best deployed in the setting of an experimental trial seeking to demonstrate efficacy as well as inform on mechanism.
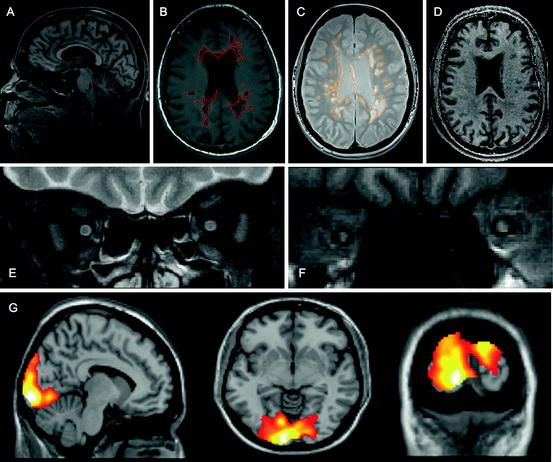
Fig. 11.1
Imaging approaches to define pathological substrate. (a) 3D high-resolution T1 sagittal brain image for volume and atrophy measurements; (b) T1 axial brain image suitable for T1 hypointense (black hole) lesion volume analysis (ringed); (c) proton density axial brain image suitable for T2-PD lesion volume analysis (ringed); (d) magnetisation transfer ratio map suitable for whole and segmented brain and lesional MTR analysis; (e) fat-suppressed T2 fast spin echo coronal image of optic nerves suitable for detection of optic nerve lesion and lesion length measurement (left optic nerve showing hyperintense lesion); (f) fat-suppressed coronal T1 fast FLAIR image of optic nerves suitable for analysis of ON area (right optic nerve atrophy shown—consistent with previous optic neuritis); (g) fMRI brain images showing activation patterns following visual stimulation
11.1.5.1 T2-Weighted Sequences
T2-weighted sequences are sensitive for the detection of focal white matter lesions with approximately 5–10 new lesions on imaging per clinical relapse—resulting in significant improvement of statistical power to detect efficacy (Miller and Thompson 1999). Gadolinium administration doubles sensitivity but is relatively expensive and may not be cost-effective in neuroprotective/repair trials as new T2 lesions in progressive disease can develop without gadolinium enhancement. Approaches that improve the sensitivity of non-enhanced images include fast fluid-attenuated inverse recovery (FLAIR) sequences and higher field-strength scanners. Despite impressive sensitivity (responsiveness), poor pathological specificity (validity) limits the utility of T2 lesions as an outcome measure in neuroprotective trials. Total lesion number (load) or total lesion volume can be used as a marker of cumulative focal inflammatory disease; however, neither measure correlates with current or future clinical disability nor informs about more diffuse inflammatory processes (Simon and Miller 2007).
11.1.5.2 T1-Weighted Sequences
Approximately 20–30% of T2 hyperintense lesions appear hypointense (“black holes”) on T1-weighted MRI. The natural history of these lesions over several weeks is either resolution to isointensity—thought to reflect resolution of oedema and remyelination, or persistent focal hypointensity reflecting axonal loss—such lesions being descriptively labelled as “chronic black holes”. Potential outcome measures therefore include total chronic black hole number or volume—reflecting a marker of cumulative axonal loss due to focal inflammation. These measures correlate modestly with clinical disability and can be used as surrogates, although the resultant gain in statistical power is marginal. A more sophisticated approach involves combining T1 data with gadolinium enhancement (or new T2 lesions) in order that single lesion natural history outcomes can be assessed, e.g. the proportion of new Gd/T2 lesions evolving to chronic black holes. This uncoupling of inflammation from axonal loss offers the potential to define intervention as anti-inflammatory vs. neuroprotective/reparative. Further complexity can be added by quantitative assessment of lesion T1 intensity recovery (therefore axonal loss) through the normalised contrast/hypointensity ratio (Zivadinov 2007). This approach allows a quantitative assessment of neuroprotective/reparative intervention.
11.1.5.3 Gadolinium Enhancement
Gadolinium enhancement is the most sensitive measure of new focal white matter lesions with pathological specificity for focal inflammation (Simon and Miller 2007). In RR-MS, monthly Gd-MRI reveals about ten new enhancing lesions for every clinical relapse. Gd-MRI can therefore be used as a surrogate for clinical relapses in order to improve statistical power. Sensitivity can be further increased by more frequent scanning (weekly), triple-dose Gd, off-resonance magnetisation transfer (MT) pulse, delayed scanning (post-Gd administration) and thinner slices. However, these approaches do not have a significant impact on sample size requirements because patient variability also increases (Silver et al. 2001). Aside from providing a measure of focal inflammatory disease activity, the combination of Gd-MRI and T1 in order to define the pathological evolution of individual lesions (see above) is of particular benefit to neuroprotective studies.
11.1.5.4 Atrophy Measures
CNS atrophy (measurement of volume loss) has been widely used as an outcome in MS clinical trials. Global brain atrophy is a moderate but significant predictor of neurological impairment that is independent of conventional MRI lesions (Zivadinov and Bakshi 2004). However, responsiveness is limited (particularly in early RR-MS—possibly reflecting greater functional reserve, and/or more effective endogenous repair and plasticity), and the gain in statistical power compared to direct clinical assessment is therefore low. Regional atrophy measures may be preferable in this context, notably (brain) grey matter atrophy occurs at nearly twice the rate of whole brain or white matter atrophy and is a better predictor of cognitive deficits, and cervical spine atrophy is a better predictor of change in EDSS (Fisher 2007). Accepting that atrophy measures are non-specific for axonal/neuronal loss, with myelin, glia and vascular components, it represents an important outcome for longitudinal assessment of axonal/neuronal loss and can be further segregated into global (brain), grey matter (brain) and regional scores.
11.1.5.5 Magnetisation Transfer Ratio Sequences
Magnetisation transfer ratio (MTR) forms an indirect measure of macromolecular structure (such as myelin) and can be used to infer myelination status globally (whole brain) or within specific regions of interest. Pathological specificity of MTR is imperfect and asymmetric; a decrease in MTR reflects demyelination and axonal loss, whereas an elevation of MTR is reflective of possible remyelination or resolution of oedema (Schmierer et al. 2004). Consequently, a number of potential roles have been proposed for MTR as an outcome measure in clinical trials. Firstly, low MTR at baseline is predictive of progression, and there may therefore be a role for MTR-based eligibility criteria in neuroprotective trials looking to identify an enriched cohort of patients likely to exhibit clinical progression during the trial period. Secondly, there is some evidence that the decline of MTR in evolving lesions (before Gd enhancement) is a marker of lesion severity—with more marked decline being predictive of persistent T1 hypointensity (axonal loss). MTR decrement in lesions might therefore be used as a marker for the severity of myelin and axonal damage secondary to focal inflammatory insult—i.e. a quantitative assessment of the neuroprotective consequence of anti-inflammatory intervention(s). Finally an increase in MTR may be used to quantitatively assess the effect of repair therapies on myelin.
11.1.5.6 Diffusion Tensor Imaging Sequences
Diffusion tensor imaging (DTI) is a sensitive technique for the assessment of tissue microstructure based on water molecule diffusion properties in tissues. In white matter, diffusion is facilitated along fibre tracts and is slower in the direction perpendicular to the main axis of the tract. This physiological restriction is disturbed by pathological processes like demyelination, resulting in increased total diffusivity and disruption of the directional selectivity (anisotropy) of the fibres to allow diffusion. Fractional anisotropy (FA) indicates the orientation of diffusion and is high along well-defined pathways such as the corpus callosum, pyramidal tracts and optic radiations. A reduction in FA and an increase in the mean diffusivity (MD)/apparent diffusion coefficient (ADC) are potential markers for the structural integrity of myelinated axons. A modest correlation between clinical progression and DTI parameters of single well-defined tracts (but not global diffusion parameters) means that DTI is a poor surrogate for clinical progression. However, potential application to any white matter fibre bundle with high orientational coherence and associated functional outcomes (e.g. optic nerve DTI and visual function) makes it an attractive measure of axonal integrity for trials employing a sentinel lesion approach.
11.1.5.7 Magnetic Resonance Spectroscopy
Proton MR spectroscopy (MRS) enables quantitative assessment of the molecular composition in CNS tissues. The main molecular peak in adult human CNS is from the amino acid N-acetyl aspartate (NAA) which is found almost exclusively in neurons and axons—a reduction in NAA providing evidence of axonal dysfunction or loss. Therefore, NAA quantification potentially represents a measure of axonal function and number in neuroprotective/repair trials. Other metabolites offer potential to assess non-neuronal CNS structures and processes; e.g. choline-containing compounds can be used as a marker of cell membrane integrity, myoinositol as a glial cell marker, lipids as products of brain destruction, lactate as a product of anaerobic glycolysis, and creatine/phosphocreatine as a marker of energy metabolism (Narayana 2005). However, low signal-to-noise ratio results in modest reproducibility, and the use of proton MRS has to date been limited mainly to single-centre trials. Clearly, this evolving technique represents a rich resource for further development of pathologically specific outcomes relevant to neuroprotective/repair trials.
11.1.5.8 Functional Magnetic Resonance Imaging
Neuronal activity increases local levels of deoxyhaemoglobin; this is reflected by changes in functional magnetic resonance imaging (fMRI) signal intensity. Consequently, fMRI can potentially be used as a technique to measure dynamic changes or plasticity in the brain in response to disease per se or to therapeutic intervention. In the setting of an experimental neuroprotective or repair therapeutic trial, fMRI is most powerfully harnessed in the context of structural imaging changes. For example, fMRI in a “sentinel lesion” trial allows examination of a relationship between lesion(s) in a single white matter tract (e.g. optic nerve) and the clinical function (visual acuity) not entirely accounted by the structural recovery (e.g. remyelination as indicated by increase in MTR values or decrease in the visual evoked potential (VEP) latency).
In summary, MRI measures currently represent the most powerful and well-validated paraclinical outcomes for use in neuroprotective trials that can begin to provide non-invasive and quantitative assessments of key pathological and repair processes. Future imaging approaches will benefit from increased sensitivity through technical advances such as higher field-strength scanners, use of surface coils to improve both resolution and signal-to-noise ratio and faster acquisition methods. Methodological advances also offer the prospect for application to challenging CNS sites such as the spinal cord and optic nerve. The spinal cord is a more difficult structure to image than brain due to its smaller size, mobility and proximity to the heart and great vessels. However, these difficulties can be largely overcome by approaches involving cardiac gating, spatial pre-saturation slabs and the development of phased array coils enabling rapid imaging of the whole spinal cord. The challenges of optic nerve MRI reflect its small size, mobility, surrounding fat and CSF, and the bony optic canal. MR sequences have been developed to overcome these challenges through suppression of fat and CSF signal, fast sequences, use of surface coils and high field MR systems to allow high-resolution imaging.
11.1.6 Quantitative Assessment of the Retinal Nerve Fibre Layer
The retinal nerve fibre layer (RNFL) consists of unmyelinated axons within the retina. Consequently, measurements of RNFL thickness in MS are not confounded by loss of myelin. The RNFL is therefore an attractive structure to visualise processes of neurodegeneration and potentially neural repair. Optical coherence tomography (OCT) uses the echo time delay of low-coherence light to delineate the RNFL. Layers of the retina have different reflectivity and can thus be distinguished and measured: RNFL thickness (giving an estimate of axonal number) and macular volume (giving an estimate of ganglion cell number). Reductions in RNFL thickness and macular volume are significantly correlated with reductions in visual function, and correlation with brain atrophy has also been described (Fisher et al. 2006; Gordon-Lipkin et al. 2007). OCT measurements may therefore be useful in clinical trials to detect and monitor neuroprotection. High-speed OCT using a “Fourier” or “spectral” detection technique is also now becoming widely available. This technique is approximately 50 times faster—resulting in reduced eye movement artefact, and has a superior sensitivity compared to standard OCT.
11.1.7 Neurophysiological Measures
11.1.7.1 Visual Evoked Potential
Conventional VEP measures the cortical response to monocular stimulation in the central 30° of the visual field (known as the P100). In MS, the waveform is characteristically delayed with well-preserved amplitude. Response latency can be used as a measure of myelination in the afferent visual pathway (increased with demyelination), and amplitude can be used as a measure of axonal conduction (reduced with axon loss or conduction block due to demyelination) (Diem et al. 2003). The multifocal VEP (mVEP) has been developed to examine conduction in the parts of the visual field not covered by full field VEP. The mVEP uses a paradigm of sectoral stimulation with pseudo-stimulation at other sites, using the fellow eye and normal controls for comparison at each point. mVEP has the advantage that a particular sector of the visual field can be examined for abnormality and compared with the results of other retinotopic tests (e.g. standard automated perimetry). mfVEP may also be more sensitive than conventional VEP as a marker of clinical progression (Fraser et al. 2006).
Related posts:
 Immune Modulation and Repair Following Neural Stem Cell Transplantation
 Effects of Current Medical Therapies on Reparative and Neuroprotective Functions in Multiple Sclerosis
 Development of Oligodendrocytes in the Vertebrate CNS
 A Peripheral Alternative to Central Nervous System Myelin Repair
 Exogenous Cell Myelin Repair and Neuroprotection in Multiple Sclerosis
 Axonal Protection with Sodium Channel Blocking Agents in Models of Multiple Sclerosis
Stay updated, free articles. Join our Telegram channel

Full access? Get Clinical Tree


