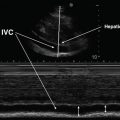
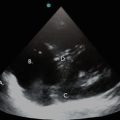
Fig. 11.1
B-Mode and M-Mode images of the diaphragm dome. With B-Mode, a 2-dimensional image is constructed. With M-Mode, a single sound path is used to follow changes in diaphragm dome position over time
Differences in acoustic impedance between tissue interfaces can be exploited in the zone of apposition (ZAP) of the diaphragm to the rib cage to visualize the diaphragm and its adjacent structures. As the sound wave penetrates into body tissues, differences in acoustic impedance at boundaries between the parietal pleura, diaphragm, peritoneum, and liver are used to identify these structures. Muscles, such as the intercostals and diaphragm, will scatter sound and appear as a speckled image at higher ultrasound frequencies. A collection of homogenous fluid, such as a simple pleural effusion, has no internal boundaries and, therefore, no changes in acoustic impedance. Therefore, it is not echogenic, and appears featureless (black on B-mode). By contrast, air is so echogenic that the sound wave is nearly completely reflected back to the transducer and does not penetrate into deeper structures. Such differences in acoustic impedance have been used to distinguish the diaphragm from its adjacent structures such as the pleura and peritoneum (Fig. 11.2). Because the lung contains air, structures lying deep to it do not appear on the image. When imaging the diaphragm, the unique acoustic-reflective characteristics of the lung can be used to identify the location of the lower border of the air-containing lung. As the lung inflates, its lower border moves caudally and can be used to identify the pleural boundary of the diaphragm. The pleural boundary appears as a thin, echogenic structure inferior to the lung border and deep to the chest wall, which is then masked by the lung as it descends during inspiration. The peritoneal boundary of the diaphragm can be recognized as a second, somewhat thicker, echogenic boundary deep to and separated from the pleura by the diaphragm itself, which appears in between these two membranes as a less echogenic, speckled structure (Fig. 11.2).
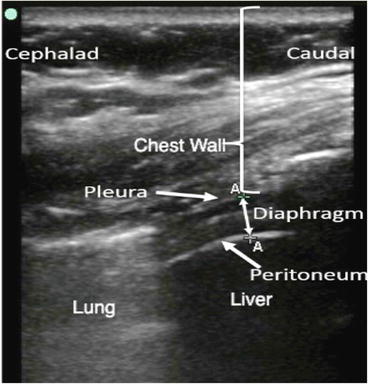
Fig. 11.2
Image of the diaphragm in the zone of apposition demonstrating chest wall, diaphragm, liver, and lung
Image Acquisition and Interpretation
Diaphragm Zone of Apposition
The ZAP of the diaphragm refers to the area where the diaphragm abuts the lower rib cage (Fig. 11.3). In this region the diaphragm is a relatively superficial structure. Since structures close to the body surface can be imaged with high frequencies, a transducer in the range of 5–15 MHz is typically used to image the diaphragm in the ZAP and has a resolution of 0.1 to 0.2 mm. This higher frequency-range transducer provides an image of greater resolution than lower frequency transducers. Once obtained, the image can be displayed in either the M-mode or B-mode (Fig. 11.4). The advantage of using the B-mode is the ability to visualize the diaphragm in two dimensions rather than as a point in time.
Fig. 11.3
Schematic illustrating ultrasound transducer placement for visualizing the diaphragm in the zone of apposition
Fig. 11.4
B-Mode and M-Mode of the diaphragm in the zone of apposition. With B-Mode, the diaphragm muscle is visualized as the minimally echogenic structure “sandwiched” between the pleura and peritoneum. Similar information can be displayed using M-Mode
To visualize the diaphragm in the ZAP, the transducer is placed on the skin surface in the coronal plane [3, 4] (Fig. 11.3). The diaphragm in the ZAP is best visualized in the mid-axillary line in the region of the lower rib cage, usually in the 8th or 9th intercostal space. Typically the B-Mode is used to create a two-dimensional coronal image of the ZAP. The diaphragm is identified as a three-layered structure just superficial to the liver, comprised of two parallel echogenic lines (peritoneal and diaphragmatic pleura) sandwiching a relatively non-echogenic layer, the diaphragm muscle itself (Fig. 11.5). On occasion, a 4th noncontinuous line may be seen within the diaphragm muscular layer which may represent a neural or vascular structure. The diaphragm can be further identified dynamically as the most superficial structure which is obliterated by the leading edge of the lung during inspiration. On occasion, the transducer may have to be moved cephalad to the 6th or 7th intercostal space to identify the leading edge of the lung, especially when the diaphragm is elevated. However, obliteration of the diaphragm by the leading edge of lung may not be present when the diaphragm is paralyzed or during mechanical ventilation.
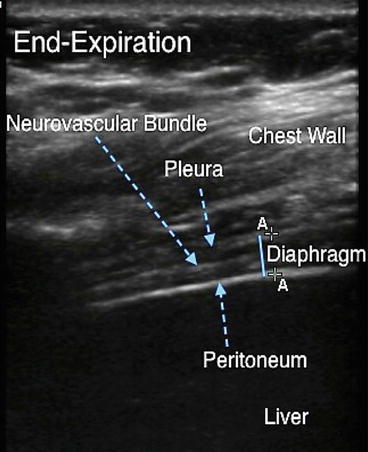
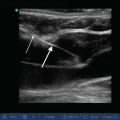
Fig. 11.5
Diaphragm at end-expiration in the zone of apposition. The diaphragm on ultrasound appears as a relatively hypoechoic structure sandwiched between the bright echogenic lines of pleura and peritoneum. The echogenic line contained within the diaphragm is the neurovascular bundle. Solid blue line indicates diaphragm thickness. The calipers adjacent to the solid blue line can be used to measure diaphragm thickness on a frozen image
Once the diaphragm is identified, the image is frozen at end-expiration and the thickness of the diaphragm (tdi) measured as the distance from the middle of the diaphragmatic pleura to the middle of the peritoneum to the nearest 0.1 mm. A subsequent image is obtained at end-inspiration, and tdi is measured at this lung volume (Fig. 11.6). The change in diaphragm thickness between end-inspiration and end-expiration (Δtdi) is then calculated along with a thickening fraction (Δtdi% = Δtdi/tdi end-expiration × 100). The thickening fraction can be measured over a range of inspired volumes and tends to be alinear with more thickening at higher lung volumes [4]. The change in diaphragm thickness during inspiration can be measured either using B-mode or M-mode, with subjects in the standing, seated, supine, or prone positions. Normal values for diaphragm thickness at end-expiration generally fall between 2.0 and 3.5 mm. Normal values for diaphragm thickening with inspiration (Δtdi%) fall between 20 % and 100 %. Because the inherent thickness of the diaphragm in this region varies only slightly from place to place, thickening of the diaphragm in the ZAP is representative of general thickening of the diaphragm muscle and not movement of an adjacent relatively thicker part of the diaphragm under the transducer [4].
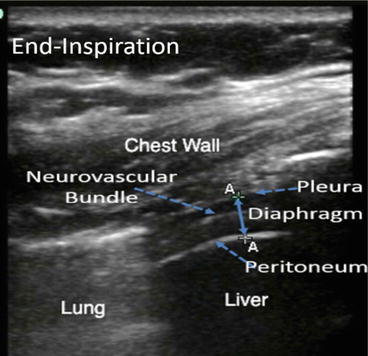
Fig. 11.6
Diaphragm at end-inspiration. The double-arrowed line indicates diaphragm thickness. Note the relative thickening of the muscle compared with Fig. 11.5. Note the bright echogenic curtain to the left of the screen indicating air-filled lung that has descended caudally with inspiration
Diaphragm Dome
A subcostal approach is typically used to visualize the diaphragm dome (Fig. 11.7). The distance from the anterior abdominal wall to the posterior diaphragm is much greater than the distance from the skin surface to the diaphragm in the ZAP. Because sound penetrates further at lower frequencies, the dome of the diaphragm typically is visualized using a 3.5–5 MHz transducer. The longer wavelength of sound in this frequency range allows for deeper penetration of the ultrasound beam, but the resolution of the lower frequency transducer is reduced to approximately 0.3 to 0.6 mm. When using a subcostal approach to visualize the dome, the liver provides a good acoustic window allowing one to assess movement of the right hemidiaphragm. Unfortunately, air in the gastrointestinal tract may interfere with visualization of the left hemidiaphragm when using a subcostal approach. This can be circumvented, in part, by using the spleen as an acoustic window. Motion of the diaphragm dome towards the transducer during inspiration is generally assessed using the M-mode but also can be viewed using B-mode [5–8].
Fig. 11.7
Schematic illustrating ultrasound transducer placement for visualizing the diaphragm dome using a subcostal approach
Note that when imaging the dome, the diaphragm muscle itself is not visualized. As previously discussed, air is strongly echogenic. Since the lung reflects all sound transmitted towards it, the image of the diaphragm dome is comprised of the intensely reflected sound at the interface of the diaphragm and lung and not the diaphragm muscle itself. The motion of the diaphragm can be inferred from movement of the lung–diaphragm interface but the thickness of diaphragm muscle cannot be measured. When using this approach, the diaphragm muscle can only be seen when there is a pleural effusion between the dome and the lung.
Motion of the diaphragm dome is not uniform from region to region. Normally, there is greater displacement in the middle and posterior regions than in the anterior region in supine subjects during large inspirations [9]. Similar findings have been described in children [10]. These differences in regional motion in the supine position have been attributed to the larger abdominal pressure that acts on the posterior diaphragm, which passively displaces the posterior diaphragm higher into the thoracic cavity at end-expiration than the anterior hemidiaphragm. Consequently the posterior portion of the diaphragm has to descend further during inspiration to move towards its relatively flattened configuration at full inspiration.
To visualize the diaphragm dome, a low frequency ultrasound transducer (3.5–5 MHz) is placed on the right or left side in the subcostal region well below the lower border of the lung and angled upward [11, 12]. The right or left mid-clavicular lines or the right or left anterior axillary lines can be used for transducer placement depending on the quality of image. The transducer is directed cephalad and dorsally towards the posterior third of the hemidiaphragm. With this approach, the dome is viewed in a sagittal (longitudinal) plane with the liver or spleen providing acoustic “windows.” Alternatively the diaphragm dome can be visualized by placing a low frequency transducer (3.5–5 MHz) over the xiphoid process and scanning in the transverse plane. This placement may allow both hemidiaphragms to be viewed simultaneously. The diaphragm typically is initially identified with the B-mode as a two-dimensional structure, then M-mode is used to follow the motion of a single point in time (Fig. 11.1). Note that this point does not represent a single anatomic point on the diaphragm but several points of the diaphragm as they cross the path of the ultrasound beam.
Normal values for diaphragm motion have been reported for quiet breathing and deep inspiration. During quiet breathing, the posterior dome of the diaphragm is displaced anteriorly and caudally with a mean displacement of 1.6 cm [11, 13]. With deeper breaths, the mean displacement was 4.8 cm with about two-thirds of the diaphragm movement occurring by the time of mid-inspiration [9]. An M-mode tracing of diaphragm motion allows for calculation of the inspiratory and expiratory times, the amplitude of diaphragm motion (maximum height in cm), and the speed of diaphragm contraction (slope in cm/s).
A number of pathologic processes affect motion of the diaphragm dome. Subphrenic fluid accumulations or developmental defects, such as eventration, may reduce regional or global diaphragm motion. In patients with ascites, diaphragm excursion may be decreased, especially if the ascites is due to a malignant process. In this instance, motion may be reduced secondary to splinting from pain or fixation of the diaphragm from the malignant process [2]. With a subphrenic abscess, diaphragm motion may be impaired, absent, or even paradoxical in the presence of inflammation [14]. Overall diaphragm displacement is less with passive mechanical ventilation than is seen during an active breath, and the posterior displacement is no longer dominant over the anterior displacement [10]. The lesser diaphragmatic displacement during passive inspiration may reflect more symmetrical action of the positive inflation pressure on rib cage/diaphragm partitioning or differences in diaphragm tension between active and passive breaths.
Basic and Advanced Competencies
Imaging of the diaphragm in the ZAP using B-mode, with measurement and interpretation of tdi, ∆tdi, and ∆tdi%, is the basic core competency in diaphragm ultrasound. Mastery of this competency will allow for the most straightforward assessment of suspected diaphragm paralysis and dysfunction. Imaging of the diaphragm dome using M-mode, with both quiet breathing and with performance of maneuvers such as a sniff test (see below), and the appropriate interpretation of diaphragm motion with these maneuvers, should be viewed as more advanced competencies in diaphragm ultrasound. This is due to the technical challenges of image acquisition, especially of the left hemidiaphragm, and also to the challenges in appropriate interpretation of diaphragm motion discussed below.
Evidence Review and Evidence-Based Use
Functional Correlates
Measurements of diaphragm thickness at end-expiration and diaphragm thickening during inspiration reflect diaphragm strength and shortening, respectively. In general, the resting cross-sectional area of skeletal muscle is proportional to the maximal tension it can develop. Similarly, the resting thickness of the diaphragm (tdi at end-expiration) should be proportional to the maximal transdiaphragmatic pressure (Pdimax) it can develop. Both Pdimax and maximal inspiratory pressure (PImax) were significantly correlated with diaphragm thickness measured at end-expiration in the ZAP in healthy subjects (R = 0.94 and 0.76, respectively) [15]. Further evidence supporting the notion that measures of tdi reflect diaphragm strength is derived from studies of longitudinal measures of changes in diaphragm thickness and strength following recovery from diaphragm paralysis [16], studies of strength-training activities and diaphragm thickness [17–19], and calculations of specific tension which are similar to those reported for other skeletal muscle groups [20, 21]. Recovery from diaphragm paralysis and strength training of the diaphragm lead to significant increases in diaphragm thickness, Pdimax, and PImax.
Related posts:

Stay updated, free articles. Join our Telegram channel

Full access? Get Clinical Tree


