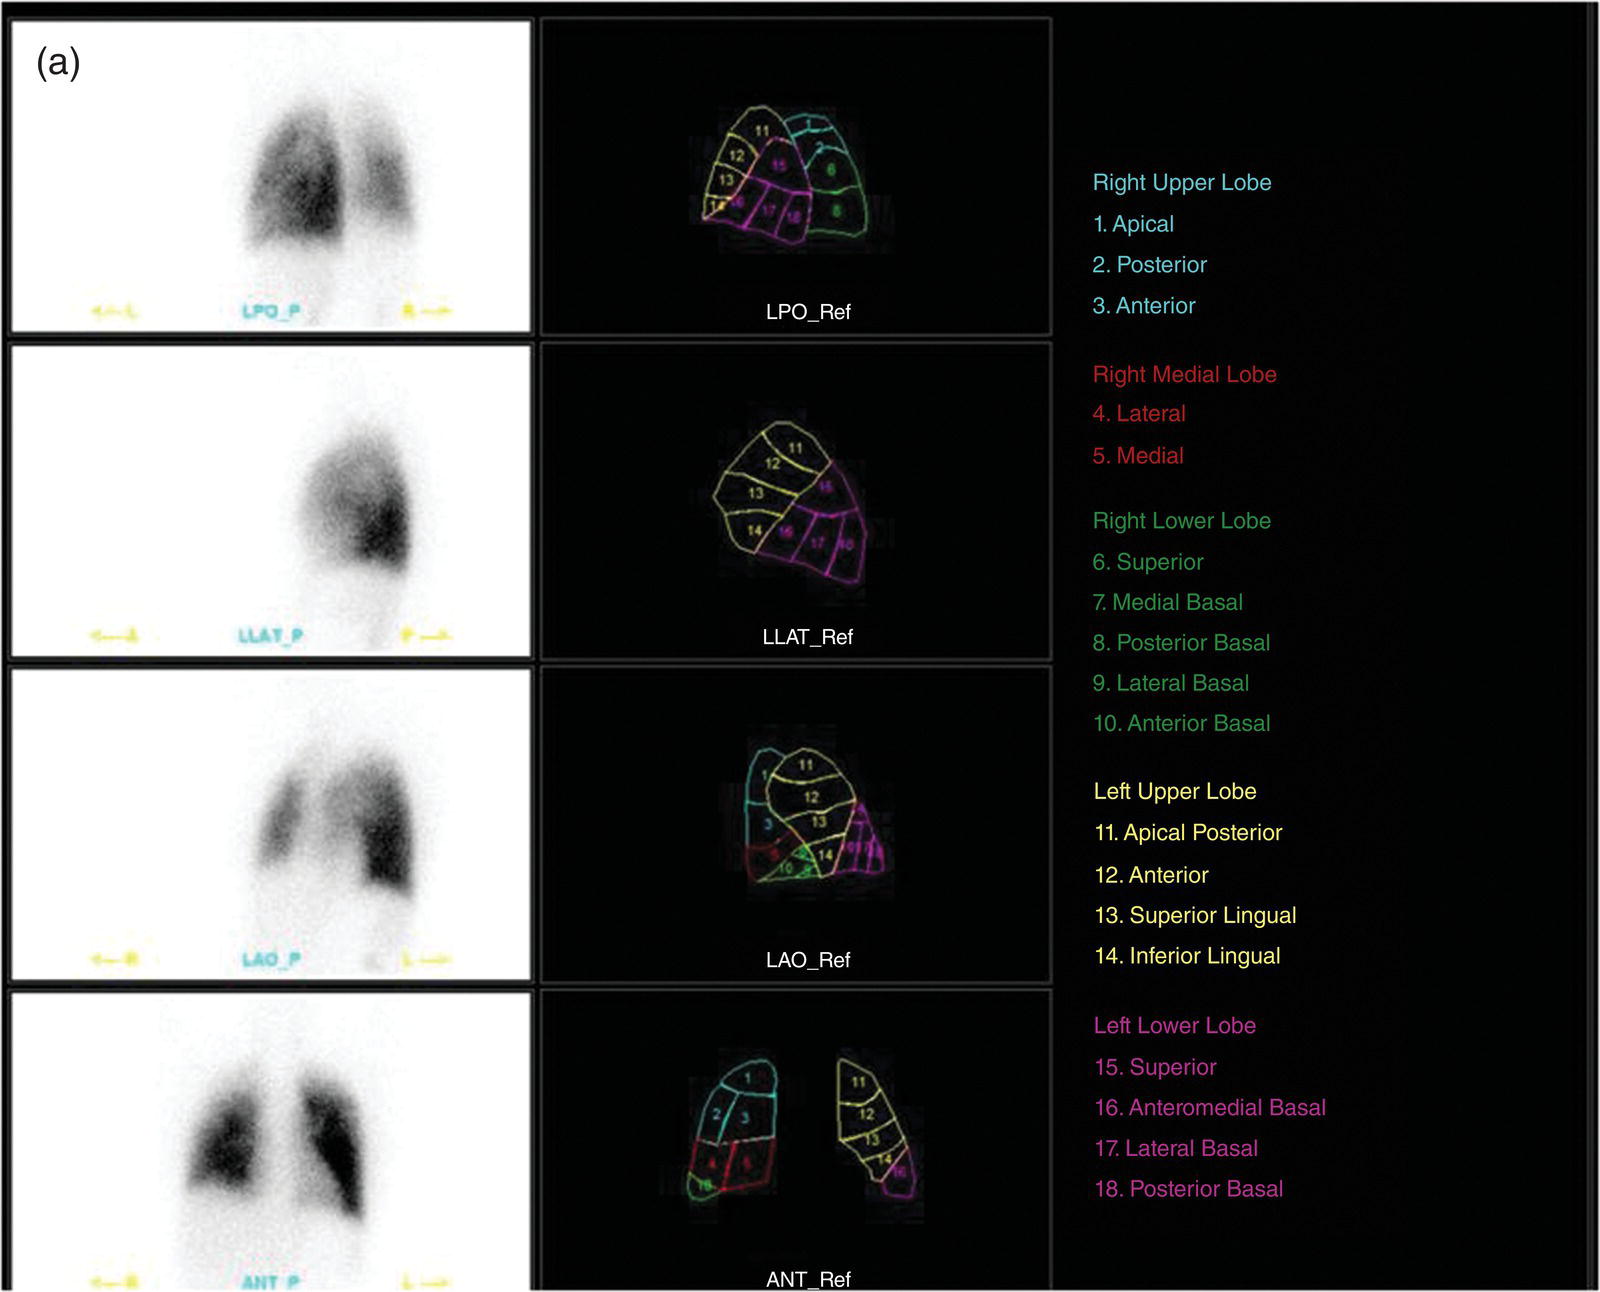
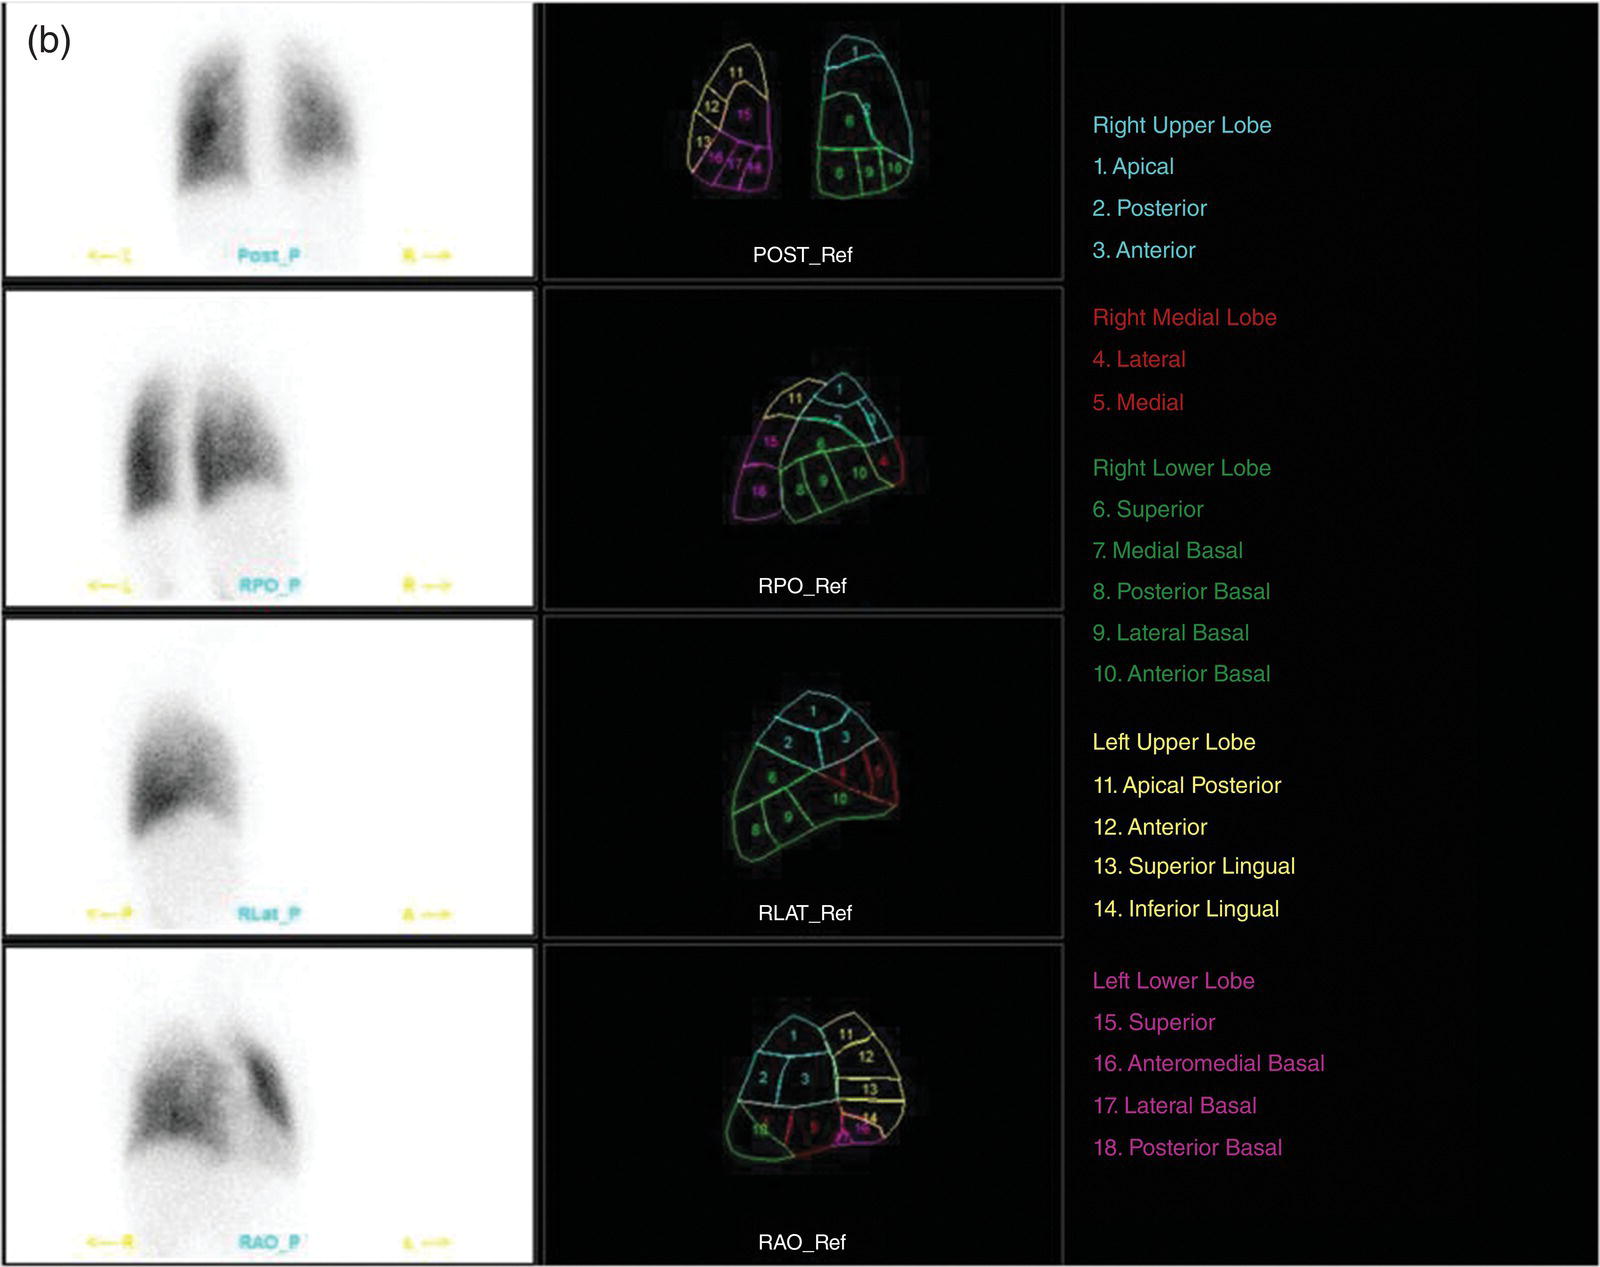
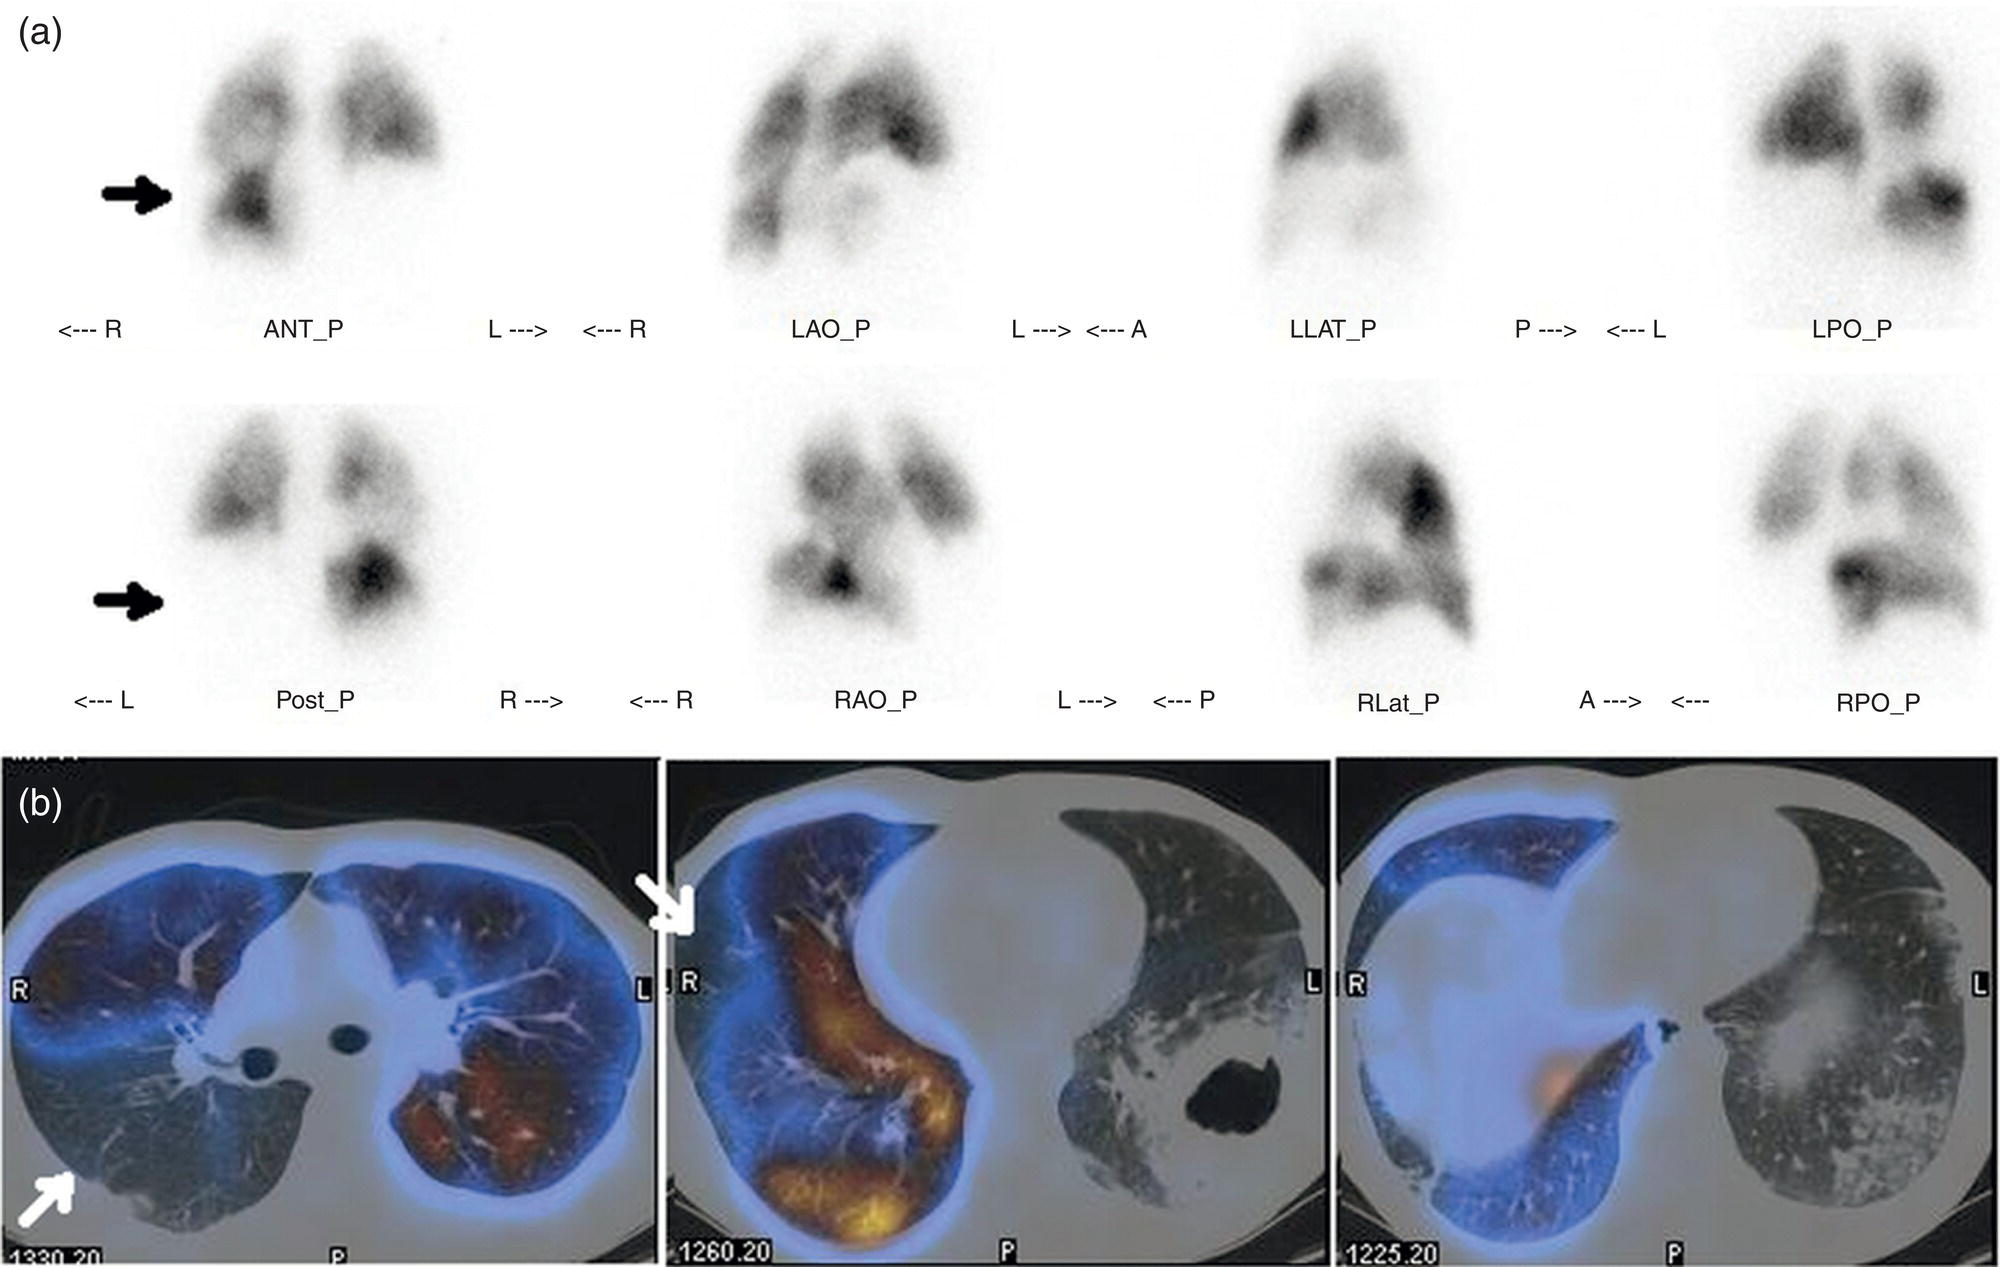
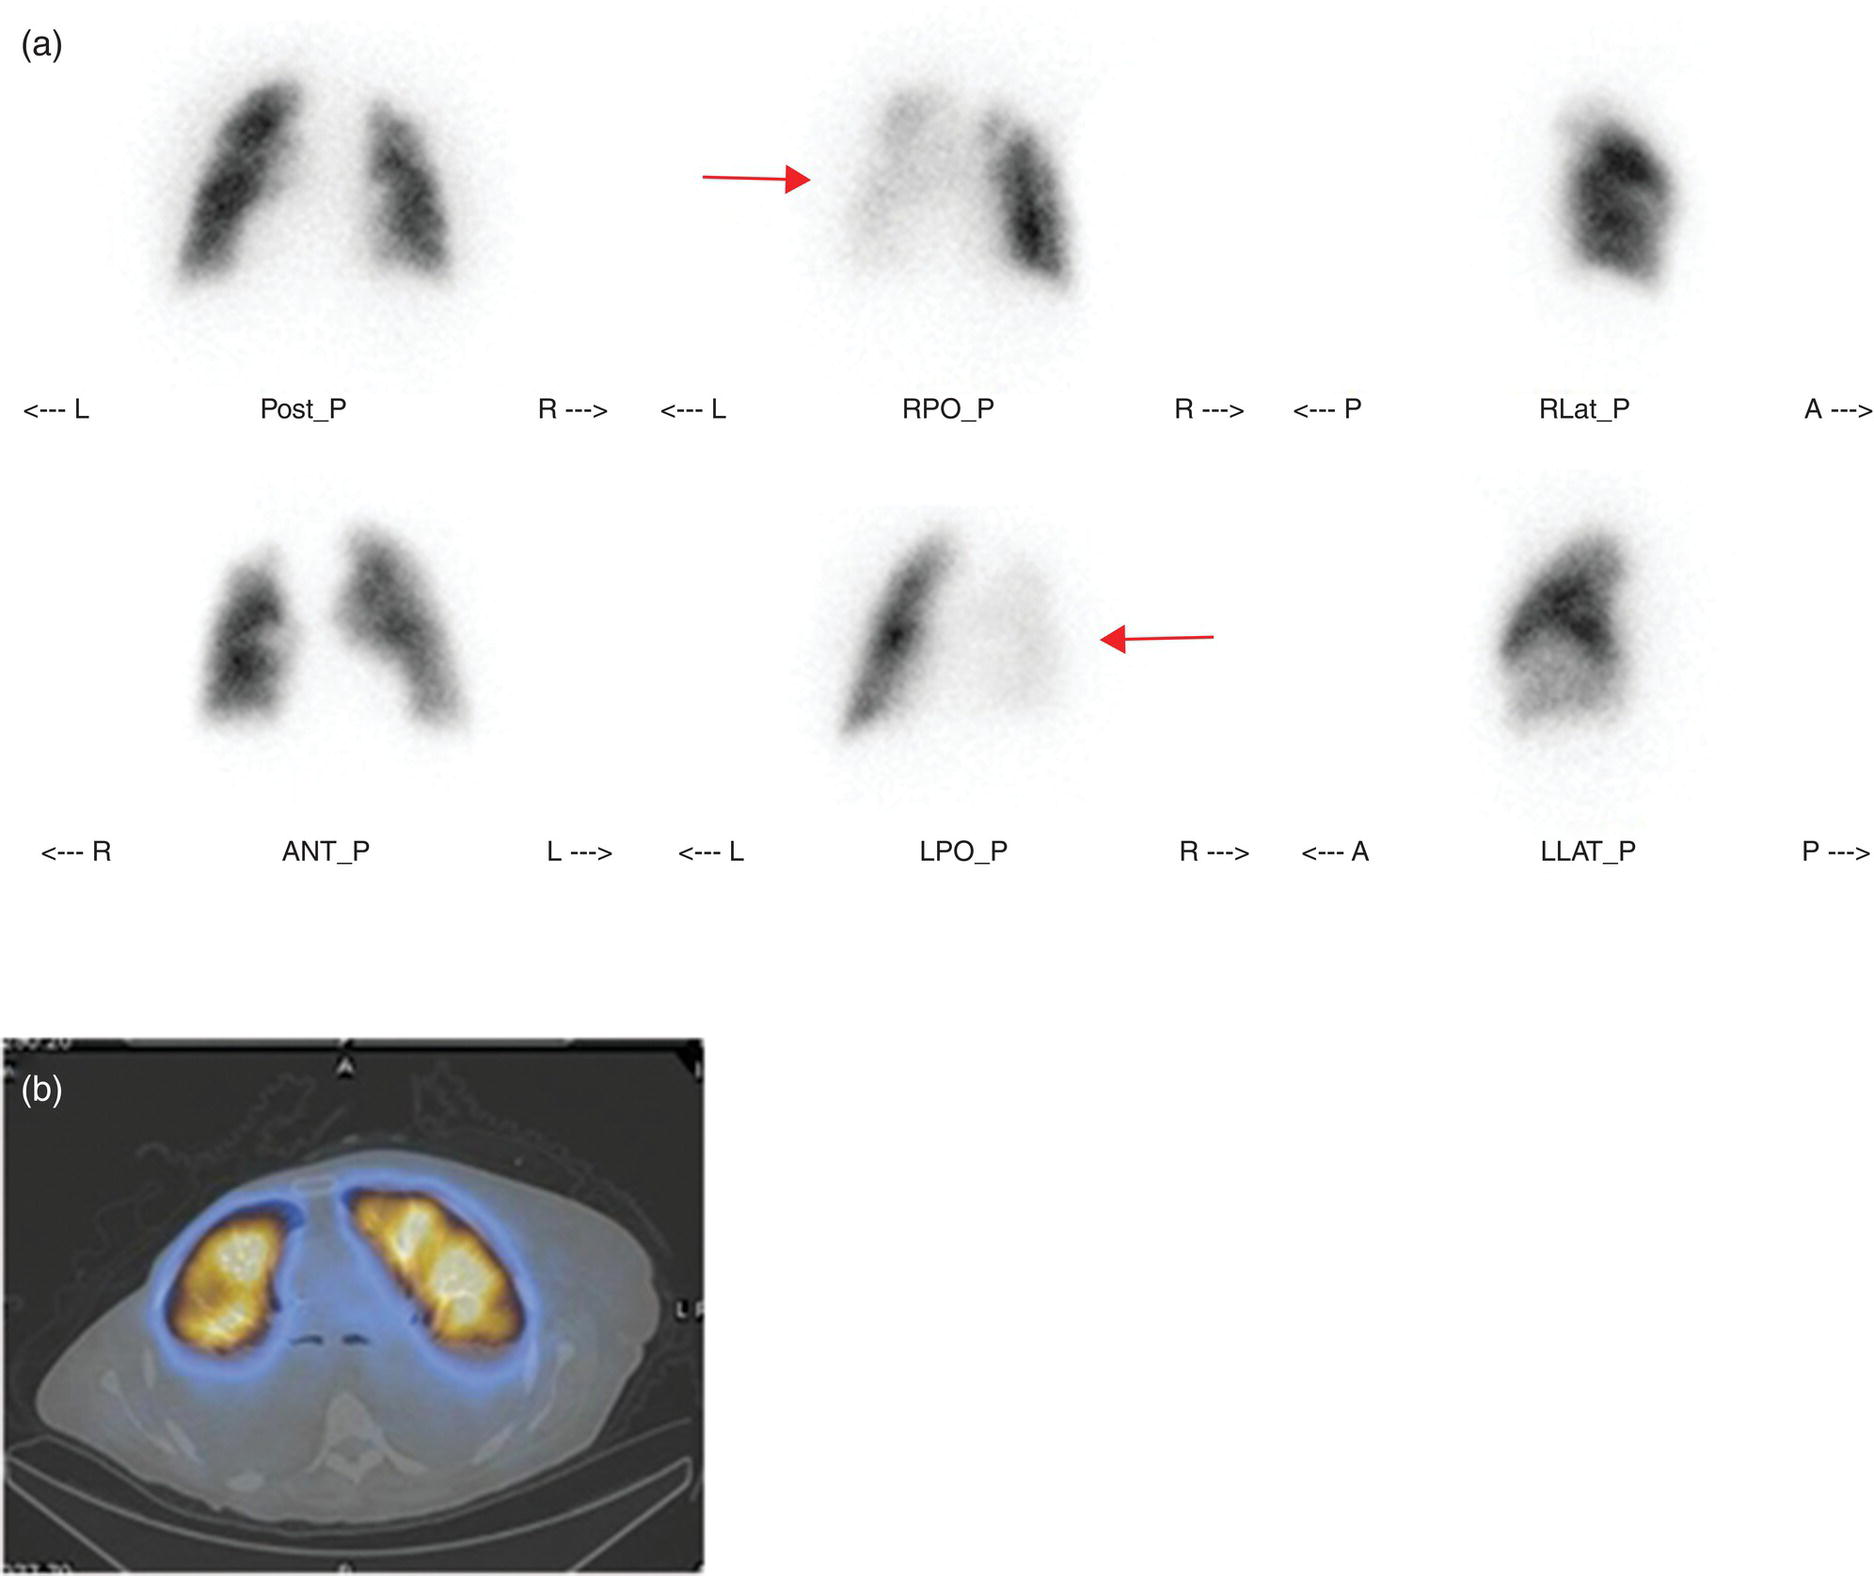
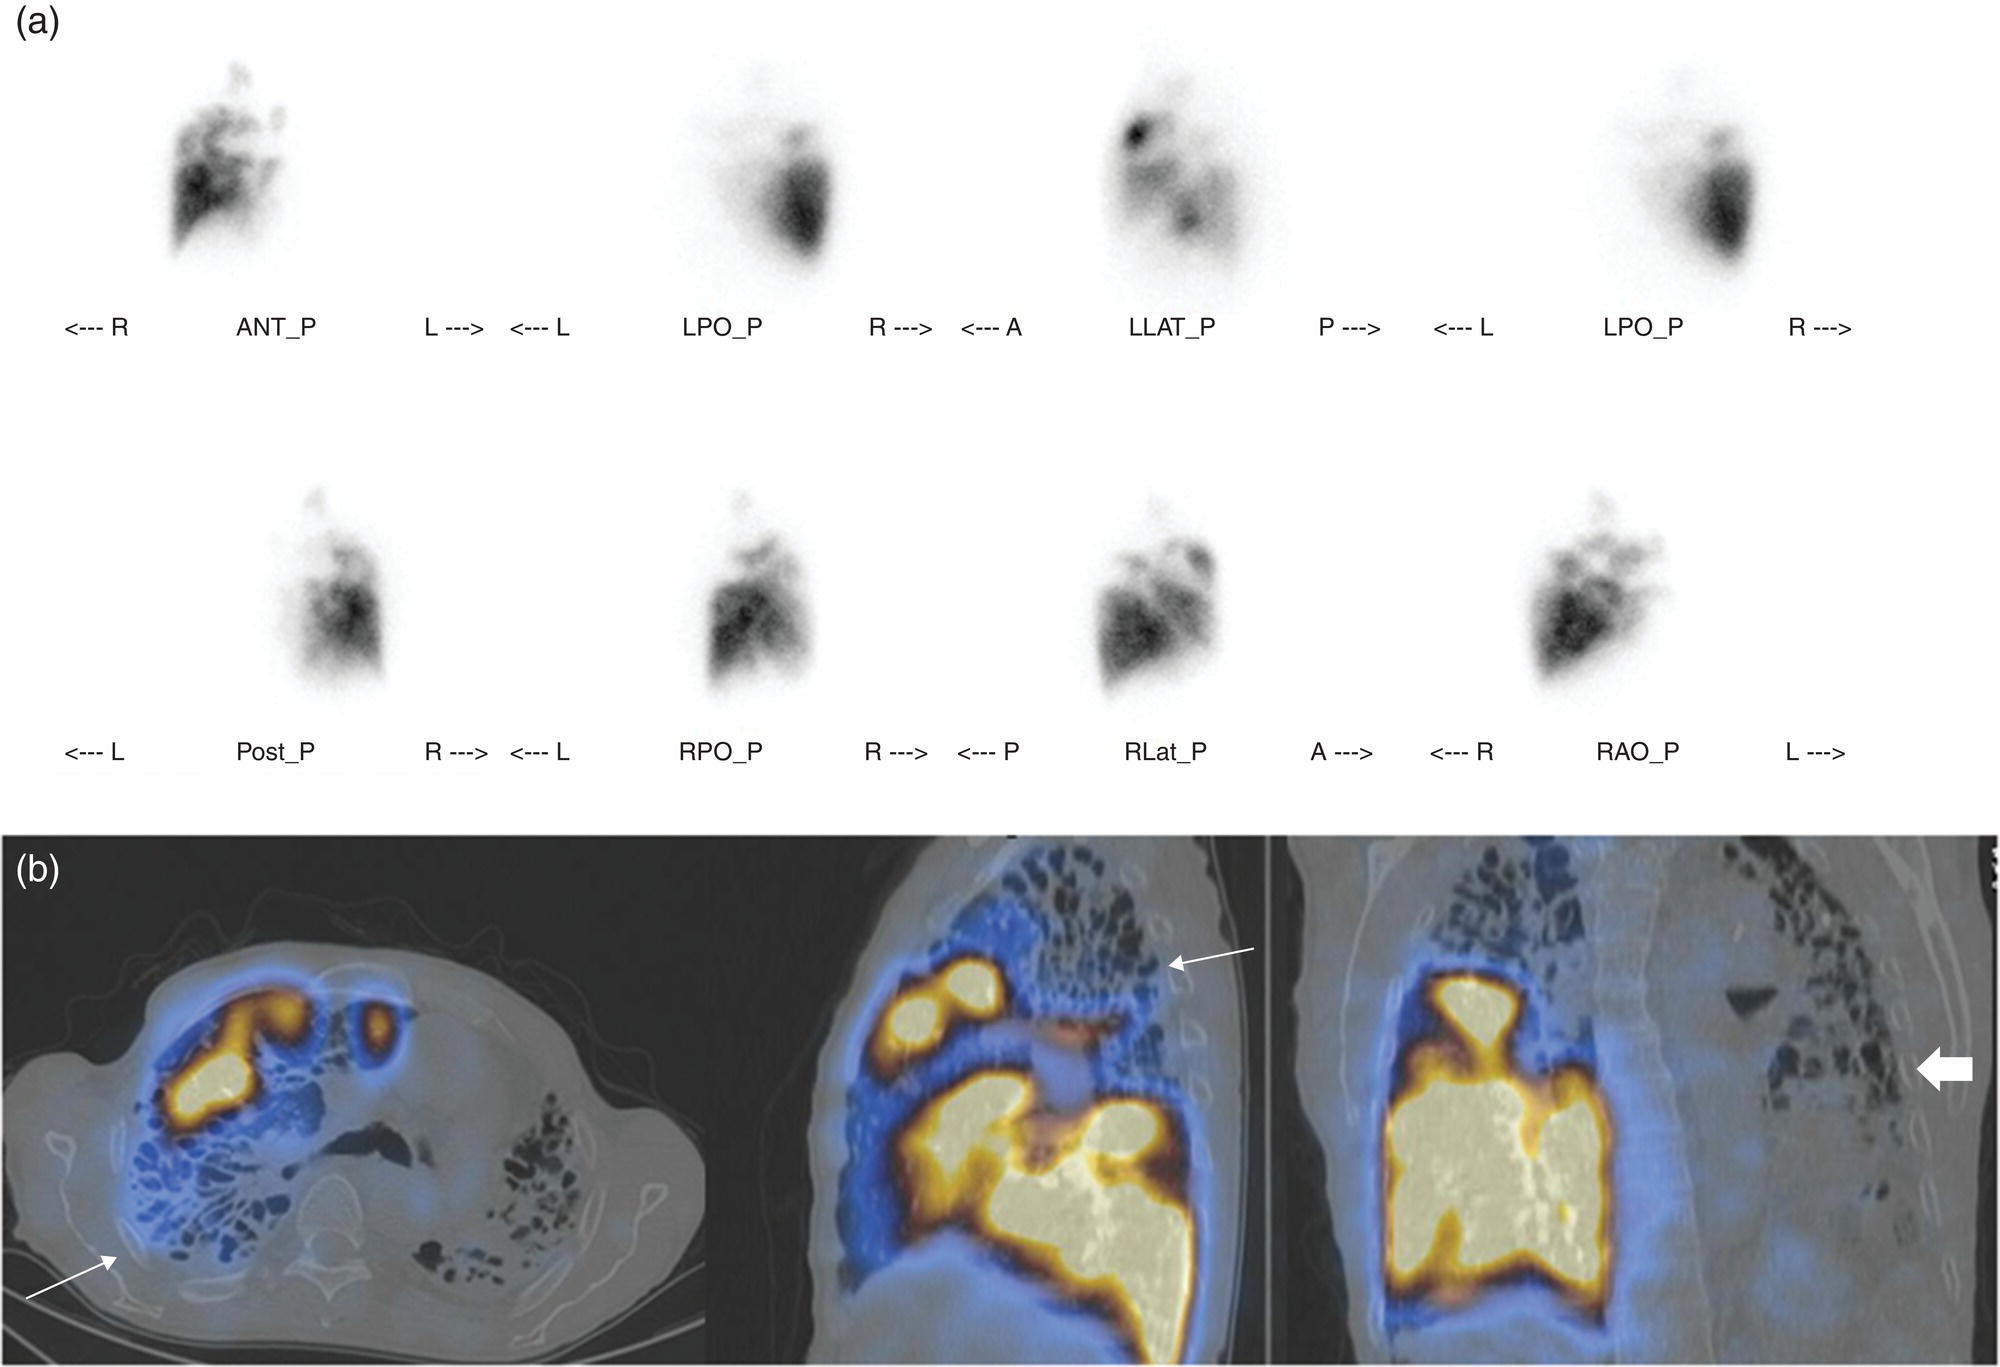
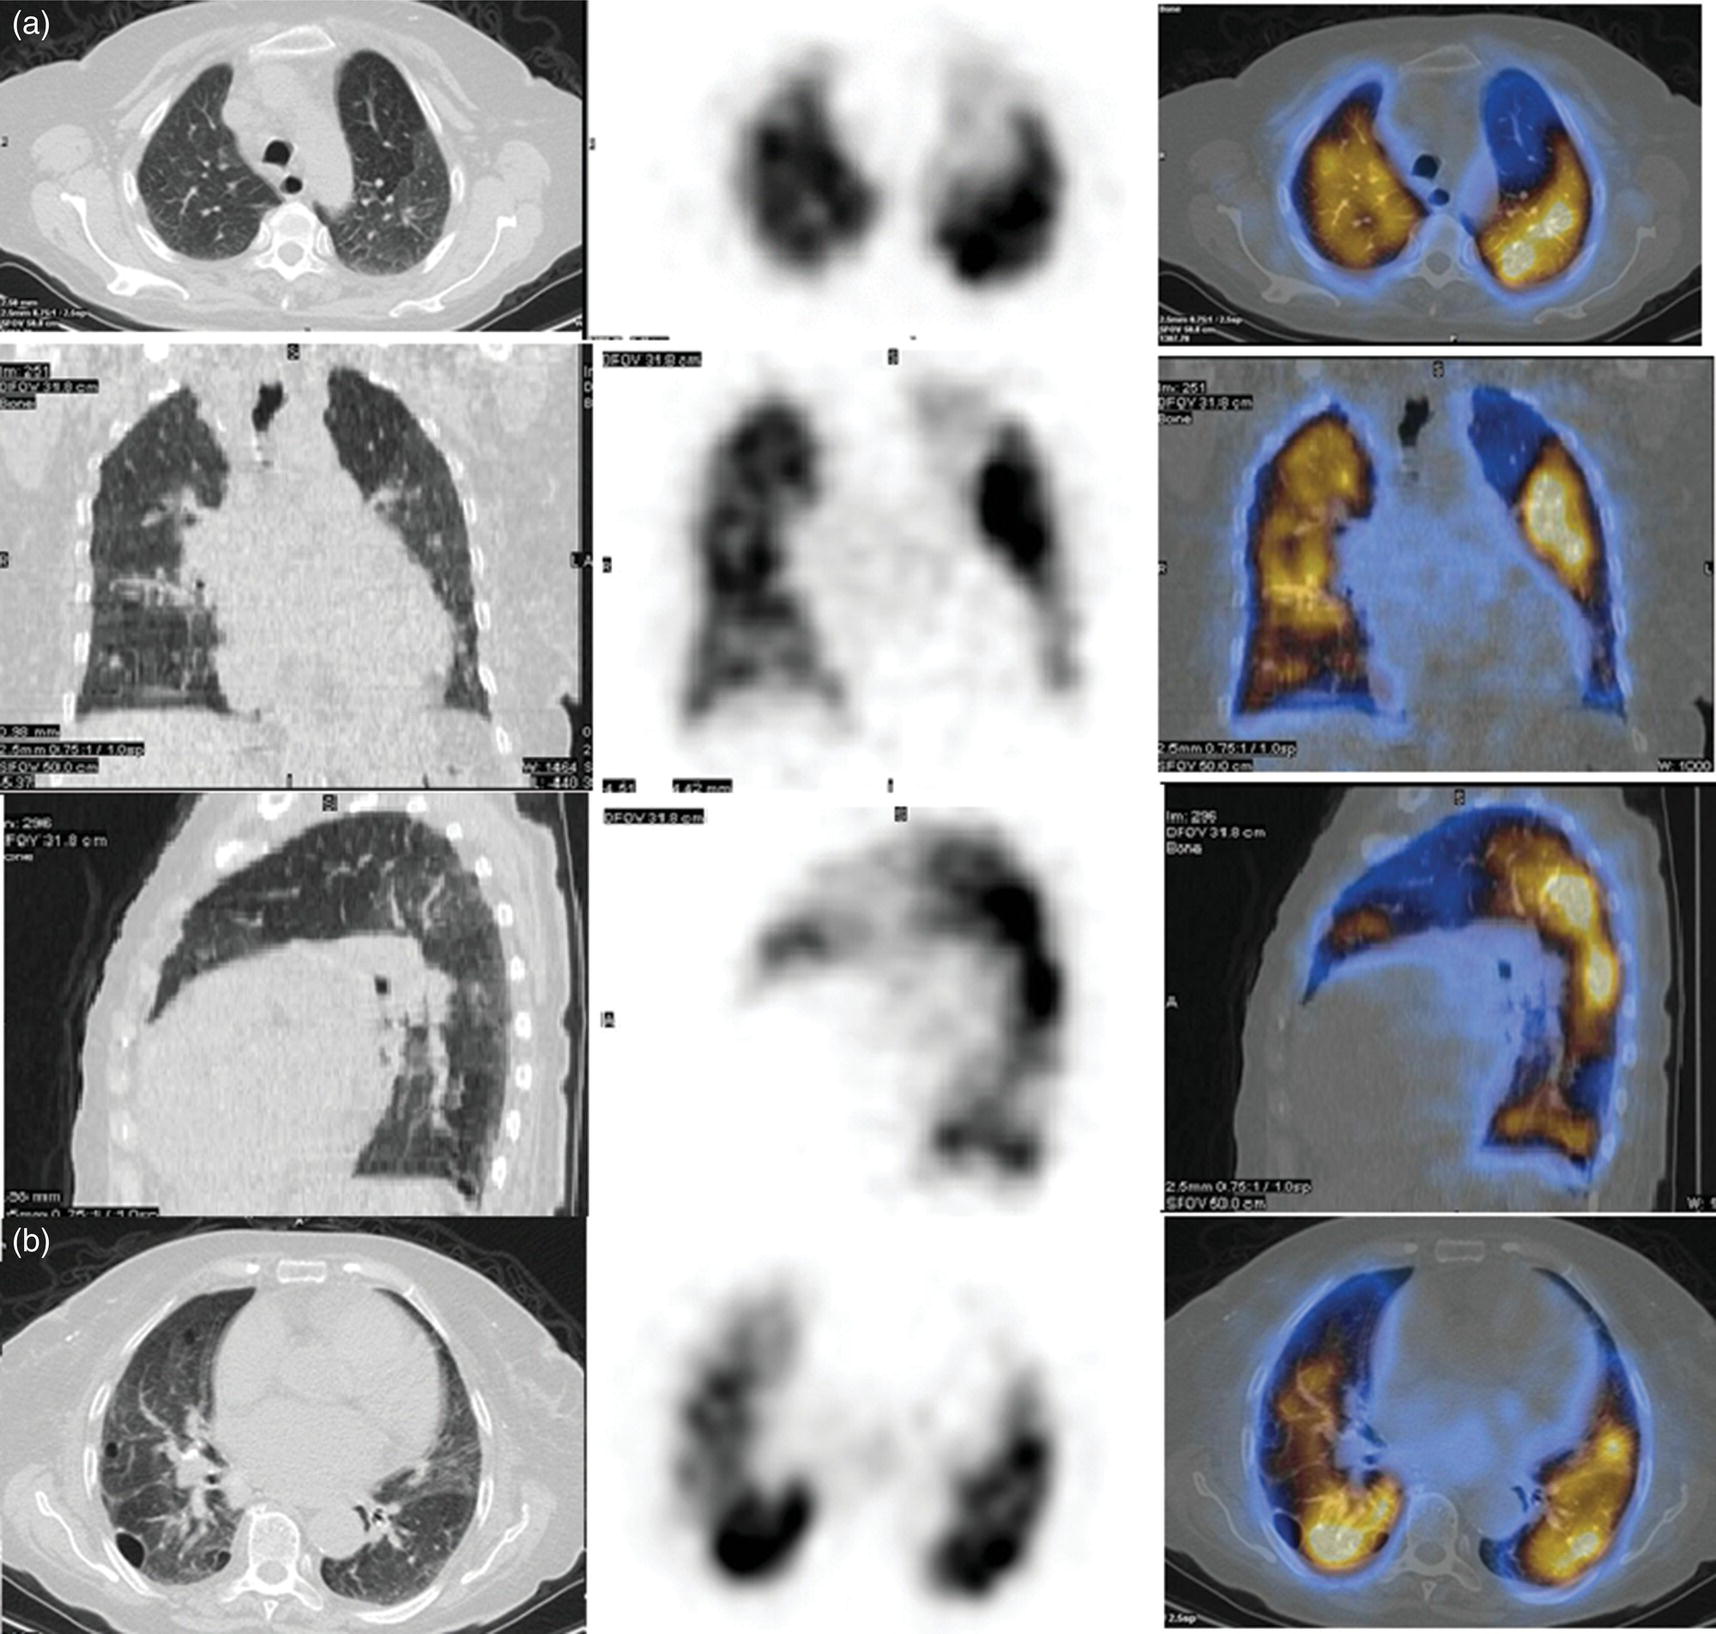
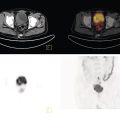
Murat Fani Bozkurt and Bilge Volkan‐Salanci Department of Nuclear Medicine, Hacettepe University Faculty of Medicine, Ankara, Turkey The lungs’ major function is respiration and life is impossible without them. They contain a total of about 2400 km of airways, 300–500 million alveoli, and have a combined surface area of 70 m2. In adults each lung weighs approximately 1.1 kg. The lungs are affected by a wide range of pathology that results in a diverse range of illnesses. The lungs are placed in the thoracic cavity and are separated by the heart and mediastinum. Although the two lungs are very similar in structure, they are not thoroughly symmetrical as they have different numbers of lobes and different bronchial and vascular anatomy. The right lung is composed of three lobes which are divided into 10 segments and the left lung has two lobes and a total of eight segments. Each of the lungs is surrounded by the pleura, which separates them from the chest wall and mediastinal structures [1]. Bronchopulmonary segmental anatomy divides the lungs into segments which are based on the tertiary or segmental bronchi (Figure 10.1a,b). The trachea divides into two parts at the carina to form the left and right main stem bronchi, which enter the lung tissue to divide into further parts. This first division is defined as secondary or lobar bronchi, but subsequent divisions form smaller and much smaller bronchi and bronchioles until the smallest bronchioles connect to the alveoli. Each segment has its own pulmonary arterial branch and thus the bronchopulmonary segment is a portion of lung supplied by its own bronchus and artery. Each segment has its own pulmonary arterial branch and is both anatomically and functionally independent. It is therefore possible for a single segment to be surgically resected without affecting the neighboring segments. The right lung is divided into three lobes with 10 segments and the left lung is divided into two lobes and into eight segments. Each segment is notated according to the Boyden classification of bronchi [2] (Table 10.1). A useful and practical mnemonic for the readers to remember the nomenclature of bronchopulmonary segments is as follows: Fissures are also anatomical structures that incompletely separate the lobes of the lungs. Both the right and left lungs have an oblique fissure, while a horizontal fissure is also present in the right lung. The tracheobronchial tree is a branching structure of tubular structures with continuously decreasing diameter that originates at the larynx and ends in the alveoli. It can roughly be divided into conduction and respiratory zones. The conduction zone is composed of the trachea, bronchi, bronchioles, and terminal bronchioles. During inspiration, air is humidified and warmed while it is conducted from the oropharynx to the lungs, where gas exchange occurs. The function of the conduction zone is to optimize gas delivery to the functional units of the lungs. There are cilia to remove any particles from the inspired air and cartilage which avoids possible collapse during expiration. Figure 10.1 Bronchopulmonary anatomical segments of right and left lung and corresponding 99mTc‐MAA lung perfusion scintigraphy planar images shown on (a) posterior (POST), right posterior oblique (RPO), right lateral (RLAT), and right anterior oblique (RAO) projections, and (b) left posterior oblique (LPO), left lateral (LLAT), left anterior oblique (LAO), and anterior (ANT) projections. Table 10.1 Bronchopulmonay segmental anatomy and Boyden classification. Source: Based on Boyden [2]. The respiratory zone is composed of respiratory bronchioles, alveolar ducts, and alveoli, and functions as the location of gas transfer within the lung. It is anatomically an extension of the tracheobronchial tree at the level of the terminal bronchioles. By strict definition the functional lung parenchyma only includes the alveoli, alveolar ducts, and respiratory bronchioles. The lungs have dual arterial supply and venous drainage: pulmonary arteries and veins as well as bronchial arteries and veins. Pulmonary arteries supply deoxygenated blood from the right ventricle and the bronchial arteries, which are branches of the thoracic aorta, supply oxygenated blood. Pulmonary veins drain into the left atrium and the bronchial veins drain to the pulmonary veins, superior vena cava, and azygos venous system. The lungs are innervated by sympathetic, parasympathetic, and visceral afferent fibers from the pulmonary plexus, which is composed of fibers from the vagus nerve (parasympathetic and visceral afferent fibers) and fibers from the upper four sympathetic ganglia. The lymphatics in the lungs drain through superficial and deep lymphatic plexuses to bronchopulmonary nodes at the hilum. The superficial lymphatic plexus is subpleural while the deep lymphatic plexus lies along the bronchovascular structures with associated intrapulmonary lymph nodes. The first use of radiolabeled particles for imaging of lung perfusion was done in dogs by Quinn et al. in 1964 [3]. They studied three radionuclides, 51Cr tagged red blood cells, 131I human serum albumin and 203Hg chlormerodin for the diagnosis of pulmonary infarcts, but they did not find 131I serum albumin promising [3]. Dworkin et al. reported lung perfusion imaging using 131I human serum albumin in dogs with a photo‐dot scanner [4]. Wagner et al. safely applied radiolabeled macro aggregated albumin (MAA) to humans [5]. They were able to show that various lung diseases such as pancoast tumor, Klebsiella pneumonia or cor pulmonale might be diagnosed by showing lack of perfusion [5]. In 1971 Isawa et al. combined either 131I or 99mTc‐MAA perfusion scans with 99mTc aerosol ventilation imaging for the diagnosis of pulmonary embolism and reporter perfusion/ventilation (V/Q) mismatch in patients with pulmonary ischemia [6]. V/Q scans performed together were shown to increase both the sensitivity and the specificity for the diagnosis of pulmonary embolism (PE), but differential diagnosis for the finding was also identified [7–9]. Anterior and posterior oblique planar views were shown to clearly identify the perfusion defects in 73% of the cases and therefore this became a part of the routine work‐up [10]. Interpretation of V/Q scans in the presence of chest radiograph was highly encouraged during the 1980s to exclude potential perfusion defects due to cardiomegaly, diaphragm, mediastinal pathologies, or skeletal anomalies, etc. [11]. V/Q scans and chest radiographs were encouraged to be acquired in a relatively short time period. Interpretation of V/Q scans and chest radiograms was the first correlative imaging to help exclude perfusion defects that were not directly related to PE. Biello et al. used chest radiograms to identify indeterminate cases, i.e. to diagnose pleural effusions and areas of atelectasis or infiltrations, and to compare the size of perfusion abnormalities and morphological defects present on chest radiograms [12]. Bogren et al. grouped the V/Q findings of 53 patients as likely, possible, and unlikely [13]. They showed that the diagnosis of PE was unlikely if the V/Q scan was normal or the size of the ventilation defect was greater than the perfusion defect. Normal or smaller ventilation defect with a perfusion defect was diagnosed as “likely” where angiograms confirmed the diagnosis in most of the cases. Therefore they concluded that no pulmonary angiograms were needed in these patients either. A “possible” diagnosis of PE was made when V/Q defects are equal in size required further evaluation by pulmonary angiography to ascertain diagnosis [13]. A diagnostic scheme grouping the V/Q scan abnormalities into five different categories of diagnostic probability was proposed by Neuman et al. in a review article [11]. The authors gave diagnostic probabilities of high, moderate, and low as well as indeterminate and normal categories. A normal or near‐normal perfusion scan which defines minor deviations from normal was used to exclude the diagnosis of PE. A high probability interpretation required “two segmental or one segmental defect with two or more additional subsegmental perfusion defects that had normal ventilation and no corresponding disease diagnosed on chest radiogram” [11]. When the segmental equivalents were less than two segments on perfusion scan with a mismatch ventilation scan, “moderate probability” was proposed [11]. These patients had pulmonary angiograms for further diagnosis. Less than two subsegmental mismatch perfusion defects or multiple matched V/Q defects were grouped under “low probability”. If the patients had demonstrable lung disease such as chronic obstructive pulmonary disease (COPD) the V/Q diagnosis was “indeterminate” and the underlying PE diagnosis should be excluded by pulmonary angiogram [11]. This diagnostic interpretation scheme set the basis for the method of prospective investigation of pulmonary embolism diagnosis (PIOPED), but the size of the subsegmental defects were defined as small (<25% of the segment), big (>75% of the segment), and moderate (between 25% and 75%) perfusion defects [14]. “Two or more big segmental defects (or subsegmental equivalents) without corresponding ventilation or radiographic abnormalities” were called “high probability.” More than three small segmental defects with normal chest radiogram and one segmental mismatch defect were considered “low probability.” The study was carried out in six centers prospectively and 1493 patients were included [14]. The PIOPED study revealed that a high probability V/Q scan has 97% specificity and 88% positive predictive value, but low sensitivity (41%). Negative predictive values for low probability and normal/near‐normal scans were 84% and 91%, respectively [14]. The authors discussed that clinical likelihood would improve the scan probability. Hull et al. reported that high probability V/Q scans have a higher sensitivity (51%) when one or more mismatched V/Q defects are present [15]. Low probability scans were problematic for the clinicians with a possibility of 19% of PE, and the interpretation criteria in original PIOPED data did not help to exclude the PE diagnosis [15]. The scan interpretations of PIOPED were reevaluated retrospectively after 3 years, and all the mismatched defects were grouped under high probability while V/Q matched defects and chest radiogram anomalies were grouped under the intermediate category [16]. If the V/Q matched defect was not correlated with the chest radiograph, the authors placed the patient in the low probability category [17]. “Correction of original PIOPED data using certain assumptions” was published by Gray et al., revealing that in patients with low pre‐test probability and low V/Q scan probability, PE diagnosis was successfully excluded in 97% of cases [18]. The calculated likelihood ratios from their data for high probability and low probability V/Q scans were 17 and 0.25, respectively [18]. The revised PIOPED criteria also included “very low probability,” which was defined as less than three small segmental perfusion defects with a normal chest radiograph [16]. The PE prevalence was 2.5% in this group, and this category may thus be used for exclusion of the diagnosis [19]. In clinical practice normal perfusion scans have been shown to have excellent prognosis without anticoagulant therapy and therefore PE diagnosis could be ruled out [20], while a high probability V/Q scan confirmed the PE diagnosis. However, intermediate/low probability V/Q scans remained problematic and such patients were referred for to pulmonary angiograms for proper diagnosis. Another problem in this diagnostic algorithm is the 24‐hour delay for ventilation studies, which delays proper therapy. Clinicians therefore started anticoagulant therapy if defects were present on the perfusion scan and reevaluated their decision after the ventilation scan [21]. Miniati et al. proposed a diagnostic algorithm based on a wedge‐shaped perfusion scan and their chest radiogram correlates without using a ventilation scan in the Prospective Investigative Study of Acute Pulmonary Embolism Diagnosis (PISA‐PED) study [22]. They reported the sensitivity, specificity, and positive and negative predictive values for the planar perfusion scan and chest radiogram as 92%, 89%, 93%, and 88%, respectively. Their data not only simplified the interpretations but also increased the precision. Moreover, the radiation dose to the patient was reduced and a fast diagnosis on the day of admission to the nuclear medicine department was possible. The probabilistic reporting strategy was always problematic, forcing the clinicians to calculate pretest and posttest probability. In the era of computerized tomography (CT) angiography, where the diagnosis is either PE or non‐PE, or nondiagnostic, use of V/Q scans is significantly diminished. Glaser et al. proposed an alternative reporting strategy, a trinary approach [23]. The result of planar perfusion scan was PE in the presence of one or more wedge‐shaped perfusion defects, no PE if the perfusion scan was either normal or low/very low probability, and nondiagnostic if the interpretation was intermediate probability. The results were similar and more studies and routine work‐up also revealed that this simplified version of the diagnosis was welcomed by most clinicians. Perfusion scans of dogs before and after arterial embolization (follow‐up scans were obtained until 8 weeks postembolization) were first compared with single photon emission tomography (SPECT) images by Osborne et al. [24]. They showed that SPECT revealed more lung segments both in acute and chronic settings, therefore these images are more sensitive than planar imaging. They were able to describe wedge‐shaped perfusion defects and redistribution of perfusion in the well‐perfused upper lobes in early scans and on follow‐up scans they revealed that these perfusion defects were getting smaller due to fragmentation of the embolus [24]. Comparison of planar and SPECT perfusion was done on a segmental lung phantom and evaluated by four readers [25]. All the perfusion defects were diagnosed on SPECT, whereas only 77% of them were seen on planar images and defect size estimation accuracy was 97% for SPECT and 51% for planar images. Lung perfusion SPECT was described and used in the diagnosis of PE in the late 1980s [26]. The perfusion defects on SPECT images are seen as clear, nonperfused, wedge‐shaped areas that usually have sharp borders. The defects correspond to the related segments of the lung, but multiple subsegmental defects are quite frequent. The defects should be confirmed at least in two planes. The inherent advantage of enhanced resolution of SPECT results in an increased number of segments, as well as a better description of the defects, therefore leading to a better differential diagnosis. Other lung diseases, such as asthma, pneumonia or congestive heart failure, are usually associated with hypoperfusion rather than nonperfusion and have no clear‐cut borders in segmental anatomy. Moreover, intact peripheral perfusion is not uncommon, which excludes the characteristic wedge‐shaped defect of PE. A diffuse heterogeneous perfusion pattern is seen in COPD, which is more prominent on cross‐sectional images [27]. Use of perfusion SPECT improved the sensitivity (81–97%), the specificity (91–92%), and the diagnostic accuracy (70–96%) [26–29]. Flattening of the posterior borders of the lungs, and sometimes hypoperfusion in these areas, is generally the result of pleural effusions and lack of segmental and wedge‐shaped defects, especially on transaxial slices, are helpful in excluding the diagnosis of PE. Although multiple diagnostic criteria have been proposed, interobserver variability is better for perfusion SPECT readings when compared to planar images [25, 29]. Combined use of perfusion and ventilation SPECT correlation is highly encouraged because of “mismatch” defects that are highly correlated with PE. Moreover, a complementary ventilation SPECT can give additional information, such as delineation of lung periphery, and helps to identify small perfusion defects [30]. Matched defects, on the other hand, are more common in benign or malignant causes of bronchial obstruction, as well as infective or inflammatory diseases. Pulmonary infarcts can also lead to matched V/Q defects, but their incidence is low. Abubakar et al. showed that use of only a chest radiograph instead of ventilation SPECT increases false‐positive readings [31]. A meta‐analysis including 19 studies confirmed that SPECT has superior diagnostic performance when compared to planar imaging [32]. The study revealed that V/Q SPECT should be the preferred imaging protocol in pregnant women and children because it gives a low radiation dose compared to computerized tomography pulmonary angiography (CTPA). Finally, V/Q SPECT and CTPA have equivalent diagnostic performance. The first hybrid transmission/emission tomographic imaging of lungs was done in 1981 by Maeda et al. using a 99mTc‐filled flood source to determine pleural edges properly, where they were able to define hypoperfused areas near the lung periphery [33]. The combination of transmission and emission images has come to life with new technical developments such as hybrid imaging. Extensive use of SPECT‐CT and positron emission tomography–computerized tomography (PET‐CT) in nuclear medicine has changed the interpretation of conventional imaging. Software‐based hybrid imaging have also been found useful in the diagnosis of PE [34]. Use of hybrid systems reduced the diagnoses in indeterminate planar V/Q scans. Figure 10.2 (a) Planar and (b) transaxial SPECT–CT fusion images of a 56‐year‐old male patient admitted to the emergency department with a sudden onset of dyspnea. The planar images show large wedge‐shaped perfusion defects on both lungs (black arrows). Hybrid imaging identified a large, pleural‐based mass with a large central cavity on the lower lobe of the left lung. Large wedge‐shaped perfusion defects on the middle and inferior lobes of the right lobe show a coexisting PE (white arrows). The diagnoses of “intermediate probability” or “nondiagnostic for PE” of V/Q scans include many lung diseases, such as COPD, pneumonia, etc., and cardiac problems. Multidetector computerized tomography (MDCT) or CTPA can not only identify the thrombus but also reveal the alternative diagnoses of lung parenchyma or other thoracic pathologies. CTPA can therefore provide an alternative diagnosis for the presenting symptoms and signs of each patient. However, V/Q scans only focus on PE and group all these alternative diagnoses under the “Intermediate risk” or nondiagnostic” categories. In some patients predisposing factors such as tumors can be identified on hybrid images (Figure 10.2). Thoracic structures such as fissures, cardiomegaly (Figure 10.3), vascular structures, and costal/structural anomalies can lead to perfusion defects on perfusion scans. Another important point is that lung pathologies such as emphysema (Figures 10.4 and 10.5), pleural effusions (Figure 10.3), and atelectasis can change segmental anatomy. Such deviations may lead to misdiagnosis if the morphological data of the patient is not available. Combination of perfusion images with anatomic detail can successfully identify these variants. PE in the main pulmonary artery is possible but such a perfusion pattern is usually the result of a tumor (Figure 10.6) or a congenital anomaly such as Swyer James syndrome [35, 36]. Le Roux et al. compared V/Q SPECT with Q SPECT‐CT in 393 patients and concluded that excluding ventilation SPECT can lead to increased false positives, and so it should not be omitted [37]. They presented an alternative diagnosis in 24% of cases with low‐dose CT and 13 cases where V/Q SPECT was reported positive for PE and low‐dose CT revealed parenchymal disease. They concluded that these cases might have been false positives. Others have also reported increased specificity and false positives when ventilation SPECT was replaced by SPECT‐CT [38]. In a retrospective comparison of V/Q SPECT and V SPECT‐CT in 93 patients, Palmowski et al. reported the sensitivity of V SPECT‐CT was 95.8% and was similar to the sensitivity of V/Q SPECT [39]. V SPECT‐CT had a false negative rate of 4.2%, but had a higher false‐positive rate (17.3%) [39]. Lu et al. also used PISA‐PED criteria in Q SPECT combined with low‐dose CT and compared results with PIOPED II criteria of V/Q SPECT [40]. They revealed that using PIOPED II criteria, 12.3% of the patients were nondiagnostic for PE, but Q SPECT‐CT successfully identified both PE and non‐PE diagnoses in these cases [40]. Figure 10.3 (a) Planar perfusion scan and (b) SPECT–CT fusion images of both lungs and the mediastinal window showing massive pleural effusions and cardiomegaly. On the planar images posterior borders are flattaned and prominent attenuation can be seen due to bilateral massive pleural effusions, especially on posterior oblique views (arrows). The anterior and posterior projections also show mediastinal widening and cardiomegaly, but no segmental wedge‐shaped perfusion defect was present. On the cinematic evaluation of the Maximum intensity projection (MIP) image (not shown), an external space occupying nature of pleural effusion with the flattening of the lung borders might be emphasized.. However, in 106 patients, perfusion SPECT‐CT was shown to have higher diagnostic performance when compared to V/Q SPECT using either PIOPED II or PISA‐PED criteria [40]. Moreover, perfusion SPECT‐CT had better interobserver variability than V/Q SPECT. It was concluded that low‐dose CT exhibited an alternative diagnosis in 72% of patients. Mazurek et al. also compared the results of perfusion SPECT‐CT with SPECT in 84 patients and used the clinical follow‐up as reference to show that SPECT‐CT has increased diagnostic accuracy (88% vs. 59%), positive predictive value (72% vs. 43%), and negative predictive value (100% vs. 90%) [41]. Figure 10.4 (a) Planar perfusion scan and (b) cross‐sectional SPECT–CT fusion images. On the planar images there is no perfusion in the left lung, which has prominent emphysema (thick arrow). The mosaic perfusion pattern on the upper lobe of the right lung (a) was also due to emphysema (arrows). Coexisting pathologies can also be identified on hybrid images, such as bronchiectasis, which is usually seen as decreased perfusion. Bronciectasis as a reason for perfusion defect can be easily identified on low‐dose CT (Figure 10.7). Even small pulmonary nodules can cause perfusion defects. Sometimes these defects can have a wedge shape and may be misinterpreted as PE (Figure 10.8), therefore low‐dose CT should be correlated. The alveolar‐capillary membrane (ACM) is a semipermeable structure which separates the airspaces within the lungs from the blood. ACM is more a physiologic structure rather than anatomic and exerts its main functions in terminal bronchioles. Hydrophilic solutes which are inhaled follow the pathway of surfactant, mucous, epithelium, interstitium, and endothelium for diffusion into blood circulation. Among all these surfaces, the intact epithelium is the most impermeable and therefore is the rate‐limiting step for solute diffusion into circulation. Based on such physiological aspects, radioaerosol clearance measurements represent an index of pulmonary epithelial permeability. 99mTc‐diethylenetriamine pentaacetic acid ) in aerosol form is the radiopharmaceutical most commonly used to assess pulmonary capillary epithelial permeability. Since 99mTc‐DTPA is inhaled, it needs no intravenous injection and no in vitro; labeling. This technique also enables quantitation of pulmonary capillary permeability and can be performed quite easily and quickly. Cigarette smoking is the most obvious limitation for this technique. Technically, the rate of clearance for 99mTc‐DTPA from the lungs can be accomplished within 10 minutes of inhalation and the normal half time for healthy subjects is approximately 1 hour. The interpretation is done visually from dynamic images as well as quantitatively from time–activity curves generated from regions of interest on both lungs. Figure 10.5 Axial, sagittal, and coronal slices showing cardiomegaly and widening of mediastinal structures (a and b). A perfusion defect present at the apex of left lung has small, pleural‐based perfusion defects and corresponding bullae. Rapid 99mTc‐DTPA clearance can be encountered in many disease states that cause interstititial lung disease, such as sarcoidosis, asbestosis, silicosis, idiopathic pulmonary fibrosis, and cryptogenic fibrosing alveolitis along with hypersensitivity pneumonitis [42]. Smoking also causes interstitial lung injury and causes rapid 99mTc‐DTPA clearance, therefore smoking is a problem when interpreting the clearance studies to assess interstitial lung disease. Although smoking accelerates 99mTc‐DTPA clearance, smoking cessation can return the clearance values to normal in a very short time [43]. Minty et al. reported that smoking cessation of just 10 days was able to reverse its effects on 99mTc‐DTPA clearance in a patient with even a 20 pack‐year smoking history [44].
10
Diseases of the Pulmonary System
Anatomy of the Pulmonary System
Gross Anatomy
Bronchopulmonary Segmental Anatomy
Tracheobronchial Tree
Conduction Zone
Lobes
Segments
Boyden notation
Right lung
Upper
Apical
B1
Posterior
B2
Anterior
B3
Middle
Lateral
B4
Medial
B5
Lower
Superior
B6
Medial
B7
Anterior
B8
Lateral
B9
Posterior
B10
Left lung
Upper
Apicoposterior
B1/B2
Anterior
B3
Superior lingular
B4
Inferior lingular
B5
Lower
Superior
B6
Anteromedial (basal)
B7/B8
Lateral (basal)
B9
Posterior (basal)
B10
Respiratory Zone
Blood Supply
Innervation
Lymphatic Drainage
Pulmonary Embolism
Introduction
Interpretation by Diagnostic Probability Using Planar V/Q Images
Interpretation using Tomographic Images
Hybrid Imaging in the Diagnosis of PE
Pulmonary Epithelial Permeability Studies
Related posts:
 Nephro‐urinary Tract Pathologies: A Correlative Imaging Approach
 Lymphoma and Myeloma Correlative Imaging
 Artificial Intelligence in Diagnostic Imaging
 Imaging in Gliomas: Clinical Principles and Synergies with MRI
 Osteoporosis: Diagnostic Imaging and Value of Multimodality Approach in Differentiating Benign Versus Pathologic Compression Fractures
 The Role of Noninvasive Cardiac Imaging in the Management of Diseases of the Cardiovascular System
Stay updated, free articles. Join our Telegram channel

Full access? Get Clinical Tree


