Fig. 9.1
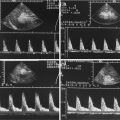
(a–c) Longitudinal section through the middle upper abdomen: the image shows the normal origin of the coeliac trunk (TC) and the superior mesenteric artery (SMA) from the descending aorta (DAO). (d) Transverse section through the middle upper abdomen shows the origin of the coeliac trunk (markers). DAO descending aorta, GB gall bladder, HA hepatic artery, PV portal vein, SA splenic artery, VCI inferior vena cava, SMV superior mesenteric vein
The coeliac and superior mesenteric arteries supply blood to the stomach and small bowel. The superior mesenteric and inferior mesenteric arteries supply blood to the colon and proximal rectum. A rich collateral network exists between the different splanchnic arteries.
The coeliac trunk supplies blood flow to the low-resistance vascular bed of the liver, spleen and stomach via the hepatic, splenic and left gastric branches. Pulsed Doppler sonography demonstrates low-resistance flow in the coeliac artery with high diastolic amplitude and high end-diastolic flow velocities (Fig. 9.2a). The low-resistance flow pattern of the coeliac artery is not dependent on food intake: The peak systolic and end-diastolic flow velocities do not change significantly after a meal.

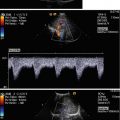
Fig. 9.2
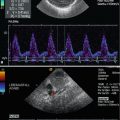
(a) Doppler sonographic flow measurement in the coeliac trunk of a 9-year-old girl. Normal systolic-diastolic positive flow (monophasic) profile with normal flow velocities. High diastolic amplitude due to low peripheral resistance: DAO descending aorta, TC coeliac trunk. (b) Doppler sonographic flow measurement in the superior mesenteric artery of a 13-year-old boy. Normal monophasic systolic-diastolic forward flow with normal flow velocities. Low diastolic flow amplitude due to high peripheral vascular resistance during fasting. DAO descending aorta, SMA superior mesenteric artery
The superior and inferior mesenteric arteries supply blood to the high-resistance vascular bed of the small and the large bowel. Pulsed Doppler reveals high impedance flow with low diastolic flow velocities in the fasting state (Fig. 9.2b). This is due to relative vasoconstriction of the splanchnic branch vessels prior to a meal, when the bowel is empty. After a meal, there is an increase of mesenteric arterial blood flow to assist digestion. Vasodilation of the splanchnic arteries causes an increase of blood flow to the intestines.
Leidig investigated 25 neonates before and after feeding (Leidig 1989). He found an increase of the peak systolic flow velocity from 57 ± 3.1 to 97 ± 11.5 cm/s and of the mean flow velocity from 22 ± 1.6 to 41 ± 4.1 cm/s.
9.3 Normal Values of the Flow Velocities in the Splanchnic Arteries
Only few reports about normal values of the flow parameters in the splanchnic arteries have been published in literature. Most papers deal with blood flow in the neonatal period and in young infants, whereas flow measurements in elder children are not available.
9.4 Dependency of the Flow Velocities on Age
Flow velocities increase in the first days and weeks of life.
Hsu et al. (1993) measured the blood flow velocities in the coeliac artery (CA) and superior mesenteric artery (SMA) immediately after delivery and consecutively for 3 days at 24-h intervals. Twenty-four hours after delivery, peak systolic flow velocities had risen significantly in the CA and SMA (p < 0.01), whereas the resistance index (RI) had significantly decreased. The most prominent haemodynamic changes in the splanchnic circulation occurred within 24 h after delivery in normal healthy newborns (Hsu et al. 1993).
Matasova et al. (2007) measured the flow velocities in the superior mesenteric artery during the first 3 days of life in healthy newborn infants. Blood flow velocities in the superior mesenteric arteries increase also during the early neonatal period in term infants. The most remarkable changes occur within the first 24 h of life. At 2 h of age, a reversed diastolic blood flow is present in the majority of infants probably due to a patent arterial duct and the fasting state of the patient.
Peak systolic flow velocities do not change between 2 h (58 ± 21.8 cm/s) and 24 h (58.5 ± 15 cm/s) but increase to 70 h (79.6 ± 17.7 cm/s).
End-diastolic flow velocities increase from 2 h (−5.2 ± 6.8 cm/s) to 24 h (12.9 ± 3.8 cm/s) with a further insignificant increase to 70 h (14.9 ± 4.7 cm/s). At 2 h of age, the mean end-diastolic flow velocity is negative in 23 of 30 cases (76.7 %). Additionally, time average flow velocities increase significantly with time.
RI decreases from 2 h (1.09 ± 0.11) to 24 h (0.78 ± 0.06) with further insignificant increase to 70 h (0.81 ± 0.06) (Matasova et al. 2007).
Papacci et al. (2009) measured the flow velocities in the coeliac trunk and the superior mesenteric artery in the first month of life. The flow velocities increased with increasing gestational and postnatal age. Papacci reported normal reference values of the flow velocities and Doppler indices (Papacci et al. 2009).
9.5 Coeliac Artery
We measured the blood flow in coeliac trunk of healthy newborns with an age of 5.4 ± 8.6 weeks. The peak systolic flow velocity was 78 ± 21 cm/s, the end-systolic flow velocity measured 29 ± 7 cm/s, and the end-diastolic flow velocity was 15 ± 4 cm/s. The resistive index was 0,79 ± 0,10 (Deeg 1989; Deeg et al. 1987).
9.6 Superior Mesenteric Artery
Van Bel et al. measured the blood flow velocities in the superior mesenteric arteries of preterm and term neonates (Van Bel et al. 1990). The peak systolic flow velocity was 70 ± 18 cm/s, the end-diastolic flow velocity was 14 ± 7 cm/s, and the mean velocity was 32 ± 11 cm/s.
9.7 Pathology
Intussusception
Infectious bowel disease
Vasculitis
Ischaemic bowel disease
Malrotation/volvulus
Strangulation
Hypertrophic pyloric stenosis
Tumours
9.8 Intussusception
Intussusception is one of the most common abdominal emergencies in infancy. Intussusception occurs when a portion of the digestive tract becomes telescoped into the adjacent bowel segment. About two thirds of the patients are boys.
Age: Intussusception usually occurs between the age of 3 months and 3 years (Baud 2008).
Symptoms: The classical triad, consisting of acute beginning with severe abdominal colics, red jelly stools or haematochezia and a palpable abdominal mass, is only present in less than 50 % of all patients with intussusception (del-Pozo et al. 1999).
Location: 90 % of all intussusceptions are ileocolic, which means that the ileum comes telescoped into the colon. Only 1–8 % of the cases are found in the small bowel (Baud 2008).
Diagnosis and Therapy: The diagnostic modality of choice is abdominal ultrasound. Sonography is highly accurate in the diagnosis of intussusception with a sensitivity of 98–100 % and a specificity of 88–100 % (del-Pozo et al. 1999). Nonsurgical reduction can be performed in more than 90 %. It can be done under sonographic or radiographic guidance with fluid or gas (del-Pozo et al. 1999; Lim 2004). If reduction is performed under sonographic guidance, physiologic saline solutions are used.
2D Image
The most frequent ileocaecal intussusception appears as an intestinal mass with a diameter ranging from 20 to 50 mm in anteroposterior diameter, lying in the lumen of the colon (Fig. 9.3a–c) (del-Pozo et al. 1999; Baud 2008). At the initial presentation, the head of the intussusception is usually found in the subhepatic region, at the right colonic flexure or the right transverse colon (del-Pozo et al. 1999).

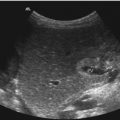
Fig. 9.3
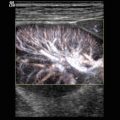
(a, b) Axial scan through an intussusception in a 3-year-old boy. The transverse section at the base of the intussusception shows the crescent-doughnut sign formed by the ileum with a large hyperechoic area of the intussuscepted mesentery in the centre. The diameter of the intussusception is 3–5 cm which is typical for an intussusception. (c) Axial scan through an intussusception at the apex shows multiple concentric rings which form a typical target sign
Axial US Scans
On axial scans, the sonographic pattern varies depending on the scanning level. The base of the intussusception is large and contains a great amount of the mesentery and of the mesocolon dragged into the intussusception (Fig. 9.3a). An intussusception is a complex structure: The intussuscipiens (the receiving loop) contains the folded intussusceptum (the donor loop) which has two components: the entering limb and the returning limb (del-Pozo et al. 1999). The attached mesentery is dragged between the entering and returning limbs (Fig. 9.3a, b).
Axial scans have a variable appearance which depends primarily on the amount of the enclosed mesentery. The enclosed mesentery is absent at the apex (Fig. 9.3c) of the intussusception and progressively increases towards the base (del-Pozo et al. 1999). The everted limb of the intussusceptum is thicker at the apex than at the base (del-Pozo et al. 1999).
Axial scans obtained at the basis show the crescent-doughnut sign (Fig. 9.3a). In this area, the amount of enclosed mesentery is maximal. The centre of the intussusceptum is formed by the ileum with a large hyperechoic area of the mesentery which contains several hypoechoic lymph nodes (Fig. 9.4a–c). The outer ring is relatively thin and hypoechoic, composed of the two colonic walls which are in contact with their mucosal surfaces (Fig. 9.3a, b).

Fig. 9.4
(a–c) Marked mesenteric lymphadenitis in two children with intussusception. The enlarged lymph nodes may lead to bowel obstruction and be the cause of intussusception. They can often be seen within the intussusception (b, c)
Axial scans obtained towards the apex show multiple concentric rings: The central ring formed by the ileum is separated from the hypoechoic outer ring by a thin hyperechoic inner ring corresponding to the mesentery or to the opposed serosal surfaces of the intussusception (Fig. 9.3b).
At the apex sonography shows a typical target appearance or multiple concentric rings (Fig. 9.3c). The core is formed by the hypoechoic collapsed ileum, surrounded by a thick ileocaecal valve. The outer ring is formed by the hypoechoic receiving colon. Trapped hyperechoic colonic gas or anechoic fluid is occasionally seen between the opposed mucosal surfaces.
Longitudinal US Scans
On longitudinal images, the arrangement of the mesentery, which may be seen on one or both sides of the central limb of the intussusceptum, causes variable appearances. On longitudinal images, the intussusception has a pseudo-kidney or sandwich sign. The intussusception shows symmetrical rectilinear rims (Fig. 9.5a, b). If the middle of the intussusception is imaged along the longitudinal axis, three parallel hypoechoic bands separated by two parallel hyperechoic bands are seen (Fig. 9.5a, b) (del-Pozo et al. 1999). If the mesentery lies on both sides of the entering limb, the sandwich sign occurs.

Fig. 9.5
(a, b) 2D image of the longitudinal section through an intussusception shows the typical hayfork sign. At the base of the intussusception, the echogenic mesenterium which is dragged into the intussusception can be seen
The outer hypoechoic bands represent the oedematous everted limb of the intussusceptum and the thin intussuscipiens; the central hypoechoic band is the central limb of the intussusceptum (del-Pozo et al. 1999).
The hayfork sign corresponds to the sandwich sign. It can be seen at the apex of the intussusception: It consists of three nearly parallel hypoechoic areas (the ‘prongs’ of the hayfork). The prongs are separated by two hyperechoic bands formed by the mesentery (del-Pozo et al. 1999). If the mesentery lies only within one side of the central limb and the intussusception is curved or imaged obliquely, the pseudo-kidney sign occurs.
Colour Doppler Imaging
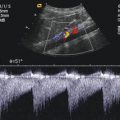
The obstruction may cause compression of the inverted mesenteric vessels. First of all, the mesenteric veins are compressed while arterial perfusion still persists. This causes swelling of the intussusceptum and leads to bowel oedema, ischaemia and haemorrhagic necrosis. Colour Doppler is helpful to demonstrate the vascularisation of the intussusceptum (Fig. 9.6). Several reports in literature showed that the demonstration of internal vessels within the intussusceptum may determine the viability of the intussuscepted bowel wall (Hanquinet et al. 1998; Lam and Firman 1992; Lim 2004).

Fig. 9.6
(a–d) Colour Doppler sonogram of the internal vascularity of intussuscepted bowel loops. The illustrations show good perfusion of the intussusception. (e) Colour Doppler of the flow in the intussusceptum before the Bauhin valve before successful reposition. (f) Spectral Doppler of the flow in a compressed vein within the intussusceptum in the region of the Bauhin valve with flow veloicities of 80 cm/sec
Lim (2004) investigated 65 infants with intussusception with colour Doppler. He found blood flow in 62 of 65 cases of intussusception; pneumatic reduction was achieved in 58 (94 %) of these 62 cases. Four patients (6 %) underwent manual reduction of viable bowel; three patients (5 %) who had no colour Doppler signal underwent segmental resection. The difference in reduction rates based on blood flow was statistically significant (p = .0008). Lim states that US is sensitive and specific in the diagnosis of intussusception and colour Doppler is a promising predictor of bowel viability (Lim 2004).
Kong et al. (1997) investigated 134 patients with intussusception by colour Doppler. Colour flow was present in 121 cases of intussusception (group A) and was absent in 13 cases (group B). Young age and duration of symptoms greater than 48 h were significantly related with non-visualisation of blood flow detected by colour Doppler sonography (p < 0.05). The successful rate of air reduction was significantly higher in group A than in group B (109 of 121 vs 4 of 13). Colour Doppler sonography is useful to predict the reducibility of an intussuscepted intestine. In this series, bowel necrosis was not statistically correlated with the absence of Doppler signals. Kong et al. state that the non-visualisation of blood flow by colour Doppler is not a contraindication for air reduction (Kong et al. 1997).
9.8.1 Reposition of the Intussusception
The usual course of untreated intussusception is bowel obstruction followed by bowel perforation with peritonitis and septic shock. Currently, the overall perforation rate in developed countries lies under 3 % (Stringer et al. 1992).
In the vast majority of patients, conservative reposition with an enema can be performed. The only contraindications for conservative treatment are shock, bowel perforation and peritoneal signs.
The goal of any type of therapy is to reduce the intussusception by exerting pressure on the apex of the intussusceptum and to push it from the pathologic position into the original one. Reposition of the intussusception can be performed by air or liquid. The danger of bowel perforation by liquid is somewhat lower than by reposition with gas (del-Pozo et al. 1999).
The success of the conservative treatment by enema can be controlled by fluoroscopy or sonography. The advantage of reposition under sonographic control is the avoidance of radiation exposure.
In the vast majority of European countries, hydrostatic reduction under sonographic guidance is performed. Studies have shown a high reduction rate between 76 and 95 % (del-Pozo et al. 1999).
Sonography makes it possible to display the influx of fluid into the colon and to follow the retrograde motion of the intussusceptum towards the ileocaecal valve with filling of the ileal loops (Fig. 9.7). During reduction, the saline solution outlines the intussusceptum that must be followed to the ileocaecal valve. The intussusceptum appears as a bowel mass within the fluid-filled caecum (Fig. 9.7a, b). Reposition is successful if the head of the intussusceptum is no longer visible and there is free passage of fluid from the caecum into the terminal ileum. After successful reposition, the ileocaecal valve is often thickened (Fig. 9.7d and 9.8a, c, e). With colour-coded Doppler sonography, reactive hypervascularisation can be shown (Fig. 9.8b, d). Colour Doppler displays the inflow of fluid into the ileum blue (Fig. 9.9a). Forward flow from the ileum into the colon is displayed red (Fig. 9.9b). Sometimes antegrade flow from the ileum to the colon through the swollen ileocaecal valve looks like the eruption of a volcano (Fig. 9.9b).


Fig. 9.7
(a–c) Hydrostatic reduction of an ileocolic intussusception under sonographic control (a, b: transverse; c: longitudinal section). The images show fluid around the intussusception. (d) Transverse section through the right lower abdomen after successful reposition of an intussusception. Thickened ileocaecal valve und thickened terminal ileum with enlarged lymph nodes . Narrowed ileal lumen (I)
Fig. 9.8
(a, c) 2D image of a severely swollen ileocolic valve after successful reduction of an intussusception. (b, d) Colour-coded Doppler sonogram of the swollen ileocolic valve after successful reposition shows increased vascularity due to increased perfusion. (e) Endoscopic image of a swollen ileocolic valve after successful reposition of an intussusception
Fig. 9.9
(a, b) Colour-coded Doppler sonogram of inflow (a) and outflow (b) through the open ileocolic valve. The inflow (a) is displayed blue, and the outflow (b) is displayed red. The normal inflow and outflow prove the successful reduction
Criteria for successful reposition are the complete disappearance of the intussusceptum from the large and small bowel, the reflux of fluid into the ileum and fluid filling of the ileal loops (Fig. 9.9).
9.8.2 Post-enema Sonography
After successful reposition, sonographic controls should be performed to rule out residual intussusception, pathologic lead points and recurrence, which occur in about 10 % of all patients. Post-enema sonography often shows pathologic thickening of the terminal ileum which is caused by oedema and marked hypertrophied Peyer’s patches which serve as lead points for the development of intussusception (Fig. 9.10). Colour Doppler reveals increased vascularity in the thickened wall of the terminal ileum (Fig. 9.10b–d).

Fig. 9.10
(a) Post-intussusception cockade after successful reduction of an intussusception. Thickened terminal ileum. (b–d) Increased vascularity in the thickened terminal ileum (b, c: transverse; d: longitudinal section)
9.9 Infectious Bowel Disease
Doppler sonography is indicated in various forms of infectious diseases of the gastrointestinal tract. The intestinal wall can be visualised using high-resolution linear transducers of 10–14 MHz. The normal intestinal wall thickness in the terminal ileum, caecum and right and left colon is <2 mm when examined with graded compression (Dietrich et al. 2007). Vascularisation can be mainly displayed in the second hyperechoic (submucosal) layer as well as in vessels penetrating the muscularis propria.
Acute or chronic inflammation of the intestinal wall is accompanied by increased perfusion of the mesentery, which can be displayed nonquantitatively with colour duplex (Dietrich et al. 2007). In contrast, ischaemia is characterised by hypoperfusion of the mesenteric arteries, and the bowel wall is characterised by decreased or missing vascularisation. The most promising sonographic approach in assessing splanchnic arteries and the bowel wall is combining the analysis of superior and inferior mesenteric inflow by pulsed Doppler scanning (systolic and diastolic velocities, resistance index) with the end-organ vascularity by colour Doppler imaging (Dietrich et al. 2007).
In acute inflammatory diseases such as necrotising enterocolitis, colitis and acute appendicitis, sonography and Doppler sonography are important diagnostic tools.
In other acute infectious bowel diseases such as acute gastroenteritis due to rota-, noro- and adenoviruses as well as in bacterial infections due to salmonella, campylobacter, etc., duplex sonography is not helpful.
Chronic inflammatory bowel diseases comprise Crohn’s disease and ulcerative colitis.
Various reports about the usefulness of Doppler sonography in infectious bowel disease have been published (Quillin and Siegel 1993, Shirahama et al. 1999, Siegel et al. 1997, Teefey et al. 1996). Many diseases of the gastrointestinal tract are characterised by increased thickness of the bowel wall. Colour Doppler helps to differentiate between inflammation and ischaemia (Shirahama et al. 1999; Teefey et al. 1996). Absence of or barely visible colour Doppler flow and absence of arterial signal suggest ischaemia; readily visible colour Doppler flow and a stratified echotexture suggest inflammation. A resistive index less than 0.60 indicates inflammation (Teefey et al. 1996). In contrast to most other abdominal diseases, infectious bowel wall diseases are associated with increased blood flow to the affected bowel (Quillin and Siegel 1993, Shirahama et al. 1999, Siegel et al. 1997, Teefey et al. 1996).
9.9.1 Acute Inflammatory Bowel Disease
Acute inflammatory bowel diseases in which Doppler sonography is indicated are necrotising enterocolitis of the preterm infant and acute appendicitis in elder children.
9.9.1.1 Necrotising Enterocolitis of the Preterm Infant
Necrotising enterocolitis (NEC) is the most frequent abdominal emergency in preterm infants, born with a gestational age of less than 30 weeks and a birth weight under 1,000 g. Apart from prematurity and low birth weight, additional risk factors are intestinal ischaemia caused by foetal or postnatal ischaemia. Other risk factors are cardiovascular abnormalities which cause bad intestinal blood flow such as leakages of the aortic Windkessel and obstructions of the left heart.
Leakages of the aortic Windkessel are patent ductus arteriosus, common arterial trunk, aorticopulmonary septal defect, severe aortic regurgitation and great arteriovenous communications.
Leakages of the aortic Windkessel cause low diastolic flow and are associated with a decrease of the time average velocity. This may cause a decrease of volume flow and result in bad intestinal perfusion and lead to NEC (Carlo et al. 2007).
Severe obstructions of the left heart are hypoplastic left heart syndrome, severe aortic stenosis, coarctation of the aorta and interrupted aortic arch. Left heart obstructions are associated with low systolic and time average flow velocities; they may also cause bad intestinal perfusion and lead to NEC. Patients with hypoplastic left heart syndrome often show retrograde diastolic blood flow in the superior mesenteric artery before and after Norwood procedure (Harrison et al. 2005).
Preterm infants with abnormal blood flow in the mesenteric circulation are particularly vulnerable for NEC. Bad intestinal perfusion in patients with congenital heart disease may cause necrotising enterocolitis even in full-term neonates.
2D Image and NEC
2D sonography may show thickened bowel wall, pneumatosis intestinalis, portal venous gas and gas in the periphery of the liver, free abdominal fluid and free intra-abdominal gas (Silva et al. 2007). All above-mentioned sonographic signs however are not pathognomonic for NEC. The more of these signs can be found, the more probable NEC is.
Thickened Bowel Wall
Similar to other inflammatory bowel diseases thickening of the bowel wall can be seen. Cross section of the affected bowel wall shows a cockade with a hyperechoic centre and a surrounding hypoechoic ring with decreased echogenicity (Fig. 9.11a). Longitudinal sections through the affected bowel show a tubular structure with an echogenic lumen surrounded by two hypoechoic linear structures, the thickened bowel wall (Fig. 9.11b).

Fig. 9.11
Thickened bowel wall in a premature newborn with necrotising enterocolitis (NEC). (a–c) Necrotising enterocolitis in a premature infant shows thickened bowel walls (markers) (a, b: transverse; c: longitudinal section)
Pneumatosis Intestinalis
2D sonography can clearly depict intramural gas bubbles which appear as punctate focal areas of increased echogenicity within the thickened bowel wall (Fig. 9.12a, b). They represent pneumatosis intestinalis (Fig. 9.12d). Large quantities of intramural gas cause multiple dots of increased echogenicity in the anterior wall of the bowel which prevent sound transmission to the posterior wall, which can no longer be displayed (Fig. 9.12c). The gas can get access to the superior and inferior mesenteric veins. From here, it is transported to the portal vein and into the liver. In these cases, gas bubbles can be seen as moving areas of focal increased echogenicity within the portal vein (Fig. 9.13a, b). The gas bubbles gather in the capillary bed of the liver where they appear as multiple areas of increased echogenicity (Fig. 9.13c).


Fig. 9.12
Intramural and hepatic gas in NEC. (a, b) Intramural gas in a premature infant with necrotising enterocolitis. Multiple punctate echogenic foci due to intramural gas. (c) Multiple punctate echogenic foci due to severe intramural gas in the anterior wall of the transverse colon of an infant with NEC. The lumen and the posterior wall of the colon can no longer be displayed due to intramural gas bubbles in the anterior wall (Courtesy of Ingmar Gassner MD, Innsbruck). (d) Intraoperative picture of small and large intramural gas bubbles in the bowel wall of an infant with NEC
Fig. 9.13
(a, b) Singular gas bubbles within the portal vein of infants with NEC (arrows). Real-time images reveal the moving punctate foci of echogenicity within the portal vein. (c, d) Intrahepatic gas in infants with NEC. Multiple starlike punctate echogenic foci in the periphery of the liver. (e) Doppler sonographic flow measurement in the portal vein of an infant with NEC and intraportal venous gas. The gas bubbles cause multiple irregular peaks within the Doppler spectrum
Pulsed Doppler recording of the flow within the portal vein shows multiple artefacts in the form of irregular peaks within the Doppler spectrum caused by the gas bubbles (Fig. 9.13d).
Free Abdominal Fluid
Free abdominal fluid can be found in NEC too. It can be shown either in the lower abdomen behind the bladder or in the Morrison pouch between the liver and the right kidney (Fig. 9.14a). Large amounts of fluid can also be seen in longitudinal sections through the right or left flank (Fig. 9.14b). Free abdominal fluid without internal echoes is not a sign of intestinal perforation (Fig. 9.14a, b). The presence of intraperitoneal fluid at US, particularly if it is complex or echogenic, is suggestive of bowel perforation (Fig. 9.14c). Free abdominal fluid is much more accurately depicted with US than by abdominal radiography. This finding, however, is nonspecific and may also be seen in intraperitoneal haemorrhage, with other causes of peritonitis, or in the presence of peritoneal dialysis catheters.

Fig. 9.14
Free abdominal fluid in premature infants with NEC. (a, b) Longitudinal section through the right liver lobe (a) and the left upper abdomen (b) shows echo-free fluid around the liver and the thickened bowel walls. (c) Longitudinal section through the left abdomen in an infant with NEC shows a large amount of intra-abdominal fluid with internal echoes suspicious of bowel perforation
Free Abdominal Gas
Free abdominal gas is traditionally diagnosed with abdominal radiography performed with a horizontal beam but may also be detected with US. Free abdominal gas is suspicious of intestinal perforation. It can be seen below the costal margin in the region of the liver or spleen (Fig. 9.15a). Free intra-abdominal gas causes multiple reverberation echoes (Fig. 9.15a). In the case of intestinal perforation, these organs disappear during respiration behind a curtain of multiple reverberation echoes caused by free abdominal gas (Fig. 9.15b).

Fig. 9.15
(a, b) Free intra-abdominal gas due to intestinal perforation in premature infants with NEC. The gas is characterised by multiple reverberation echoes similar to a curtain which move to and fro with respiration. (a) Longitudinal section through the right upper abdomen; (b) longitudinal section through the right liver lobe (b) with courtesy of Ingmar Gassner, Innsbruck)
Doppler Sonography
Doppler sonographic flow measurements in the abdominal arteries of patients with NEC have shown increased flow velocities in the superior mesenteric artery (SMA) in comparison with healthy infants (Fig. 9.16) (Kempley and Gamsu 1992; Deeg et al. 1993). Kempley and Gamsu measured the mean blood flow velocities in the SMA of infants with confirmed NEC, suspected NEC in comparison with a healthy control group. SMA mean blood flow velocities were significantly higher in infants with confirmed necrotising enterocolitis (36.5 cm/s) than in unfed healthy controls (20.4 cm/s) or infants with unconfirmed enterocolitis (19.6 cm/s) (Kempley and Gamsu 1992). Kempley and Gamsu found no difference in the flow velocities in the coeliac trunk and the anterior cerebral artery in the different groups.

Fig. 9.16
Doppler sonographic flow measurement in the mesenteric arteries of infants with NEC. (a) Doppler sonographic flow measurement in the superior mesenteric artery of an infant with NEC: increased flow velocities with peak systolic flow velocity of 96.7 cm/s, typical of NEC. (b) Graphic illustration of the flow velocities in the superior mesenteric artery in 9 infants with NEC (black columns) in comparison with a healthy control group (hatched columns). Significant increase of the peak systolic and time average flow velocities
We found a significant increase of the peak and time average flow velocities in the SMA in comparison with an age- and weight-matched healthy control group (Fig. 9.16b) (Deeg et al. 1993).
In patients with NEC, peak systolic flow velocities were 119 ± 58 cm/s (control, 68 ± 21 cm/s), and time average velocities were 28 ± 13 cm/s (control, 13 ± 6 cm/s). The end-systolic and end-diastolic flow velocities were not significantly different in both groups (Fig. 9.17b) (Deeg et al. 1993) (Table 9.1).

Fig. 9.17
(a, b) Doppler sonographic flow measurement in the coeliac trunk of infants with NEC: increased flow velocities with peak systolic flow velocities over 1 m/s, typical of NEC. (c) Graphic illustration of the flow velocities in the coeliac trunk of 14 infants with NEC (black columns) in comparison with a healthy control group (hatched columns). Significant increase of the peak systolic and time average flow velocities
In contrast to Kempley and Gamsu, we also found a significant increase of the flow velocities in the coeliac trunk (Fig. 9.17) (Deeg et al. 1993). In patients with NEC, peak systolic flow velocities in the coeliac trunk were 124 ± 40 cm/s (control, 73 ± 11 cm/s), and time average velocities were 40 ± 15 cm/s (control, 20 ± 5 cm/s) (Fig. 9.17c) (Deeg et al. 1993). The end-systolic and end-diastolic flow velocities were not different in both groups (Table 9.2).
The interpretation of the increased peak systolic and time average flow velocities in patients with NEC is difficult. It is probably caused by inflammation of the affected bowel. The increase of the flow velocities can be caused either by an increase of the volume flow or by a decrease of the vessel diameter. An increase of the volume flow in the very sick premature infants with problems in maintaining a stable blood pressure is very improbable. An increased bowel perfusion would also increase the end-systolic and end-diastolic flow velocities – increases which could not be found in our patients. The most probable explanation for the increased blood flow velocities within the mesenteric arteries is vasoconstriction. The lack of an increase of the diastolic flow velocities (end systolic and end diastolic) and a simultaneous increase of the resistive index in the coeliac trunk (from 0,72 ± 0,10 in control infants to 0,80 ± 0,09 in patients with NEC) constitute a strong argument for the vasoconstriction theory (Deeg et al. 1993). According to the Bernoulli equation, flow velocities increase if the vessel diameter decreases. A further reduction of the vessel diameter could eventually cause a decrease of the flow velocities. Due to the pulsatile blood flow in the arterial system, systolic and diastolic flow alterations can differ: This may cause a decrease of the diastolic flow although the systolic flow further increases.
Other authors however favour the hyperperfusion theory (Kempley and Gamsu 1992).
If a baby is operated upon, the serosal surface of affected bowel is often noticed to be inflamed; the increased SMA and TC velocities in necrotising enterocolitis could therefore result from an inflammatory response in the remaining ‘healthy’ bowel (Kempley and Gamsu 1992). Kempley and Gamsu states that flow velocities in the mesenteric arteries may be increased, due to the inflammatory process involving the bowel and gut. This may increase volume flow and total bowel perfusion although the affected bowel is hypoperfused.
Flow measurements in the portal vein may demonstrate flow alterations caused by intraportal gas bubbles (Fig. 9.13d). They cause a characteristic audio signal and small peaks within the otherwise smooth flow spectrum of the portal vein (Fig. 9.13d).
As mentioned earlier, several cardiovascular abnormalities are associated with an increased risk of developing NEC, especially leakages of the aortic Windkessel and obstructions of the left heart. Leakages of the aortic Windkessel cause a very low diastolic flow (Fig. 9.18a, b), whereas left heart obstructions lead to a reduced systolic flow (Fig. 9.18c). In both cases, the time average flow velocity is reduced which causes a dramatic decrease of volume flow and bowel perfusion.


Fig. 9.18
Doppler sonographic flow measurements within the coeliac trunk in infants with congenital heart disease which make these patients vulnerable for NEC. (a, b) Flow measurement in patients with patent ductus arteriosus Botalli. Missing diastolic flow which is associated with low time average flow velocity and bad perfusion. (c) Flow measurement in a patient with coarctation of the aorta. Very low systolic flow associated with low time average velocity and low perfusion
Table 9.2
Comparison of the flow velocities in the coeliac trunk of 14 infants with necrotising enterocolitis with the flow velocities in a healthy control group
NEC | Control | p | |
|---|---|---|---|
Vs | 124 ± 40 | 73 ± 11 | ≤0,01 |
Ves | 49 ± 32 | 32 ± 10 | n.s. |
Ved | 27 ± 18 | 21 ± 7 | n.s. |
TAV | 40 ± 15 | 20 ± 5 | ≤0,05 |
RI | 0,80 ± 0,09 | 0,72 ± 0,10 | ≤0,05 |
Table 9.1
Comparison of the flow velocities in the superior mesenteric artery of 9 infants with necrotising enterocolitis with the flow velocities in a healthy control group
NEC | Control | p | |
|---|---|---|---|
Vs | 119 ± 58 | 68 ± 21 | ≤0,05 |
Ves | 21 ± 12 | 20 ± 8 | n.s. |
Ved | 10 ± 9 | 12 ± 7 | n.s. |
TAV | 28 ± 13 | 13 ± 6 | ≤0,05 |
RI | 0,88 ± 0,12 | 0,84 ± 0,08 | n.s. |
Colour Doppler
Faingold et al. have shown that with NEC, a variety of patterns of bowel wall perfusion may be depicted with colour Doppler US (Faingold et al. 2005). They state that the absence of bowel wall perfusion at colour Doppler US is more sensitive and specific than the presence of free air at abdominal radiography in the detection of necrotic bowel in NEC (Faingold et al. 2005).
Faingold et al. developed a standardised colour Doppler US protocol that detected bowel wall perfusion accurately and reproducibly in healthy infants (Faingold et al. 2005). Colour Doppler parameters included the lowest possible pulse repetition frequency without aliasing, a low wall filter, and the highest Doppler gain settings without flash artefacts. Velocity was set at 0.029–0.11 m/s. Mural perfusion was evaluated by counting the number of colour Doppler signals as dots and lines per square centimetre. Colour Doppler flow was determined to be present when colour Doppler signals were reproducible or confirmed with pulsed Doppler waveforms (Faingold et al. 2005). In patients with suspected NEC, bowel loops were interrogated for the presence or absence of mural blood flow and compared with adjacent loops. When bowel loops without mural blood flow were identified, the settings were changed to more sensitive settings in an attempt to detect the slowest possible velocities down to 0.029 m/s, below which only flash artefacts were obtained. A variety of patterns of increased bowel wall perfusion could be seen in the patients with Bell stages I and II NEC. Increased bowel wall perfusion was depicted as a marked increase in colour Doppler signals in the bowel wall and/or mesentery (Fig. 9.19). It was interpreted as reflecting marked hyperaemia due to vasodilatation (Faingold et al. 2005). In some involved loops, the colour Doppler signals formed a complete ring of colour in the bowel wall (Fig. 9.19a). In others, the flow in the supplying subserosal mesenteric vessel and bowel wall had a Y-shaped appearance (Fig. 9.19b).

Fig. 9.19


(a, b) Colour Doppler sonogram of the flow in the intestinal bowel loops in infants with NEC. The image shows good perfusion in large parts of the bowel. Additionally, parts of the bowel show no vascularity possibly caused by ischaemia and hypoperfusion. (c) Intraoperative picture with fibrinoid necrosis of an infant with NEC
Related posts:
Stay updated, free articles. Join our Telegram channel
Full access? Get Clinical Tree
