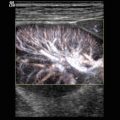
Fig. 14.1
Typical flow patterns in peripheral arteries. (a) Laminar flow in an arterial vessel. In small vessels, blood behaves like a Newton fluid (no internal friction); therefore, the velocity of the blood in the centre of the vessel is at a maximum and decreases in a parabolic shape to the vessel wall. In the pulsed Doppler display, laminar flow may result in a broadening of the spectral line and filling of the ‘spectral window’ with pixels of various flow velocities, if the sample volume is big enough to cover the whole vessel diameter. According to fluid physics and Doppler sample volume size of most systems, this waveform occurs in vessels with a diameter of less than 5 mm. The filling of the spectral window is often termed ‘spectral broadening’. In the colour Doppler images, the broadening results in homogeneous colours with high-velocity colours in the vessel centre and no aliasing colours in the image. Besides a laminar flow, a very high pulsed Doppler beam angle near 90° may result in an ‘intrinsic’ spectral broadening (due to the trigonometric increasing error of the velocity measurements) and therefore should be avoided whenever possible (Chavhan et al. 2008). (b) Flow in a blood vessel with a ‘flattened’ profile. The velocity of the blood is relatively uniform over the cross-sectional area of the vessel, decreasing steeply near the vessel wall due to friction. This flow profile is the result of the physical fact that blood in greater vessels behaves like a non-Newton fluid with internal friction between the corpuscular parts. In the pulsed Doppler display, this results in a narrow spectral line and a clear ‘spectral window’, a term which indicates that there are no or very rare pixels between the spectral line and the baseline of the Doppler display if the sample volume is small enough that the near-wall flow components are excluded from sampling (e.g. in great vessels like the aorta). In the colour Doppler images, this results in a very uniform colour of the vessel with no central high-velocity zone and no aliasing colours. (c) Turbulent flow: Turbulent flow shows an extremely wide range of flow velocities, including reversed flows, and results in multiple colours and aliasing colours on the colour map. In the pulsed Doppler display, a turbulent flow shows a strong spectral broadening with components below zero (backflow). Turbulent flow is considered as a normal finding near vessel bifurcations (e.g. the carotid bulb), but elsewhere it is termed pathologic
In practice (with respect to theoretical fluid dynamics calculations), in all arteries besides the aorta, a laminar flow should be present. Spectral broadening in peripheral arteries should not be misinterpreted as turbulent flow. In most cases, the Doppler sample volume investigating the vessels is oversized, and the spectral broadening is due to measurement of the near-wall slow-flow components (Boote 2003).
If no spectral broadening is present, the flow in the vessel is often ‘blunt’ due to internal friction of the blood corpuscular elements.
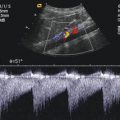
Figure 14.1c demonstrates the change of a physiologic triphasic (laminar) flow profile with no spectral broadening and a ‘low-impedance’ (laminar) flow profile with spectral broadening.
It should therefore be pronounced here that spectral broadening either proves or excludes the presence of (physiologic) laminar flow.
Turbulent flow in most cases has inverse components seen as negative flow below the zero axis.
The normal peripheral artery flow profile has a triphasic shape (see Fig. 14.2) (Pellerito 2001); in the case of mild arterial stenosis, the diastolic positive third component disappears; in severe stenosis, high peak flow velocities are present and turbulent flow is seen; and poststenotic measurements reveal a damped flow profile with a low-impedance shape.
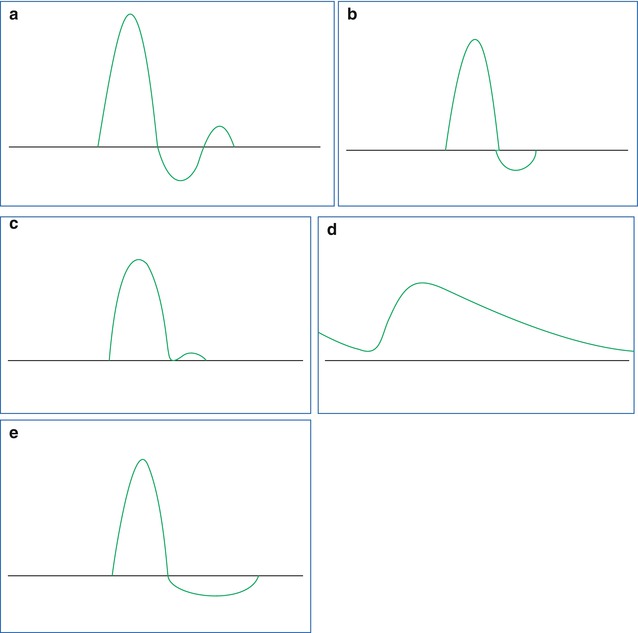
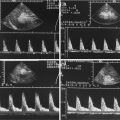
Fig. 14.2
Typical shapes of the timely flow profile in peripheral arteries. (a) Normal triphasic arterial flow in a peripheral vessel. (b) A proximal arterial stenosis results in a modification of the normal triphasic velocity waveform. The second (reverse) flow phase is reduced, and the third phase may disappear. (c) In severe proximal arterial stenosis, the second phase of the flow will become positive, and the third phase disappears. If the sample volume is placed in the stenotic segment of the vessel, high peak flow velocities will be recorded. (d) Shows the slow rise time in systole with continuous flow throughout the cardiac cycle. In principle, this can occur in a proximal occlusion situation with existing collateral perfusion. But the same flow profile can result from a mere lowering of the peripheral resistance, e.g. if a vascular malformation is sited distal from the measuring point or if a physiologic regulation event lowers arteriolar resistance (e.g. hyperperfusion state of the muscles during exercise; see Fig. 14.3). (e) Holodiastolic negative flow occurs if the diastolic blood flow is inverse due to a steal syndrome (e.g. AV malformation in a parallel vessel segment) or if the tissue pressure downstream is higher than the diastolic blood pressure which leads to a diastolic reversal of the perfusion due to diastolic compression of the blood vessels
Diastolic negative flow over the whole cardiac diastole is seen if a steal effect is present (e.g. an AV malformation; see Fig. 14.2). The investigator has to be aware of the fact that in most cases the shape of the flow profile can be due to different physiologic or pathologic states; therefore, the clinical history of the patient is necessary to obtain the correct diagnosis. For example, an inflammation or a postexercise state of a limb can mimic a flow profile of severe arterial stenosis (see Fig. 14.3).
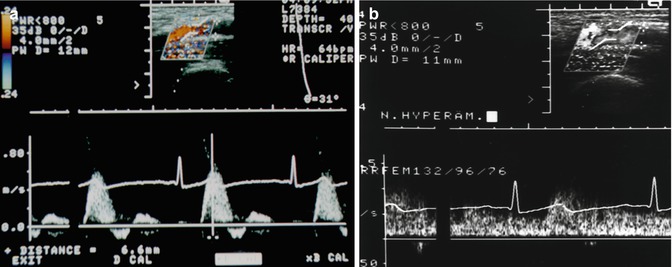
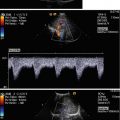
Fig. 14.3
Variation in the arterial flow in accordance to the local physiologic state. Doppler recording in a 25-year-old female volunteer. (a) Normal triphasic flow profile in the superficial femoral artery. This profile is termed a high-resistance (high-impedance)-type Doppler spectrum. (b) After 4 min of ischaemic stress (by a manual occlusion of the artery with a blood pressure cuff at 300 mmHg pressure and reopening after 4 min), the flow profile has changed to a laminar profile with no triphasic components due to the increased arterial blood flow volume and the lowered peripheral (arteriolar) resistance. Similar findings are seen after physical exercise (Rupprecht 1995) and in local inflammation
Published normal average peak systolic velocity values in the adult subclavian artery, axillary artery and brachial artery are 105, 80 and 60 cm/s, respectively.
Normal flow velocities for the adult common femoral, superficial femoral, popliteal and tibioperoneal arteries are in the range of 100 cm/s, 80–90 cm/s, 70 cm/s and 40–50 cm/s, respectively (Chavhan et al. 2008).
In our and other groups’ experience, lower velocities are normally seen in children. The lack of published normal values for the paediatric age group diminishes the value of the measurement of absolute flow velocities in clinical decision-making.
14.1.2 Normal Venous Flow
Normal venous flow is affected by backflow that results from cardiac action and by phasic changes due to respiration. The impact of respiratory phases on the venous waveform depends on the distance of the vein from the lung. Venous waveforms are often termed as S, v, D and a waves (see Fig. 14.4).
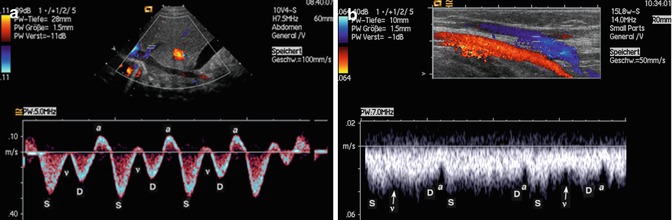
Fig. 14.4
Normal venous flow patterns. (a) Normal venous flow shows in a central vein: a, S, v and D waves that represent a superimposition of right atrial pressure changes during the cardiac cycle and pressure variations during the respiratory cycle. The flow is directed to the heart. (b) Normal flow in a peripheral vein (cubital vein). The a wave is less pronounced as in the central veins, and the S, v and D waves can hardly be detected although apparently present. The colour map shows a homogeneous blue-coded flow without turbulences
S is the first systolic wave, which results from negative intraatrial pressure with movement of the atrioventricular septum toward the cardiac apex.
The v wave is the result of positive intraatrial pressure due to overfilling of the right atrium.
D is the diastolic wave, which results from negative intraatrial pressure caused by the opening of the tricuspid valve.
The a wave reflects positive intraatrial pressure during atrial systole (Chavhan et al. 2008). In veins far away from the lung, the shape of the flow profile changes until a near continuous flow profile is reached (Figs. 14.4 and 14.5).
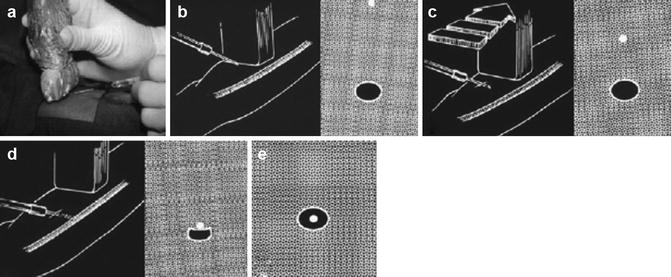
Fig. 14.5
Vascular access techniques using colour Doppler sonography: transducer positioning and principle of the puncture. (a) The sterile-wrapped transducer is oriented transversely to the vessel; the puncture is done along the vessel axis. (b) Drawing of the transducer over needle puncture; right drawing of the typical sonographic image locates the needle tip below the surface (white circle) on its way to the target vessel below (dark circle). (c) Left picture shows transducer movement; following the needle tip toward the target vessel, right drawing shows the needle tip approaching the target vessel. (d) Left and right picture and drawings show the needle just above the target vessel. (e) The needle tip has entered the target vessel wall and is seen within the vessel lumen
Qualitative and quantitative analysis of the venous flow is far less often part of a Doppler examination as the analysis of arterial flow pattern. Probably this is due to the fact that normal values of the venous flow velocities and Doppler flow patterns are not investigated systematically and that too many influences are present which complicate the findings.
Similar to the situation for limb arteries, the published normal values for paediatric peripheral veins are sparse. The maximum flow velocity in femoral veins in adults is 12–30 cm/s, the flow velocity in the distal peripheral veins is thought to be lower and paediatric limb vein normal values are not published (Chavhan et al. 2008).
Increased intra-abdominal pressure results in a reduction of venous return from the lower limbs and a decrease in venous flow velocity and a ‘damping’ of the flow pattern.
14.1.3 Interpretation of the Colour Map
For a correct interpretation of the colour map, instrumentation controls should be set in a way that the maximum velocity in the map is lower than the aliasing border. The investigator has to decide whether, and in which colour, the standard deviation of the flow velocities should be coded in the map.
A standard investigation routine could consist of four steps for vessel segment:
Report if the vessel shows flow/no flow (or is completely absent in the colour map).
Report the direction of flow in the vessel.
Compare the flow velocities semiquantitatively expressed as colour intensity in both sides of the patient’s limb if appropriate.
Report turbulence if seen in the map.
Report the peak systolic flow velocity and report on the shape of the arterial/venous flow pattern. Since normal values are sparsely known for paediatric peripheral vessels, in most cases, a reference vessel has to be used to decide if a flow velocity or the shape of the pulsed Doppler flow pattern is normal.
Report on the possible compression (by the transducer) of the vessel in venous investigations.
As in the other investigation fields, the investigator should keep in mind that the resulting arterial and venous flow profiles and colour maps are modified not only by local factors (like stenosis and the local physiologic state (see Fig. 14.3)). Besides these local influences, parallel connected pathologic vessels, e.g. AV shunts (see chapter TCDI about Fourier series-like influences), and systemic influences like cardiac and pulmonary disease can result in significant modifications of the local arterial and venous flow. Therefore, the investigation of reference vessels (e.g. on the other body side) is in any case mandatory.
14.2 Clinical Indication of Peripheral Vessel and Soft Tissue CDI
In practice, the field can be divided into four main indication groups:
Colour Doppler-guided vascular access techniques
Vascular disease (venous and arterial occlusion)
Vascular malformations and haemangiomas
Investigation of other soft tissue tumours
14.2.1 Colour Doppler-Guided Vascular Access Techniques
CDI in the last years has become a broadly used tool to optimise vascular access (catheterisation) in children (Benkhadra et al. 2012). CDI-guided vascular access of central and peripheral intravenous lines fastens vascular access and avoids catheter malpositioning (Benkhadra et al. 2012; Dumond et al. 2012; Rauch et al. 2009).
Biopsy transducers for interventions are used routinely; in many centres, they have the advantage of strict needle control and positioning (Donaldson 2006). We, as many others, prefer freehand vascular techniques.
In general, the transducer can be oriented in parallel to the target vessel or transversely as Fig. 14.6 demonstrates schematically the workflow for CDI-guided vascular access.
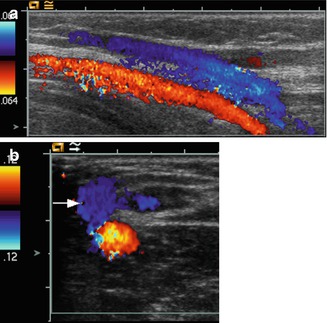
Fig. 14.6
Punction of the cubital vein in a child with a high body mass index where the physicians are unable to locate any vessels by clinical investigation. (a) CDI identifies the cubital vein as the target vessel (coded blue), parallel transducer orientation. (b) The needle tip is localised in the target vessel (white arrow), transverse transducer orientation
CDI is very useful to determine if the targeted vessel is an artery or a vein. We mostly use a transverse transducer position and change to a parallel orientation after vascular access to verify the exact location of the needle tip.
14.2.2 Vascular Disease (Venous and Arterial Occlusion)
14.2.2.1 Vascular Disease
Thrombosis of the limb veins is similar as in adult patients seen after prolongated immobilisation and/or due to hypercoagulability states including hormonal contraception.
Figure 14.7 shows schematically the investigation principle and Fig. 14.8 a clinical case study.
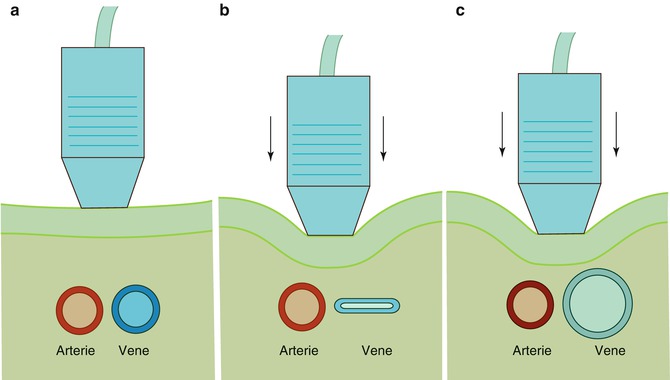
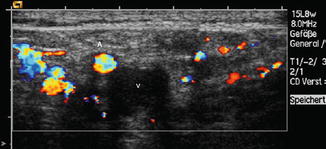
Fig. 14.7
Compression sonography in suggested vein thrombosis: (a) Artery and vein are both seen in normal size without transducer pressure. (b) After gentle transducer pressure, the normal vein can easily be compressed. (c) A thrombotic vein remains unchanged in shape and size during the compression manoeuvre
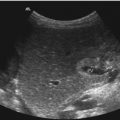
Fig. 14.8
Thrombosis of the left common femoral vein. The dilated vein (V ) is completely filled with a hypoechogenic thrombus and not compressible. Flow in the femoral artery (A) is normal. No compression of the vein by the transducer is possible. Note the dilated collateral veins which show a high flow velocity with aliasing
Vascular disease (arterial and venous) is rare in paediatric patients; imaging technique and clinical presentation are not different to the findings in adult patients; therefore, the reader is referred to the specialised angiologic literature for further reading.
Many arterial and venous flow disturbances in the limb vessels in childhood have an iatrogenic origin. Femoral artery catheterisation leads to pulse strength discrepancies between both sides in about 5 % of infants (Dumond et al. 2012) suggesting partial thrombosis in these patients. Iatrogenic AV fistulas occur after cardiac catheterisation and placement of central venous catheters. Figure 14.9 shows an example.
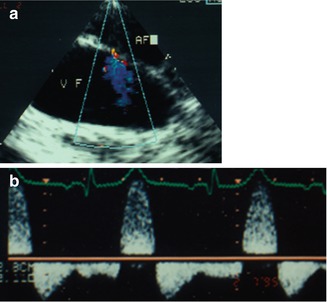
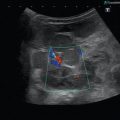
Fig. 14.9
CDI findings in a child after cardiac catheterisation. (a) Colour Doppler sonography shows a typical AV fistula connecting the left common femoral vein (VF) and artery (AF). Colour Doppler is inverted so that the venous jet is coded blue. (b) Pulsed Doppler investigation of the sample volume placed in the femoral artery distal from the shunt reveals the typical diastolic steal phenomenon with diastolic negative flow velocities
Compartment Syndrome
Because the fascia layers of the limbs define the compartments which have very low elasticity, a small amount of volume increase in the compartments, due to bleeding, swelling of the muscles or inflammation, can cause the local tissue pressure to rise greatly resulting in an impaired arterial perfusion.
Compartment syndromes in the paediatric age group can occur after fractures of the extremities, ischaemic reperfusion following injury, haemorrhage, vascular puncture, intravenous drug injection, casts, prolonged limb compression, crush injuries and burns, and due to a local inflammation, all compartment syndromes lead finally to an impaired arterial perfusion of the involved region.
If the diastolic flow velocity in the feeding artery and/or the local arteries becomes negative, this indicates that the tissue pressure has risen above the diastolic blood pressure.
Figure 14.10 shows an example in a 12-year-old by suffering from necrotising fasciitis due to Panton-Valentine leukocidin-positive Staphylococcus aureus.
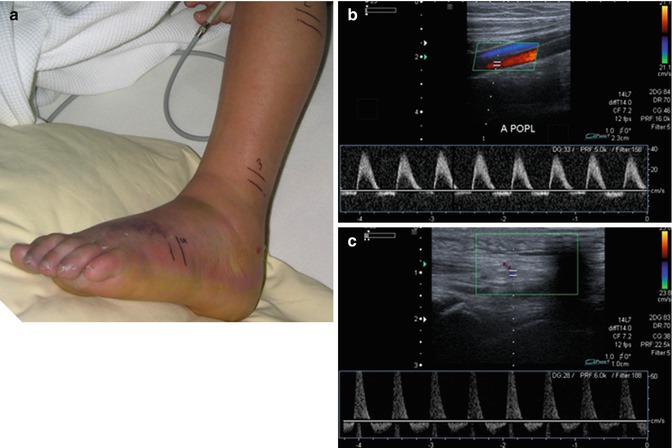
Fig. 14.10
Clinical and duplex sonographic findings in a 12-year-old boy suffering from necrotising fasciitis of the left forefoot. (a) The clinical investigation demonstrates an extremity which is swollen and red and shows a beginning necrosis of the skin. (b) Duplex investigation of the left popliteal artery (left picture) and (c) of an artery of the forefoot (right picture) reveals a pathologic flow profile with holodiastolic negative flow velocities indicating a tissue pressure above the diastolic blood pressure
In any case of compartment syndrome with negative arterial blood flow, surgical intervention should be done without delay.
14.2.3 Vascular Malformations and Haemangiomas
The most frequent paediatric soft tissue tumours are vascular malformations and haemangiomas.
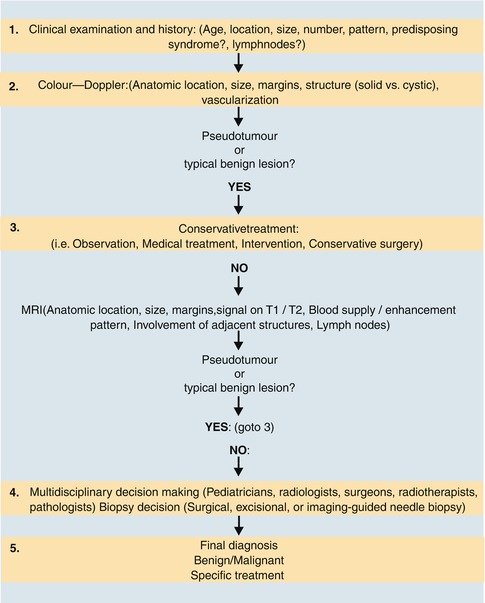
Figure 14.11 demonstrates schematically a straightforward clinical and sonographic approach to paediatric soft tissue tumours guided by the results of duplex sonography as the first, and in most cases, unique imaging modality for these lesions.
14.2.3.1 Vascular Malformations
Congenital vascular malformations (CVM) are made of dysplastic vessels with no cellular proliferation. Low-flow malformations (LFM) consist predominantly of venous and/or lymphatic vessels; in high-flow lesions, the arterial vessels dominate. In other words, a CVM occurs if the embryologic development stops at an early stage, whereas a vascular tumour (like paediatric haemangioma) occurs if vessels show a pathologic growth (Lee et al. 2007; Puig et al. 2005; Angiero et al. 2009).
During its development, the vascular system undergoes differentiation through different stages. Stage 1 is the undifferentiated stage, with only a capillary network being present. Stage 2 is the retiform stage, when plexiform structures have developed. Stage 3 (at the third week of gestation), the mature stage, leads to the development of large channels and finally of the normal arteries and veins.
The exact morphology of the CVM depends on the embryologic stage at which the arrest occurs (see Fig. 14.12).
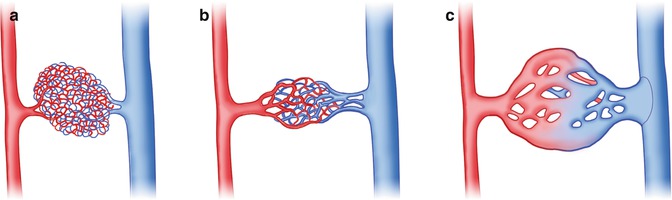
Fig. 14.12
(a) Capillary malformation (development arrest at stage 1), (b) microfistulous arteriovenous (AV) malformation (development arrest at stage 2) and (c) macrofistulous arteriovenous malformation (development arrest at stage 3). (Drawing by Blankvisual, Thun, Switzerland)
A correct terminology is necessary for differentiating vascular malformations from tumours such as paediatric haemangiomas which have a potential for further growth.
The most accepted classification scheme for CVM is the Hamburg classification given in Table 14.1.
Table 14.1
Hamburg classification of congenital vascular malformations (CVMs)
A. Types |
Predominantly arterial defects (in general high flow velocities in Doppler sonography) |
Predominantly venous defects (low flow velocities in Doppler sonography) |
Predominantly arteriovenous (AV) shunting defects |
Predominantly lymphatic defects (e.g. lymphangioma) |
Combined vascular defects |
B. Embryologic subtypesa |
Extratruncular forms |
Infiltrating, diffuse |
Limited, localised |
Truncular forms |
Aplasia, hypoplasia or obstruction (e.g. venous valve aplasia) |
Hyperplasia
Related posts:Stay updated, free articles. Join our Telegram channel
Full access? Get Clinical Tree
 Get Clinical Tree app for offline access

|