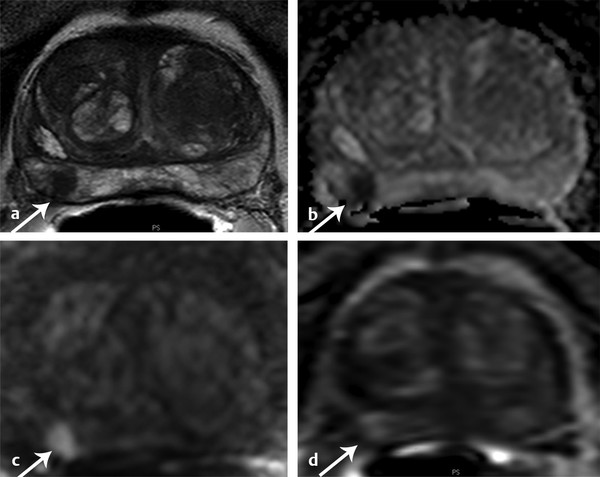
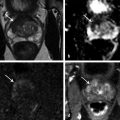
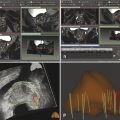
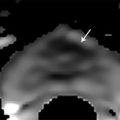
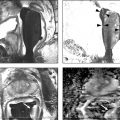
What is Dynamic Contrast-Enhanced MRI? Angiogenesis is a key step for cancer growth and is characterized by blood vessel proliferation that is induced in response to high needs for oxygen and nutrients. The pattern of vessels in tumor angiogenesis does not follow the classic arteriole–capillary–venule hierarchy. Instead, the vessels are more disorganized, anarchic, permeable, and tortuous than the normal vasculature. 1 DCE-MRI noninvasively evaluates this neoangiogenic process. DCE-MRI consists of T1-weighted (T1W) fast gradient-echo images of the prostate before, during, and after intravenous injection of a low molecular weight gadolinium chelate. During DCE-MRI, the prostate is scanned using serial volumetric acquisitions obtained in continual fashion. Much variability exists among centers in terms of numerous aspects of DCE-MRI acquisition, including both the temporal resolution and total acquisition duration. Variability in the temporal resolution relates to the inherent trade-off in MRI between temporal resolution and spatial resolution. While a temporal resolution of ≤ 15 seconds is advised by PI-RADS v2, many centers prefer to use a more rapid temporal resolution of under 7 seconds. Although not widely used in clinical practice, even faster temporal resolutions of approximately 3 seconds have been successfully implemented as well. In addition, in the past, extended acquisitions for 5 minutes or longer were common. 2, 3 However, given the diminished role of characterizing extended contrast kinetics in PI-RADS v2 (as described in more detail below), PI-RADS v2 now supports a more abbreviated DCE-MRI acquisition, advising a minimum of duration of only 2 minutes. 4 While maintaining high temporal resolution, the spatial resolution of DCE-MRI should also be adjusted to prevent volume averaging and to enable optimum depiction of suspicious lesions. Novel acquisition schemes, for instance combining DCE-MRI with radial acquisition, compressed sensing, and advanced parallel imaging reconstruction methods, may be able to further optimize the combination of both high spatial resolution and high temporal resolution in the future. 5 While acquisition of DCE-MRI can vary depending on the MRI scanner and coil elements available, the PI-RADS v2 document summarizes the acceptable ranges for technical specifications ( ▶ Table 5.1). DCE-MRI sequence parameters 2D or 3D T1W gradient-echo images (3D preferred) TR/TE < 100 ms/< 5 ms Slice thickness 3 mm, no gaps Field of view Entire prostate gland & seminal vesicles In plane dimension ≤ 2mm x ≤ 2 mm Temporal resolution ≤ 10 s (< 7 s preferred) Total observation time ≥ 2 min Contrast dose 0.1 mmol/kg standard GBCA or equivalent high relaxivity GBCA Contrast injection rate 2–3 cm3/s with continuous image acquisition Abbreviations: DCE-MRI, dynamic contrast-enhanced MRI; 2D, two-dimensional; 3D, three-dimensional; GBCA, gadolinium- based contrast agents; T1W, T1-weighted; TR, relaxation time; TE, echo time. Source: Adapted from American College of Radiology (ACR) Prostate Imaging–Reporting and Data System (PI-RADS), version 2, 2015. Available at www.acr.org. DCE-MRI can be evaluated qualitatively, quantitatively, or semiquantitatively. The qualitative approach is the most commonly used method for interpretation of DCE-MRI. Qualitatively, tumors exhibit early enhancement of the contrast media relative to the surrounding prostate parenchyma due to the leakiness of tumor vessels. 3 Qualitative analysis involves scrolling through the serial dynamic time points in order to visually assess for a region of earlier contrast enhancement within lesions. This can be accomplished using a regular Picture Archiving and Communication System (PACS) workstation with a trackwheel mouse without additional software. The qualitative approach is the simplest method and is recommended by PI-RADS v2 guidelines, which summarizes such a qualitative evaluation in the form of a binary assessment (“negative” or “positive”) ( ▶ Table 5.2). Negative enhancement refers to the absence of early enhancement as well as to diffuse enhancement that does not correspond to a focal finding identified on T2W-MRI and/or DW-MRI. DCE-MRI is also considered negative when there is focal enhancement in a lesion predicted to represent a benign prostatic hyperplasia nodule based on its characteristic T2W-MRI features (for instance, a well-circumscribed nodule located in the transition zone). Positive enhancement refers to enhancement that is “focal, and earlier than or contemporaneous with enhancement of adjacent normal prostatic tissues, and that corresponds to a suspicious finding on T2W-MRI and/or DW-MRI.” Thus, in qualitative analysis, DCE-MRI is considered positive if there is focal early enhancement in a lesion corresponding to an abnormality identified on T2W-MRI or DW-MRI. 6 When performing qualitative visual assessment of DCE-MRI, generation of subtracted postcontrast images can be useful to increase conspicuity of enhancing foci, as well as to eliminate increased signal in areas of postbiopsy hemorrhage that is encountered on the baseline T1WI. DCE-MRI score Criteria Positive (must meet all 3 criteria) Focal Enhances earlier than or simultaneously with enhancement of adjacent normal tissue Corresponds to suspicious finding on T2WI and/or DWI Negative (if any criterion holds true) No early enhancement or Diffuse enhancement, not corresponding to a focal finding on T2WI and /or DWI or Focal enhancement corresponding to a lesion demonstrating features of BPH on T2WI Abbreviations: BPH, benign prostatic hyperplasia; DWI, diffusion-weighted imaging; DCE-MRI, dynamic contrast-enhanced MRI; T2WI, T2-weighted imaging. Source: Adapted from American College of Radiology (ACR) Prostate Imaging–Reporting and Data Systems (PI-RADS), version 2, 2015. Available at www.acr.org. Semiquantitative analysis entails analyzing the enhancement kinetics within a given region of interest in the prostate, considering both the washin and washout of the enhancement curve. Semiquantitative assessment may be performed in two different fashions. One approach is to use software to generate time–signal-intensity curves depicting the contrast kinetics within a suspicious region identified either on the source images or on other sequences. Most commonly, such curves are evaluated using a schema based on three curve types. In this schema, type 1 refers to persistently increasing enhancement, which is typically observed in benign prostate tissue; type 2 refers to an initial rapid rise followed by a plateau of enhancement, which is observed in either tumors or benign inflammatory processes; and type 3 refers to a rapid rise and subsequent decline (washout) in enhancement, representing the curve type that is the most suspicious for prostate cancer. Alternatively a voxel-by-voxel parametric map may be constructed from the dynamic image sets in which the voxel values characterize various aspects of the kinetic curve such as the slope of the washin, the slope of the washout, the time to peak, or the peak enhancement. The map is typically displayed in a colorized fashion superimposed on the T1- or T2-weighted images and is then evaluated visually for an area of abnormal color, indicating an abnormality of the given semiquantitative perfusion metric. Although semiquantitative methods are also relatively straightforward provided that appropriate software is available, challenges exist in their application. Most notably, all three kinetic patterns (curve types 1, 2, and 3) can be present in either benign or malignant prostate lesions given the increased vascularity of benign processes such as benign prostate hyperplasia (BPH) nodules and inflammation. Hansford et al evaluated the diagnostic performance and interobserver agreement of curve type analysis in 120 patients among 3 readers. While similar receiver operating characteristic curves were reported for all readers, mean area under the curves (AUCs) were poor (0.58 ± 0.04 [standard deviation] to 0.63 ± 0.04). Observer agreement in differentiating type 3 curves from either type 1 or type 2 curves was substantial (0.66 < k < 0.79), and better in PCa than in healthy tissue. However, the interreader agreement for differentiating type 1 from type 2 curves was only moderate to substantial (0.49 < k < 0.78). Based on the findings, the authors concluded that this semiquantitative approach provided an overall poor performance for differentiating prostate cancer from benign tissue. 7 While the semiquantitative approach was endorsed in PI-RADS v1, concerns regarding its greater complexity compared with a visual qualitative method (including the need for dedicated software) yet questionable reproducibility and accuracy, have hampered its widespread clinical use, and the method was removed from PI-RADS v2. Quantitative analysis is the most sophisticated DCE-MRI evaluation. This approach entails calculating a set of kinetic parameters by fitting the enhancement curve to one of a number of pharmacokinetic models, most commonly the Tofts model. Parameters derived from the Toft’s model include Ktrans (transendothelial transport of contrast medium from the vascular compartment to the tumor interstitium), kep (reverse transport parameter of contrast medium back to the vascular space), Vp (plasma volume fraction compared to whole tissue volume), and Ve (extravascular, extracellular volume fraction of the tumor), which collectively are intended to characterize tumor and tissue permeability properties. 8 These parameters are typically computed on a voxel-by-voxel basis and displayed as a parametric map overlaid on an anatomical image set, as is also possible using the semiquantitative approach. Ktrans and kep tend to be higher in cancer foci compared to normal tissue. Nonetheless, as in the semiquantitative approach, these parameters are nonspecific and may also be abnormal in benign processes such as BPH nodules and inflammation. 9 Furthermore, software required for a quantitative approach is less widely available in clinical practice, and the implementation of this method is more technically demanding, for instance requiring measurement of an arterial input function in order to improve the precision of Ktrans estimates. Variability in DCE-MRI acquisition parameters, as well as in the algorithms used by software packages for performing the Tofts model, lead to inter- and intrapatient variation in the computed perfusion metrics. This method did not appear in either PI-RADS v1 or v2 given insufficient peer-reviewed published data or expert consensus to support routine adoption of quantitative analysis for clinical use (PI-RADS v2 document). For more than a decade, DCE-MRI has been considered an important component of multiparametric MRI protocols for detecting prostate cancer ( ▶ Fig. 5.1; ▶ Fig. 5.2; ▶ Fig. 5.3; ▶ Fig. 5.4). Indeed, early studies of this technique showed an incremental benefit compared with T2W-MRI alone. For instance, in a cohort of 70 patients who underwent radical prostatectomy, combined use of DCE-MRI with T2W-MRI was found to have a probability of tumor detection of 0.58 compared to use of T2W-MRI alone, which was approximately 0.43. However, its role has more recently been questioned given a view by some experts that findings from DCE-MRI may enhance tumor detection compared with findings from the combination of T2W-MRI and DW-MRI alone, but in less than 20% of cases. The exact additive role of DCE-MRI relative to T2W- and DW-MRI has not been extensively investigated. Nonetheless, one meta-analysis aimed to systematically review DCE-MRI for the detection of prostate cancer in comparison with T2W- and DW-MRI. This meta-analysis included 22 high-quality studies. Both DCE-MRI (0.82–0.86) and DW-MRI (0.84–0.88) yielded significantly better AUC than T2W-MRI alone (0.68–0.77). 10 While DCE-MRI improved tumor detection in comparison with T2W-MRI alone, DCE-MRI did not clearly raise performance compared with the combination of T2WI and DWI. 10 Thus, a simpler MRI protocol including only T2W-MRI and DW-MRI without DCE-MRI may be sufficient for tumor detection. 10 Another meta-analysis compared the diagnostic performance of DW-MRI and DCE-MRI for prostate cancer detection within the same patient populations. This analysis included only 5 eligible studies (265 patients). The pooled sensitivity was 58.4% (95% confidence interval [CI], 53.5–63.1%) for DW-MRI and 55.3% (95% CI, 50.4–60.1%) for DCE-MRI, whereas pooled specificity was 89.0% (95% CI, 87.2–0.7%) for DW-MRI and 87.9% (95% CI, 86.0–89.6%) for DCE-MRI. At the summary receiver-operating-characteristic curve analysis, AUC was 0.810 (p = 0.059) for DW-MRI and 0.786 (p = 0.079) for DCE-MRI. The performance of DW-MRI and DCE-MRI was thus very similar, with both sequences offering greater specificity than sensitivity. 11 The findings suggest that DCE-MRI may not offer an advantage over DW-MRI. Fig. 5.1 A 55-year-old patient with prostate-specific antigen = 8.98ng/mL. Axial T2-weighted MRI shows a hypointense lesion in the right mid–peripheral zone (arrow) (a). Apparent diffusion coefficient (ADC) map of from diffusion-weighted MRI (DW-MRI) identify a hypointense lesion in the same location (b), which is further confirmed by a hyperintense signal pattern on the high b-value DW-MRI (c). The lesion shows focal hyperenhancement on dynamic contrast-enhanced MRI (d). The patient underwent MRI–transrectal ultrasound fusion–targeted biopsy which resulted in a Gleason score 4+4 prostate cancer diagnosis. The patient then underwent a robot-assisted radical prostatectomy, for which histopathology revealed Gleason score 3+4 prostate cancer within the lesion.
5.3 How to Evaluate and Interpret Dynamic Contrast-Enhanced MRI?
5.4 Dynamic contrast-enhanced MRI in the Detection of Localized Prostate Cancer
Related posts:
 Introduction to Prostate Cancer: Clinical Considerations
 PET/CT and PET/MR Imaging Evaluation of Prostate Cancer
 Prostate Cancer Pathology
 Prebiopsy MRI and MRI-Targeted Biopsy
 Diffusion-Weighted Imaging of the Prostate
 Introduction to Prostate MRI Protocols: Hardware, T2-Weighted Imaging and MR Spectroscopy
Stay updated, free articles. Join our Telegram channel

Full access? Get Clinical Tree


