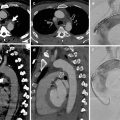
Fig. 1
CT venography scans show the presence of intraluminal filling defects in the inferior vena cava (circle in a), the left common iliac vein (circle in b) and the left femoral vein (circle in c)
Clearly, compression ultrasound (CUS) is well accepted, has low cost and does not expose the patient to radiation. Numerous comparative studies have shown that there is approximately 97 % agreement between CT venography and CUS (Cham et al. 2005; Katz et al. 2002). CT venography and CUS have also been shown to be equivalent in patients in the intensive care unit (Taffoni et al. 2005). The PIOPED II study of 711 CT venograms showed 95 % concordance between CUS and helical CT venography (Stein et al. 2006).
In general, Fleischner Society (Remy-Jardin et al. 2007) recommend the use of CT venography when emphasis must be placed on a complete vascular examination that can be accomplished expeditiously; when there are concerns about radiation exposure, they recommend substituting lower extremity US. When evaluation of the lower extremity veins is not clinically important, CT venography can be omitted (Remy-Jardin et al. 2007; Pena and Dennie 2012).
2.2 CT Findings of Acute Pulmonary Embolism
CT angiography allows the direct visualization of emboli as arterial filling defect that partially or totally occludes the enhanced artery (Ghaye et al. 2002). A partial arterial defect surrounded by contrast material produces the so-called “polo mint” sign on images acquired perpendicular to the long axis of the vessel (Fig. 2) and the “railway track” images sign on longitudinal images of the vessel (Fig. 3). A partial filling defect can place peripherally forming acute angles with the arterial wall (Fig. 4). When the embolus totally occludes the artery, the involved vessel may be enlarged (Fig. 5) compared with the corresponding patent vessel of the opposite site (Han et al. 2003). A vessel “cut-off” sign is seen when the distal artery is not opacified owing to the presence of occlusive disease. Central filling defects can sometimes already be highlighted on CT scans without contrast medium as hyperdense images at the level of the main pulmonary arteries (Fig. 6a, b). The visualization of the thrombus on chest CT without contrast medium is related to the “age” of the clot and the haematocrit of the patient at the time of the survey. The gradual retraction of the thrombus is associated to the reduction of its water content resulting in an increase of density values up to 50–80 UH (Kanne et al. 2003).
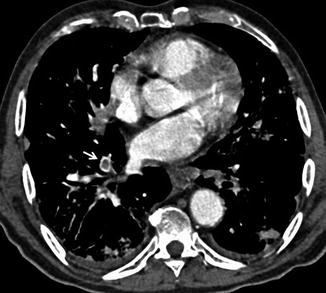
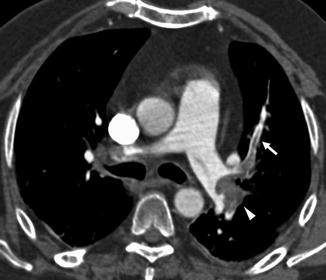
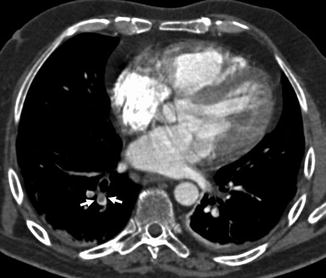
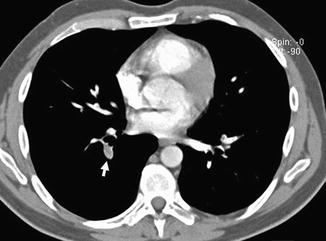
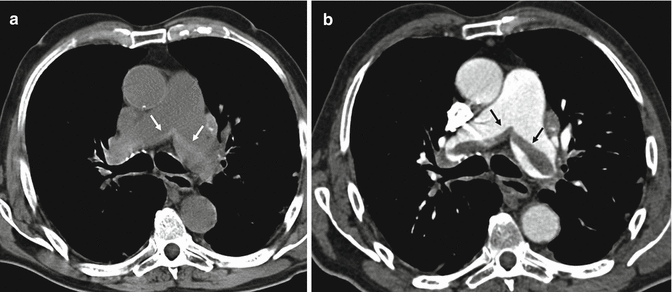
Fig. 2
CT scan demonstrates a pulmonary embolus that affects the segmental artery of the anterior basal segment of the right lower lobe; the embolus (arrow) is surrounded by contrast material reproducing the so-called “polo mint” sign
Fig. 3
Enhanced CT scan shows an acute pulmonary embolus that causes a partial filling defect surrounded by contrast material “railway track” sign (arrow). One more acute pulmonary embolus affects the left main pulmonary artery (arrowhead)
Fig. 4
CT angiography shows a pulmonary embolus that affects the segmental artery of the posterior basal segment of the right lower lobe; the embolus is peripherally located forming acute angle with the vessel wall (arrows)
Fig. 5
CT scan shows a complete occlusion of a segmental artery of the right lower lobe with a prominent enlargement of the vessel (arrow)
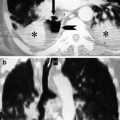
Fig. 6
CT scans at the level of the pulmonary trunk. Unenhanced multidetector CT scan (a) shows bilateral central high-attenuation emboli (arrows); enhanced CT scan (b) confirms the presence of the central emboli (black arrows)
In the presence of PE, parenchymal CT findings can be seen as areas of ground glass opacity or consolidation representing pulmonary haemorrhage that usually resolve within a week. Pulmonary infarction is more frequently seen in lower lobes as a wedge-shaped area of consolidation with the apex towards the hilum and with central hypodense areas representing secondary pulmonary lobules spared from the disease process (Fig. 7a). It is often possible to highlight the presence of an intraluminal filling defect in the arterial branching afferent to the pulmonary infarction (Fig. 7b).
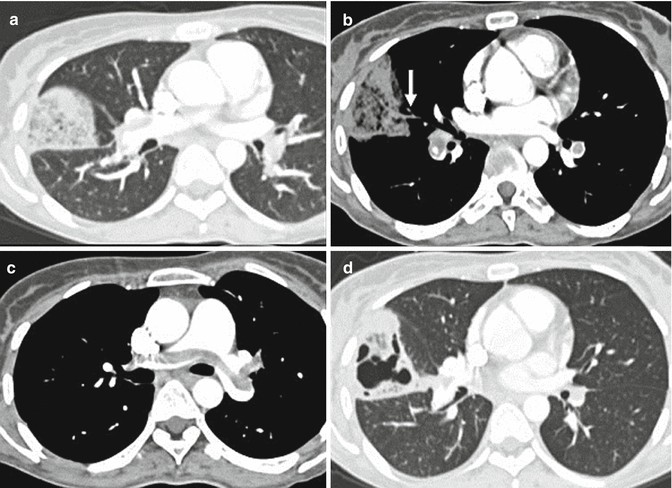
Fig. 7
Chest CT scan (a) shows a wedge-shaped, subpleural consolidation in the middle lobe with central hypodense areas due to lung infarction; there is a vessel totally occluded (arrow in b) and coursed towards the apex of the consolidation. A central bilateral emboli are also demonstrated (c). One-month chest CT follow-up showing excavation of the lung infarction (d)
Pulmonary infarction is seen in about 10 % of patient with PE, and it gradually reduces in size in 3–5 weeks retaining its triangular morphology. The excavation of pulmonary infarction is rare; it can also be found in the absence of infectious processes especially if the pulmonary infarction has a transverse diameter >4 cm and generally occurs after 2 weeks of onset of the infarct (Fig. 7d). Linear parenchymal bands, atelectasis, focal oligaemia and small pleural effusion are less frequent features.
CT can also highlight findings suggestive of right ventricular failure as dilation of the right ventricle, with right ventricular cavity transverse diameter greater than the left, with or without the presence of reflux of contrast medium in the hepatic veins and deviation of the interventricular septum towards the left ventricle (Fig. 8).
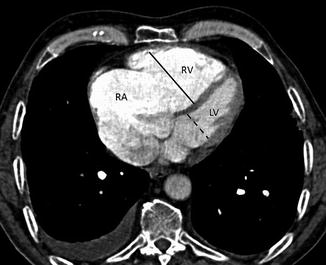
Fig. 8
Right ventricular strain: CT scans show dilation of the right atrium (RA) and the right ventricle (RV). The short-axis diameter of the RV (continuous line) is greater than that of the left ventricle (LV, dotted line). The interventricular septum is bowed towards the LV
2.3 Acute Pulmonary Embolism Misdiagnosis
Several conditions can be responsible of acute PE misdiagnosis (Wittram et al. 2004). Respiratory motion artefacts are the most common cause of indeterminate CT pulmonary angiography. These artefacts are best seen with lung window settings and can create the “seagull” sign. Images obtained in large patients have more quantum noise making the evaluation of segmental and subsegmental vessel very difficult. A soft tissue reconstruction algorithm should be used to avoid high attenuation around vessels. We recommend using pulmonary embolism-specific settings with a window width and level of 800 and 100 HU, respectively. Streak artefacts from dense contrast material within the superior vena cava or from a central venous catheter can obscure emboli or can mimic PE. These artefacts can be distinguished from pulmonary emboli for their radiating nature and the nonanatomic morphology (Pena and Dennie 2012). These artefacts can be reduced by flushing the superior vena cava with saline solution using dual chamber injectors. A poor contrast opacification of pulmonary arteries can be also a cause of misdiagnosis of PE. Hilar lymph nodes can be confused with emboli even if, nowadays, thanks to the use of thinner collimations, lymph nodes are easily differentiated from emboli (Fig. 9a, b). Low-density mucus-filled bronchi and pulmonary veins can also mimic pulmonary filling defect. The review of sagittal and coronal reformatted images can be helpful in difficult cases.
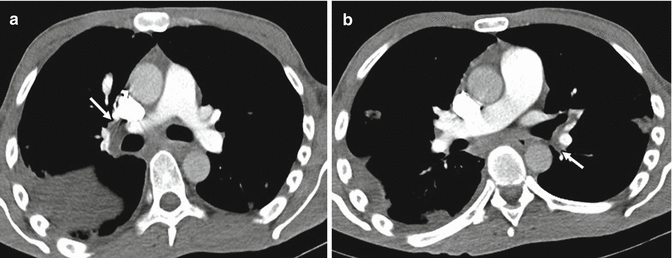
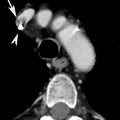
Fig. 9
(a, b) Chest CT scans show hilar and bronchial lymph nodes (arrows) that can mimic pulmonary emboli
3 Chronic Pulmonary Embolism
Most cases of pulmonary emboli resolve without sequelae. In a small percentage of patients with PE, especially when large emboli are present, these can undergo organization, retraction and recanalization, with the possibility of determining frameworks of pulmonary hypertension and cor pulmonale (Hoeper et al. 2006). The most frequent CT findings are complete occlusion of a vessel that is smaller than adjacent patent vessel, a peripheral filling defect with obtuse angles with the vessel wall (Fig. 10), web or flap within a contrast material-filled artery, presence of calcifications in the context of the parietal thrombus or calcification of the pulmonary arteries (Fig. 11a, b) and contrast material flowing through thickened often smaller arteries due to recanalization (Fig. 12b). The main pulmonary artery is typically enlarged (diameter, >29 mm) for the onset of pulmonary arterial hypertension, and bronchial artery dilation is also present (Fig. 12a). Pulmonary parenchymal CT findings in chronic PE consist of “mosaic pattern”: lung areas with a different density in a patchy distribution resulting from irregular perfusion of lung parenchyma (Fig. 13) (Pena and Dennie 2012).
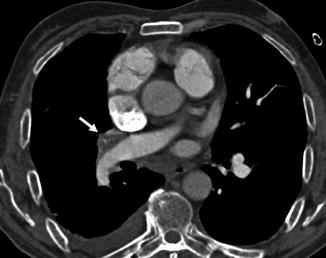
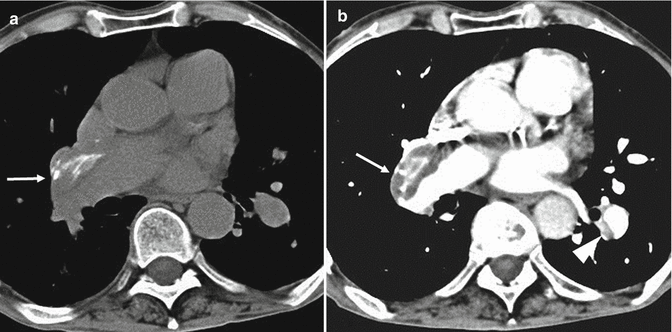
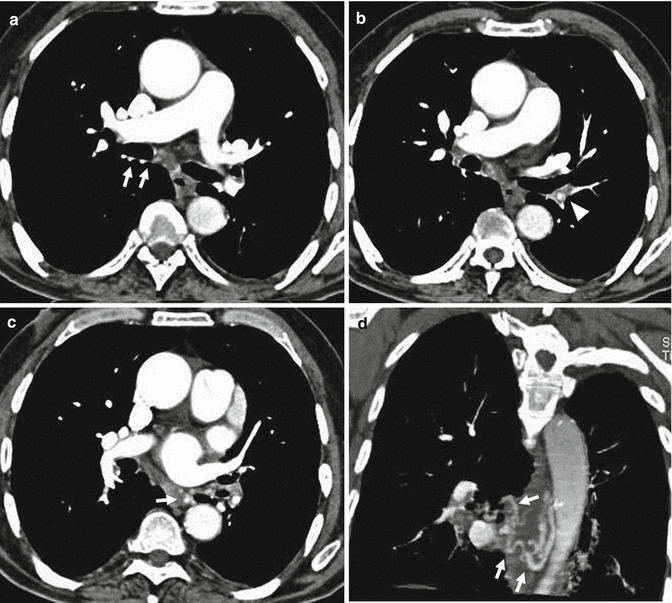
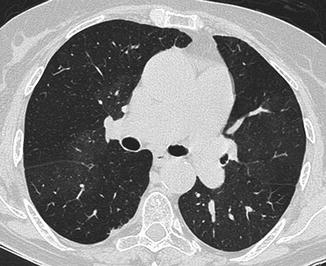
Fig. 10
Chest scan demonstrates a peripheral filling defect in the interlobar artery (arrow) with obtuse angle with vessel wall
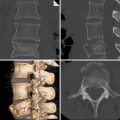
Fig. 11
CT scans at the level of the right pulmonary artery in a patient with chronic pulmonary embolism show a peripherally located thrombus in the right pulmonary artery (arrows in a and b) with calcification within (a, b). There is also a peripheral thrombus in the left lower lobe artery (arrowhead in b)
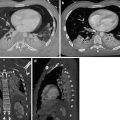
Fig. 12
CT scans in patient with chronic pulmonary embolism showing a small recanalized left pulmonary artery with contrast material in the central lumen (arrowhead in b). Dilated bronchial and collateral vessels are also evident (arrows in a, c, d)
Fig. 13
CT scan at the level of the pulmonary trunk in a patient with chronic pulmonary embolism showing a mosaic perfusion pattern. The dark regions are underperfused, and vessels are smaller than the adjacent patent vessel in the normally perfused lung
Chronic pulmonary embolism in the appropriate clinical setting should be differentiated from pulmonary artery sarcoma (PAS). It is a rare tumour with poor prognosis, and it should be considered as a possible diagnosis in the absence of thromboembolic risk factors and when there is no evidence of cancer elsewhere. Patients are generally in their 50s and do not show any response to anticoagulation.
Pulmonary artery sarcoma is an uncommon cause of intraluminal filling defect causing often a unilateral hilar enlargement (Cox et al. 1997; Hu et al. 2009). CT angiography of the chest shows tissue which tends to occupy the full diameter of the vessel with vascular involvement of the common trunk (85 % of cases) and the main branches (left pulmonary artery, 65 %; right pulmonary artery, 71 %); inhomogeneous enhancement of the intraluminal pulmonary tissue due to haemorrhage, necrosis and calcification (Fig. 14); increase in vessel calibre; and extra-luminal extension of the tissue. Pulmonary nodules can also be an expression of metastases (Long et al. 2010).
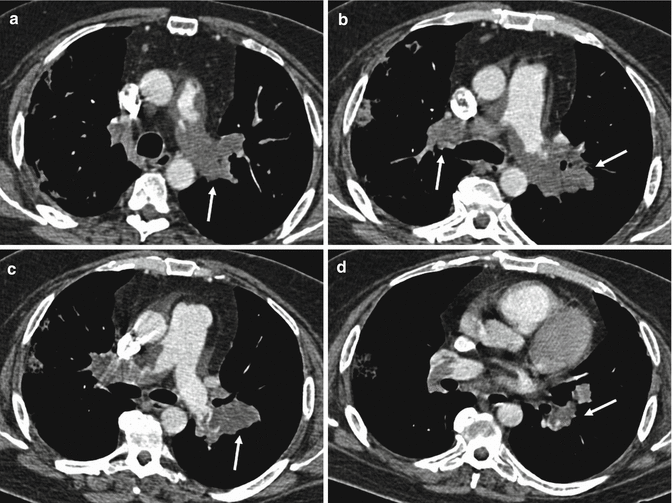
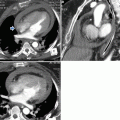
Fig. 14
Contrast-enhanced CT scans show a heterogeneous enhancing lobulated tissue (arrows) in the main pulmonary artery and in the left and right branches with involvement of lobar and segmental arteries bilaterally. The enlargement of the involved vessels is also evident
4 Ventilation-Perfusion Scintigraphy Versus Computed Tomography
Over the last decade, different imaging modalities have been established as useful tools in the diagnosis of PE, with various ranges of diagnostic performance being reported. Choice of the imaging modality varies by site, with usage of a particular modality influenced by a combination of site history, availability of equipment, physician personal preference and patient suitability (Phillips et al. 2015).
For 30 years ventilation/perfusion (V/Q) lung scanning has been the preferred non-invasive imaging procedure in patients with suspected PE. However, a complex probability scoring system and a relative high number of non-diagnostic scans have dampened enthusiasm about this procedure.
In the past decade, CTPA has proven to be a more accurate test with relatively few inadequate studies and has been welcomed by clinicians (Stein et al. 2006). Nevertheless, concerns about radiation exposure and side effects of contrast medium administration with CTPA indicate that a role for V/Q scintigraphy in the evaluation of patients with suspected PE is still to consider (Freeman 2008).
4.1 Scintigraphy: Technical Considerations, Diagnostic Accuracy and Novel Imaging
Diagnostic ventilation/perfusion (V/Q) scintigraphy involves simultaneous imaging of the distribution of pulmonary blood flow and alveolar ventilation.
The main clinical indication for this technique is the evaluation of PE. The principle underlying the “scintigraphic diagnosis” of PE is that, whereas pulmonary perfusion is abnormal, the pulmonary parenchyma usually remains intact and ventilation remains normal. This gives rise to the so-called mismatched perfusion defect, the hallmark of pulmonary embolic disease.
As regards technical aspects, perfusion and ventilation scanning are two different processes of the same resulting examination.
Perfusion scanning (Q) is performed by the intravenous injection of a radiotracer, which is trapped in the lung on first pass. The tracer used in the clinical practice, nowadays, is macroaggregated human serum albumin (MAA) labelled with technetium-99m (Tc-99m). These particles have a size range of 10–100 μm and cause microembolization of pulmonary capillaries and precapillary arterioles, reflecting regional perfusion. Routinely, about 400,000 particles are injected. As there are over 280 billion pulmonary capillaries and 300 million precapillary arterioles, only a small fraction of the pulmonary bed will be obstructed; thus, even in patients with pulmonary vascular disease (pulmonary hypertension), it can be used safely. Provided the particles mix completely in the blood prior to microembolization, the distribution of radioactivity is proportional to the distribution of pulmonary blood flow (Heck and Duley 1974). A Tc-99m lung perfusion scan provides an effective radiation dose equivalent of 1 mSv/100 MBq.
Ventilation scanning (V) is currently performed using radiolabelled aerosols, unlike in the past when radioactive inert gases were the most widely used agents for ventilation imaging. Aerosol ventilation imaging has become popular largely because of technical improvements in the delivery systems and the small size of particles. Aerosols are generally made of Tc-99m diethylenetriaminepentaacetic acid (DTPA). The aerosol administration requires cooperation of the patient, who is asked to breathe through a mouthpiece, with a nose clip in place, for several minutes. Tc-99m DTPA diffuses through the alveolo-capillary membrane to the blood (Mason et al. 2001). Another type of aerosol available is “Technegas”, made of extremely small carbon particles (0.005–0.2 μm), generated in a high-temperature furnace (Senden et al. 1997). The small particle size implies that they are distributed in the lungs almost like a gas and are deposited in alveoli by diffusion.
V/Q lung scanning in the presence of PE has the typical diagnostic feature of a perfusion defect in a region of normally ventilated lung, the mismatched perfusion defect. The size of defect may range from appreciably smaller than a segment (subsegmental) to about the size of a segment (segmental) or, very rarely, of a lobe or whole lung. A non-segmental defect is one that does not correspond to segmental anatomy. A minimum of four views (anterior, posterior and both posterior obliques) is recommended for the accurate evaluation of V/Q lung scanning, and occasionally, lateral and anterior obliques may be useful.
The pathologic basis of the mismatched perfusion defect is that in an uncomplicated pulmonary embolism, in otherwise healthy individuals, the pulmonary architecture remains intact, and ventilation is therefore normal. However, when embolism is followed by lung infarction, a ventilation defect appears, although it is usually smaller than the perfusion defect because the lung around the periphery of the perfusion defect continues to ventilate. The diagnostic feature of a pulmonary infarct, therefore, is an incompletely matched perfusion defect. In many patients, however, V/Q scan is non-diagnostic, and further investigation is required (Macdonald et al. 2005). V/Q scan provides a higher effective radiation dose with respect to the Q scan alone. Phillips JJ et al. in a recent review of medical literature reported that the effective dose for correct diagnosis with V/Q scan was 3.46 mSv (Phillips et al. 2015).
The V/Q scan has been widely used as the first-line radiologic examination in the diagnosis of suspected PE. In the mid-1980s, the multicentre Prospective Investigation of Pulmonary Embolism Diagnosis (PIOPED) study evaluated the diagnostic utility of the V/Q scan for 731 patients with conclusive pulmonary angiogram results for PE (PIOPED Investigators 1990). The study demonstrated that all patients with pulmonary embolism had abnormal V/Q scans of high, intermediate or low probability, but so did most without pulmonary embolism (sensitivity, 98 %; specificity, 10 %) and indicated the diagnostic utility of the V/Q scan to be limited to the small proportion of patients with high-probability results or to those with normal/near-normal or low-probability scans in conjunction with low clinical likelihood of the disease. The PIOPED study showed that the combination of pretest clinical assessment and V/Q scintigraphy could diagnose or exclude PE accurately, but such readings were possible in only 28 % of patients. Unfortunately, this leaves a large group of patients with non-diagnostic results that were insufficiently conclusive to guide definitive clinical management.
The risk of missed PE may result in death. Alternatively, treating patients unnecessarily for PE exposes them to the risk of life-threatening complications from anticoagulation, which has been reported being of 5 % at 1 year (Petty et al. 1988).
For all these reasons, the PIOPED criteria were reviewed in order to increase accuracy of V/Q scan (Sostman et al. 1994). More recently, in the retrospective analysis of the PIOPED II trial data retrieved from patients who had undergone both V/Q scintigraphy and CTPA, the V/Q scan diagnostic criteria for PE have been recategorized into “PE present”, “PE absent” and “non-diagnostic test”. Results showed a definitive V/Q scan reading in 73.5 % of patients and a non-diagnostic scan rate reduced to 26.5 %, with a sensitivity and specificity of 77 % and 98 %, respectively (Sostman et al. 2008a). Authors concluded that V/Q scan scintigraphy can be considered an appropriate imaging procedure in patients with suspected PE for whom CTPA may be disadvantageous, as in those with iodinated contrast medium allergy or impaired renal function, particularly if outpatients.
The investigators of Prospective Investigative Study of Acute Pulmonary Embolism Diagnosis (PISAPED) suggested a new set of diagnostic criteria, intended to diagnose or exclude PE using incorporation of clinical prediction rules, the Q scan alone and chest radiograph. They used the archived PIOPED II data and images to test their hypothesis and found a sensitivity of 80 %, a specificity of 97 %, with 0 % of non-diagnostic results (Sostman et al. 2008b). These results indicate that Q scintigraphy combined with chest radiography can provide diagnostic accuracy similar to that of V/Q with the additional benefits of lower cost and lower radiation dose.
Single-photon emission computed tomography (SPECT) is a technique that provides three-dimensional volumetric images and has the potential to improve the diagnostic accuracy of the nuclear medicine imaging for PE. SPECT improves the performance of V/Q imaging thanks to better spatial resolution, in particular regarding detection of peripherally located perfusion defects, and limited overlapping of the perfusion defects by other structures.
Recent V/Q SPECT studies conducted in over 3000 cases showed a sensitivity of 96–99 % and a specificity of 91–98 % for PE (Bajc et al. 2009a). The rate of non-diagnostic findings has been reported between 1 and 3 %.
V/Q SPECT is non-invasive, is well-tolerated and can be performed in all patients. With efficient technique and effective organization, V/Q SPECT takes only 20 min of acquisition time, and the radiation exposure is low (effective dose of 2.12 mSv) with respect to the planar V/Q scan (Phillips et al. 2015). Furthermore, it allows quantification of PE, and that option has a relevant impact on choice of treatment in some centres and frequently provides alternative diagnosis of comorbid conditions as COPD, left heart failure and pneumonia (Bajc and Jonson 2011).
However, V/Q SPECT is uniquely useful for follow-up and research and not employed in the emergency setting, where CTPA is the host, even if, according to some authors (Bajc and Jonson 2011), its outstanding qualities merit consideration of its use as the primary diagnostic method for PE in all hospitals in which nuclear medicine is practiced.
4.2 Computed Tomography Pulmonary Angiography (CTPA): Diagnostic Accuracy and Novel Imaging
CTPA has emerged as an alternative modality for imaging of PE. Since the introduction of multidetector CT, CTPA has become the method of choice for imaging the pulmonary vasculature when PE is suspected in routine clinical practice.
The diagnostic accuracy of multidetector CT is directly linked to the dramatic improvement in image quality made possible by advances in CT technology over the past decade. The improvements in spatial and temporal resolution, as well as the overall increased quality of pulmonary arterial opacification, have allowed the routine analysis of pulmonary arteries down to the subsegmental level (Patel et al. 2003). These technical advances have improved image quality both in outpatients (Revel et al. 2005) and in dyspnoeic inpatients of the intensive care units or with underlying respiratory disease (Kelly et al. 2006; Tillie-Leblond et al. 2006).
Sensitivity and specificity of multidetector CTPA vary between 83 % and 100 % and 89 % and 97 %, respectively (Qanadli et al. 2000; Winer-Muram et al. 2004; Stein et al. 2006). Moreover, the negative predictive value of a CTPA (99.4 %) in ruling out pulmonary embolism was demonstrated to be comparable to that of pulmonary angiography (Quiroz et al. 2005), and in 2007, multidetector CT angiography has fulfilled the conditions to replace pulmonary angiography as the reference standard for diagnosis of acute PE (Remy-Jardin et al. 2007). Additional attractive features of CTPA include that it provides direct visualization of the thrombus within the pulmonary arteries and a simple positive or negative result in most of the cases (Wittram 2007; Hoang et al. 2008). The test may be able to determine an alternative explanation for symptoms if pulmonary embolism is excluded, and it may also offer clues to the aetiology of PE, such as the presence of previously undetected malignancy (Bierry et al. 2008).
Furthermore, it has proven technically feasible to assess the proximal venous system of the legs with CT venography performed during the same procedure as CTPA (Stein et al. 2006) and to provide prognostic information by demonstrating signs of right ventricular dysfunction (Ocak and Fuhrman 2008), which has been shown to be independently predictive of 30-day mortality.
Related posts:
Stay updated, free articles. Join our Telegram channel

Full access? Get Clinical Tree


