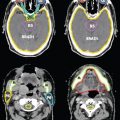
FIGURE 14-9. An axial image of a 9-field IMRT isodose distribution for an esophageal carcinoma.
1. ANATOMY
1.1. Anatomical Course
• The esophagus begins in the neck at the cricoid cartilage at the level of vertebra C7, passes through the thorax in the posterior mediastinum, and extends for several centimeters past the diaphragm to its junction with the stomach, which is near the lower border of vertebra T11. The average length is 25 cm.
• The cervical esophagus is posterior to the trachea and bounded on both sides by the recurrent laryngeal nerve and the carotid sheath. The thoracic esophagus continues posterior to the trachea to the level of bifurcation, then courses posteriorly to the left atrium, with the azygous veins ascending on either side of the thoracic segment.
1.2. Regions
• The esophagus is divided into five regions (Fig. 14-1):
º Cervical esophagus: extends from the lower edge of the cricoid cartilage to the thoracic inlet, approximately 20 cm from the incisors.
• For classification and staging, the American Joint Committee on Cancer (AJCC)1 has sub-divided the thoracic region into four locations:
º Upper thoracic esophagus: extends from the thoracic inlet to the tracheal bifurcation, 20 to 25 cm from the incisors.
º Middle thoracic esophagus: part of intrathoracic esophagus, >25 to 30 cm from the incisors.
º Lower thoracic: part of lower intrathoracic esophagus, >30 to 40 cm from the incisors.
º Esophagogastric junction: includes tumors in the intra-abdominal esophagus, esophagogastric junction, or within the proximal 5 cm of the stomach that extends into the esophagogastric junction.
1.3. Layers
• The esophagus has four layers: the mucosa, submucosa, muscularis propria, and adventitia or serosa (Fig. 14-2).
• The mucosa consists of a nonkeratinizing, stratified, squamous epithelium, the lamina propria, and the muscularis mucosa (T1a).
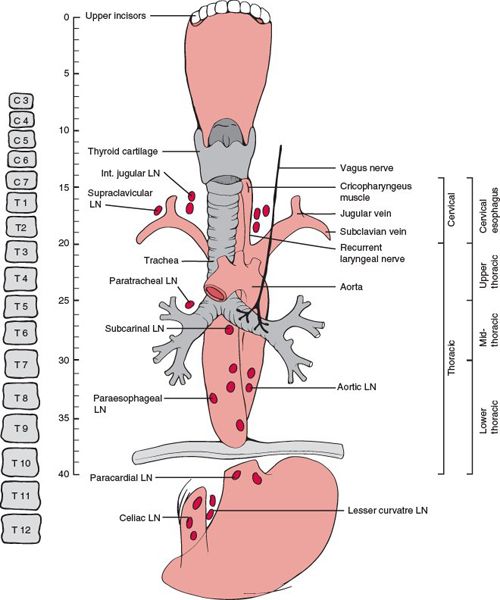
FIGURE 14-1. Basic anatomy of the esophagus. Note the lengths of the various segments of the esophagus from the upper central incisors and the AJCC classification scheme for subdividing the esophagus. (Adapted from Chao KSC, Perez CA, Brady LW. Radiation Oncology Management Decisions, 3rd ed. Philadelphia, PA: Lippincott Williams and Wilkins, 2011:358.)
• The submucosa comprises the loose connective tissue containing vessels, nerve fibers, lymphatics, and submucosal glands (T1b).
• The muscularis propria is composed of the inner circular and outer longitudinal muscle layers (T2).
• The thoracic esophagus bounded by the outermost connective tissue is called adventitia (T3). The serosa lines the short segment of the lower thoracic and intra-abdominal esophagus.2
1.4. Lymphatic Drainage
• The esophagus has a rich longitudinal interconnecting system of lymphatics in the lamina propria, and submucosa connects with the lymphatics in the muscularis propria and adventitia. Because of this longitudinal arrangement, extensive intramucosal and submucosal spread beyond a grossly visible tumor is common. Micrometastasis within the lymph fluid can travel the entire length before draining into the lymph nodes, which commonly represents “skip areas”(See Fig. 14-2A).
• The lymphatic network of the esophagus drains into three areas: the upper, middle, and lower lymphatic trunks. All three groups of lymphatics drain into the paraesophageal lymph nodes located immediately adjacent to the esophagus. The cervical esophagus drains into the internal jugular and upper tracheal lymph node groups. The thoracic esophagus drains into the superior, middle, lower mediastinal lymph node groups, and into the abdominal segment (which includes superior gastric artery, celiac axis, common hepatic artery, and splenic artery lymph nodes). However, extensive communication among the lymphatics results in a varied and unpredictable nodal involvement pattern.2
• Figure 14-3 shows the positive lymph node distribution according to the location of the primary esophageal tumor.
2. NATURAL HISTORY
• In the past 20 years, there has been a dramatic change in the epidemiology in North America and most western countries characterized by a very rapid rise in the incidence rate of 5% to 10% increase per year, and a shift of histology from squamous cell carcinoma occurring mostly in the middle and lower esophagus to adenocarcinoma arising at the distal esophagus and gastroesophageal junction.2 Adenocarcinomas now comprise of 70% of all new cases compared with 10% to 15% about 10 years ago.
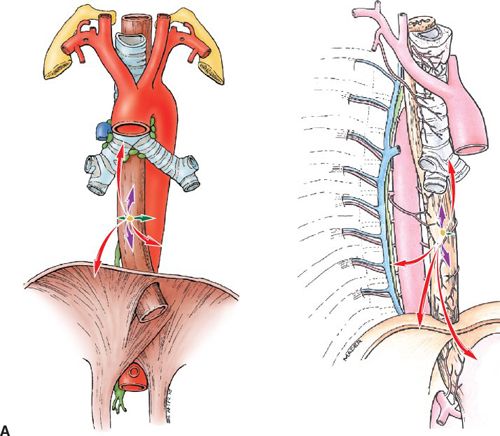
FIGURE 14-2. (A) Patterns of spread, thoracic esophagus. Left, coronal view. Right, sagittal view. T-stages indicated by colored arrows: T1, green; T2, blue; T3, purple; and T4, red.
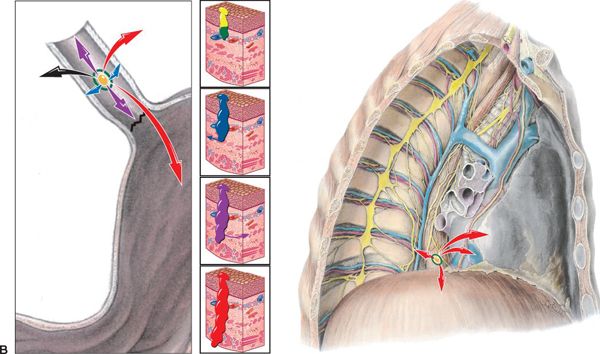
FIGURE 14-2. (B) Patterns of spread, esophagogastric junction. Left, junction magnified; Right, junction spread in chest. T-stages indicated by colored arrows: Tis (carcinoma in situ of mucosa), yellow; T1 (T1a—invades lamina propria, T1b—invades submucosa), green; T2 (penetrates the muscularis propia), blue; T3 (reaches the adventitia), purple; and T4 (invades through adventitia into neighboring organs), red. (Reprinted from Rubin P, Hansen JT. TNM Staging Atlas with Oncoanatomy, 2nd ed. Philadelphia, PA: Lippincott Williams & Wilkins, 2012:227,255. Modified from Agur AMR, Dalley AF, eds. Grant’s Atlas of Anatomy, 12th edition. Philadelphia: Lippincott Williams & Wilkins, 2009.)
• Predisposing factors for squamous cell carcinoma include high alcohol intake, heavy smoking, and nutritional deficiencies of minerals and vitamins.
• Predisposing factors for adenocarcinoma are acid reflux and Barrett esophagus.
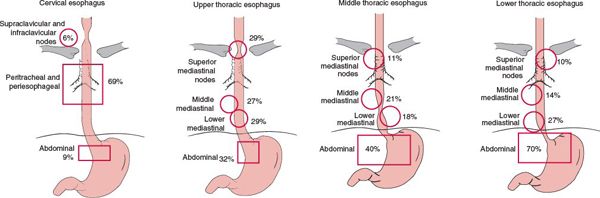
FIGURE 14-3. Positive lymph node distribution according to the location of the primary tumor. (Modified from Akiyama H, Tsurumaru M, Kawamura T, et al. Principles of surgical treatment for carcinoma of the esophagus: analysis of lymph node involvement. Ann Surg 1981;194:438; and Dormans E. Das Oesophaguscarcinom. Ergebnisse der unter mitarbeit von 39 pathologischen instituten Deutschlands durchgeführten Erhebung über das oesophaguscarcinom (1925–1933). Z Krebforsch 1939;49:86; with permission.)
2.1. Mucosal Spread
• Esophageal cancer, regardless of its histopathology features, may extend over wide areas of the mucosal surface.
• Squamous cell carcinoma often arises as multifocal tumors, presumably as a result of field cancerization. The mean microscopic proximal spread beyond the gross tumor is 10.5 ± 13.5 mm and distal spread is 10.6 ± 8.5 mm, with 94% of patients having all tumor encompassed within 30-mm margin.3
• Adenocarcinomas may have varying lengths of mucosal and submucosal disease, particularly in patients with the long segment of Barrett esophagus. Proximal mean microscopic proximal spread beyond the gross tumor is 10.3 ± 7.2 mm and distal spread is 18.3 ± 16.3 mm, with 94% of patients having all tumor encompassed within 50-mm margin.3
2.2. Patterns of Lymph Node Metastasis
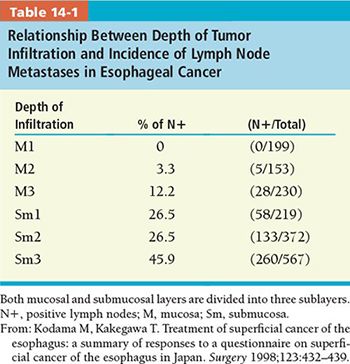
• Lymph node metastasis occurs both upward and downward at a very early stage (Fig. 14-3). The incidence of lymph node metastasis is directly correlated with the depth of tumor invasion (Table 14-1).4
• Furthermore, larger tumors are more likely to present with locoregional nodal metastasis (Table 14-2).
3. DIAGNOSIS AND STAGING SYSTEM
3.1. Signs and Symptoms
• Early symptoms include those related to acid reflux and Barrett esophagus.
• Odynophagia as a result of esophageal ulceration.
• Progressive dysphagia and weight loss are the most common clinical symptoms for all lesions as a result of tumor obstruction of the esophageal lumen and deep invasion of the esophageal wall. Both are indications of locally advanced disease.
3.2. Imaging
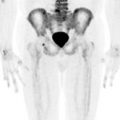
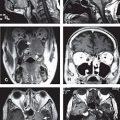
• Pretreatment evaluation of esophageal cancer typically includes a combination of esophagogram, endoscopic examination with biopsy, endoscopic ultrasound examination, computed tomography (CT) of the chest, magnetic resonance imaging (MRI), and positron emission tomography (PET).
• The accuracy of staging by esophagography, esophagoscopy, endoscopic ultrasonography, and CT scan for T staging was 80% and for N staging 72% with a sensitivity of 78%, specificity of 60%, and positive predictive value of 78%. The overall accuracy of stage group was 56%.

3.2.1. Esophagogram
• Esophagograms provide good assessment of the structure of the esophageal lumen and mucosal surface. Mucosal irregularity, an intraluminal filling defect, and stricture seen on a barium esophagogram are suggestive of an esophageal malignancy (Fig. 14-4A).
• Although the length of a tumor can be estimated from a barium esophagogram, a noticeable discrepancy exists when it is compared with the length measured from CT, esophagastroduodenoscopy, and histopathology.
3.2.2. Esophagastroduodenoscopic Examination
• Esophagastroduodenoscopic (EGD) examination with biopsy is the procedure of choice for diagnosing esophageal cancer. The lesion seen at the endoscope examination must be brushed and then biopsied. The accuracy of brushing cytology plus biopsy is 98.8% compared with 93.9% with biopsy alone and 87.9% with brushing cytology alone.
• EGD allows for an excellent structural examination of the esophageal lumen and determining the extent of mucosal spread, although EGD alone cannot assess the extraluminal extension of the disease or nodal status.
3.2.3. Endoscopic Ultrasonography
• Endoscopic ultrasonography (EUS) is an ideal modality for determining clinical tumor and nodal stage according to the TNM staging system. Because it can distinguish wall layers of the esophagus, EUS provides a more accurate determination of the depth of tumor invasion, which is the basis of tumor staging, than a CT scan.
• The reported accuracy of EUS in tumor staging ranges from 75% to 90% compared with pathological examination of the resected specimen.12–15 The accuracy of EUS in measuring tumor invasion ranges from 76% to 89%, compared with 49% to 59% for CT.13–16 EUS is also more accurate than CT in staging regional nodal metastasis. The accuracy of EUS ranges from 70% to 90%,17–20 compared with 46% to 58% for CT.13,16
• Although EUS is the most powerful procedure for accurately staging tumors of the esophagus, its role in target delineation is limited by the fact that EUS defines no spatial relationship between the tumor and adjacent structure and that the examination sometimes cannot be completed because of severe stricture.
3.2.4. CT Scan
• For preclinical evaluation and target delineation of esophageal cancer, CT is the most commonly used diagnostic modality (Fig. 14-4B).
• The normal esophageal wall thickness seen on a CT scan is 3 mm or less; a wall thickness of more than 5 mm is considered abnormal.21 Evident thickening of the esophageal wall and proximal lumen dilatation caused by obstruction characterize an esophageal malignancy. An asymmetric thickening of the esophageal wall is the principal, but nonspecific CT finding of an esophageal carcinoma.
• Although CT does not define the layers of the esophagus, the lack of a fat plane between a tumor mass and an adjacent structure seen on CT scan indicates a T4 tumor.
Related posts:
Stay updated, free articles. Join our Telegram channel

Full access? Get Clinical Tree


