Posterior tibial tendon dysfunction (PTTD), a leading cause of adult-acquired flatfoot deformity, involves progressive tendon degeneration and medial arch collapse. MR imaging remains the diagnostic cornerstone, combining high-resolution morphologic sequences with the potential for quantitative mapping techniques that may permit better detection of early microstructural tendon changes. Dynamic and ultrahigh-field (7T) protocols may further enhance biomechanical assessment and guide personalized surgical planning. Concurrently, innovations in tendon augmentation, fiber tape reinforcement, and 3 dimensional-bioprinted grafts offer more tailored reconstructive options. Finally, MR imaging-based postoperative monitoring of graft integration and repair integrity help to optimize long-term outcomes in PTTD.
Key points
-
•
PTT dysfunction and failure of the superomedial spring ligament lead to adult-acquired flatfoot. MRI remains the diagnostic cornerstone for early detection and precise staging.
-
•
Coronal proton density fat-suppressed (PD-FS) and axial T2 fat-suppressed (T2-FS) sequences best identify posterior tibialis tendon and spring-ligament injuries-partial versus full-thickness tears.
-
•
Surgical planning, tendon augmentation, fiber-tape reinforcement, and graft choices rely on high-resolution imaging guidance.
-
•
Postoperative MR imaging timelines (0–3 months scar, 3–6 months maturation, >6 months stable low-signal tendon) are critical to differentiate healing versus complications.
Abbreviations
| DTI | diffusion tensor imaging |
| MT | magnetization transfer |
| PTT | posterior tibial tendon |
| PTTD | posterior tibial tendon dysfunction |
| qMR imaging | quantitative MR imaging |
| UTE | ultrashort echo time |
Introduction
Demographics and Etiology
Patients with Posterior Tibial Tendon Dysfunction (PTTD) suffer from pronounced quality-of-life impairments, including chronic pain, reduced mobility, and altered gait mechanics, which worsen as the disease advances, reflecting significant functional declines documented in biomechanical studies of Myerson stages 1 and 2 PTTD. , Although validated cost-utility frameworks (eg, quality-adjusted life years [QALYs], 36-item short form survey instrument [SF-36], and American Orthopedic Foot and Ankle Society Score [AOFAS]) are used broadly in foot and ankle disorders, no high-quality analyses quantify PTTD’s global burden; the most analogous US data show operative incidence rising from 0.26 to 3.04 per 100,000 between 1996 and 2014, with associated costs increasing from ∼$57K to nearly $6.9 M over that period. ,
PTTD predominantly affects women over 40 and arises from degeneration of the tendon’s hypovascular zone behind the medial malleolus. , This degeneration leads to progressive medial arch collapse and flatfoot deformity. Early symptoms are subtle and often overlap with those of other foot pathologies, making sensitive imaging crucial. PTT degeneration, in the absence of trauma or systemic disease, typically emerges after skeletal maturity and advances from flexible to rigid flatfoot.
Biomechanics
The PTT is a dynamic stabilizer of the medial longitudinal arch and plays a crucial role during the midstance and push-off phases of gait. Dysfunction disrupts normal foot biomechanics, leading to inefficient energy transfer and increased risk of further musculoskeletal injury. In step-up and step-down tasks, PTTD patients show exaggerated midfoot dorsiflexion, inversion, and external rotation, along with increased ankle eversion and plantarflexion. ,
Classification
PTTD can be staged using the Myerson classification, which ranges from stage I (inflammation) to stage IV (ankle involvement). For didactic purposes, Table 1 juxtaposes clinical staging with commonly observed MR imaging/Conti appearances. MR imaging severity generally correlates with clinical severity, but no validated linear mapping exists between these systems (see Table 1 ). ,,
Table 1
Myerson’s classification of PTTD with MR imaging Conti-grade correlation
| Stage | Clinical Features | Radiographic (Weight-Bearing X-ray) | Typical MR Imaging Appearance (Conti Grade) |
|---|---|---|---|
| I | Tendon pain/inflammation; no deformity | Normal hindfoot alignment | Often normal or tenosynovitis/paratendinitis (sheath fluid, peritendinous edema; outside Conti); early tendinosis with thickening/intrasubstance T2 hyperintensity ( Conti I ) |
| IIa | Flexible flatfoot; weakness on single-leg heel raise | Mild hindfoot valgus; partial talar uncovering | Conti I–II: tendinosis (thickening/heterogeneous signal) or partial-thickness fiber discontinuity; peritendinous fluid common |
| IIb | Flexible flatfoot + midfoot abduction | Increased talonavicular uncovering | Conti I–II: tendinosis with segmental fiber thinning and/or partial-thickness tears; increasing talonavicular uncovering |
| III | Rigid flatfoot; fixed hindfoot valgus | Subtalar joint arthritis | Advanced degeneration up to complete disruption: Conti IIIA (diffuse swelling with uniform degeneration, a few intact strands) to Conti IIIB (complete rupture/replacement by scar); sheath fluid common |
| IV | Ankle valgus tilt; medial tibiotalar widening | Tibiotalar subluxation | If the PTT is still present: Conti IIIA features; if torn: Conti IIIB . Postoperative changes and graft signal heterogeneity as applicable |
Myerson classification stages of posterior tibial tendon dysfunction, with associated clinical features, weight-bearing radiographic findings, and MR imaging Conti-grade correlations. ,,
Abbreviations: I, longitudinal splits/enlargement (early), II, narrowed tendon with long splits and intramural degeneration, IIIA, diffuse swelling with uniform degeneration and a few intact fibers, IIIB, complete rupture with scar replacement. Clinical stage ↔︎ Conti grade is not a linear map; use Conti alongside alignment and symptoms.
Role of MR Imaging in Diagnosis and Management
High-resolution MR imaging is key not only for early detection of tendon degeneration but also for monitoring treatment response and guiding management. A meta-analysis reported sensitivity up to 95% and specificity up to 100% for identifying PTT tears. The American College of Radiology similarly endorses MR imaging as the modality of choice for chronic ankle pain and suspected tendon injuries. While early disease often responds to conservative care, advanced stages require surgery, and rising procedural costs underscore PTTD’s growing burden. MR imaging assists in surgical planning by showing tendon degeneration and tear severity, delineating tendon course and integrity of potential grafts, and depicting associated neuropathy, arthropathy, and bone quality.
Purpose
This article examines MR imaging advances over the past decade, from routine high-resolution protocols to quantitative techniques such as T2 mapping, ultrashort echo time (UTE), and 7T imaging. It integrates these with current surgical innovations and postoperative assessment to guide comprehensive PTTD management.
MR imaging evaluation of the posterior tibial tendon
Conventional Imaging
Morphologic findings
Conventional MR imaging excels at soft-tissue assessment (eg, tendon thickening and signal heterogeneity). Accurate interpretation starts with recognition of variants that alter mechanics and appearance, such as accessory/navicular prominence and retromalleolar groove morphology, as well as common cofindings including tenosynovitis, enthesopathic or ligamentous injury, and features of advanced deformity (pes planus and subfibular impingement). ,
Because static MR imaging is limited for alignment under physiologic load, weight-bearing radiographs and weight-bearing CT are essential adjuncts for dynamic alignment evaluation and correction metrics. ,, On MR imaging, retromalleolar (posteromedial distal tibial) osteophytosis is frequently detected in PTTD (reported in 63.4% on MR imaging vs 21.3% on radiographs), and tibial retromalleolar groove morphology correlates with high-grade partial and complete tendon tears (OR 4.98, P <.001).
Small amounts of fluid around the distal 1 to 2 cm of the PTT-beyond its sheath insertion near the medial malleolus—are now recognized as often physiologic. ,, Patient and healthy-volunteer data confirm this appearance, and activity-induced effusions can further mimic pathology on MR imaging; these nuances should temper overcalling tenosynovitis or tearing in this region. ,,
Insertional variants and Os naviculare subtypes
An accessory navicular (os naviculare) occurs in 3 types: Type I (sesamoid within the tendon), Type II (synchondrosis with the navicular), and Type III (fused and enlarged tuberosity). Types II and III are most strongly linked to PTTD. The mechanism is largely biomechanical: type II alters stress across the synchondrosis, acting as a pain generator and weakening the tendon’s lever arm, while type III produces bony prominence and abnormal tendon gliding that increase strain on the hypovascular zone. MR imaging can demonstrate marrow edema at the synchondrosis in symptomatic type II lesions, and detailed anatomic and imaging studies confirm that these insertional variants predispose to tendon degeneration and medial arch instability.
Associated deltoid and talocalcaneal ligament
Balen and Helms demonstrated the value of MR imaging in detecting spring ligament injuries, which are seen in 74% to 92% of patients with PTT tears, as well as related abnormalities of the deltoid ligament, sinus tarsi, and plantar fascia. Chhabra and colleagues further detailed how MR imaging distinguishes superficial (hindfoot eversion and talar head displacement) from deep (valgus tilt and possible tibial nerve compression) deltoid ligament injuries.
Magic-angle and T2∗ anisotropy
Tendons exhibit orientation-dependent T2∗ signal increases when fibers approach the magic angle of approximately 55° relative to the main magnetic field, potentially simulating pathology. This artifact becomes more pronounced at higher magnetic field strengths and is particularly relevant in imaging the PTT, which curves around the medial malleolus and often assumes orientations near this critical angle. Failure to account for this anisotropy can lead to false-positive signal changes that mimic tendinopathy. Tailoring imaging planes, such as using oblique axial sequences aligned with the tendon’s course, enhances short-axis visualization and helps mitigate the magic angle effect. Additionally, advanced signal modeling may further aid in distinguishing true degeneration from artifact.
Variant tendon slips and tear characteristics
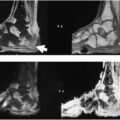
PTT fibers converge on the navicular tuberosity ( Fig. 1 ), with accessory slips to the medial, intermediate, and lateral cuneiforms ; the bases of the 2nd to 4th metatarsals ( with occasional extensions to the 1st or 5th ); and the reported sustentaculum tali. ,, Beyond these, Pastore’s cadaveric/MR imaging study shows plantar expansions to the cuboid . MR imaging effectively maps these complex insertions and distinguishes normal accessory tendon slips from true tendinopathy, preventing mistaken calls of split tears or partial avulsions when low-signal bands or obliquely oriented slips are seen. , Recognizing these variants is essential for accurate assessment of medial arch stability and for avoiding misdiagnosis of PTT pathology. ,,,
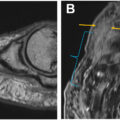
Normal posterior tibialis tendon and adjacent spring ligament on axial and coronal PD MR imaging. ( A ) Axial PD demonstrates the normal posterior tibialis tendon at the navicular insertion as a homogeneous hypointense structure ( white arrow ); the normal superomedial band of the spring ligament ( black arrow ) is immediately lateral to the PTT, adjacent to the talus ( star ), and slightly thinner than the normal PTT. Note adequate medial coverage of the talar head by the navicular bone. Also note the normal FDL tendon ( curved arrow ), whose proximity makes it a frequent choice for use in PTT graft repair and augmentation. ( B ) Coronal PD highlights that the superomedial band ( black arrow ) should be interposed between the PTT ( white arrow ) and talar head.
The Conti MR imaging classification (see Table 1 ) defines PTT tears as Conti I (subdivided), II , IIIA , and IIIB : I-A —1 or 2 fine longitudinal splits without intrasubstance degeneration (often undersurface); I-B —increased number of longitudinal splits with tendon enlargement and mild peritendinous fibrosis but no significant degeneration; II —a narrowed tendon with long longitudinal splits and intramural degeneration (often with a bulbous segment distal to the attenuated portion); IIIA — diffuse swelling with uniform degeneration and a few intact strands; IIIB — complete rupture with scar replacement ( Fig. 2 = Conti I; Figs. 3 and 4 = Conti II; Fig. 5 = Conti IIIB). For clarity, the commonly used shorthand Grade I = thickening, Grade II = partial tear, Grade III = complete tear is not the original Conti system; we use the formal Conti definitions here.
PTT tendinopathy with tendon thickening and spring ligament edema on fat-suppressed PD. 44-year-old woman with ankle pain, Myerson stage I. ( A ) Axial fat-suppressed PD shows PTT attenuation and hyperintensity ( arrow ) (Conti grade I), indicating early tendinopathy and dysfunction. The adjacent spring ligament SMB is thickened ( arrowheads ) due to degeneration and remodeling. ( B ) Coronal fat-suppressed PD and ( C ) Coronal PD show thickening of the distal fibers of the PTT in cross-section ( arrow ), near the navicular insertion, with swelling and edema of the weakened spring ligament ( arrowhead ).
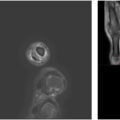
Interstitial tear of the PTT on axial PD MR imaging. 32-year-old man with medial ankle pain for several weeks. Axial PD below the level of the malleolus depicts linter hyperintensity within the substance of the PTT ( white arrow ), indicative of interstitial tearing (Conti grade II). Deep posterior deltoid fibers ( short black arrow ) lie in close proximity to the tendon.
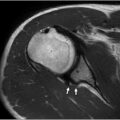
Tenosynovitis with tendon sheath fluid, talar head uncovering, and spring ligament attenuation. 40-year-old woman with weakness on single leg heel rise and midfoot abduction consistent with Myerson stage Iib. Axial fat-suppressed PD highlights accumulation of fluid in the tendon sheath, indicative of tenosynovitis, with superficial fissuring of the underlying tendon fibers (Conti grade II). Note the uncovering of the talar head ( star ) as the navicular shifts laterally, and attenuation of the spring ligament SMB ( arrowheads ) with periligamentous edema, consistent with PTT dysfunction.
Full-thickness PTT tear with complete spring ligament rupture and cartilage loss. 58-year-old woman with chronic medial ankle pain and flat foot deformity (Myerson stage III). ( A ) Axial PD depicts partial thickness PTT tear from the navicular (Conti grade II) with retracted torn tendon fibers ( arrow ); deeper plantar fibers remained intact (not shown). The spring ligament SMB ( dashed arrow ) is completely ruptured, with no tissue between the partially torn PTT and talar head. There is also more superficial retinacular scarring and fibrosis. ( B ) Coronal PD depicts additional partial tearing of the more plantar components of the spring ligament ( dashed arrow ). With high resolution 3T MR imaging, high grade cartilage loss in the talar head is observable ( arrow ).
Separate from the Conti system, MR imaging findings such as tendon fraying, retraction distance greater than 10 mm, and posterior tibialis muscle atrophy or fatty infiltration have been associated with poorer response to conservative therapy and worse surgical outcomes. ,, We reference the Conti MR imaging grading system as a historical framework developed in the early MR imaging era from relatively small cohorts; more contemporary work with histologic reference supports MR imaging assessment while underscoring the need for standardized, modern criteria.
Spring ligament injuries
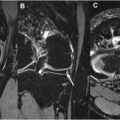
As the PTT fails, the spring ligament, and particularly the superomedial band, incurs additional biomechanical load that may ultimately lead to structural failure and rupture. Spring ligament injuries on MR imaging crudely fall into 2 categories, partial (see Fig. 4 ) and complete tears (see Fig. 5 ; Figs. 6 and 7 , Table 2 ). ,,,,,, Full-thickness ruptures may require surgery, while partial tears often allow conservative care.
High-grade partial spring ligament tear with associated talar head bone contusion. 62-year-old gentleman with left flatfoot deformity and medial ankle pain (Myerson stage III). ( A ) Coronal fat-suppressed PD shows marked attenuation and thinning of the spring ligament SMB ( arrowheads ) with high grade partial tear and associated edema, although surgery 3 days later revealed full thickness tearing. Surgery revealed only mild posterior tibial tenosynovitis and tendon thickening (Conti grade I), emphasizing that the relationship between Myerson stage and Conti grade is not always direct. ( B ) Axial fat-suppressed PD shows bone contusion pattern edema ( white arrow ) in the talar head, a finding that often accompanies later stage PTTD and spring ligament injuries. The patient was treated with spring ligament repair and internal brace augmentation, and flexor digitorum longus tendon transfer.
Full-thickness PTT tear with torn spring ligament and reactive bone marrow edema. 68-year-old man with acquired flatfoot and hindfoot valgus (Myerson stage III). Axial fat-suppressed PD shows a full thickness tear of the PTT, with interstitial tearing and fraying of the distal torn margin, as well as accompanying tenosynovitis ( arrow ) (Conti grade 4). The adjacent spring ligament SMB is also torn ( dashed arrow ), and there is associated reactive bone marrow edema in the talar head because of inflammation and abnormal biomechanical stress ( arrowhead ). The patient underwent PTT repair and FDL transfer to the navicular, allograft reconstruction of the spring ligament, and Cotton osteotomy of the medial cuneiform.
Table 2
MR imaging features of spring ligament tear types and surgical implications
| Tear Type | MR Imaging Findings | Surgical Implications |
|---|---|---|
| Partial tears | Thickening/remodeling (>5 mm proximally; >7 mm medio-plantar) or distal attenuation (<2 mm) with T2 heterogeneity , | Direct repair (often augmented with suture tape) plus FDL transfer; or conservative management depending on symptoms , |
| Complete ruptures | Full-thickness gap with the PTT abutting the talar head, often alongside posterior tibial tendonopathy | Full ligament reconstruction: autograft, allograft, synthetic material; synthetic augmentation has yielded better patient-reported outcomes than hamstring allografts. Concurrent PTT augmentation (eg, FDL transfer) is essential for medial arch stability , |
MR imaging characteristics of spring ligament tear types with corresponding surgical recommendations. ,,,,,,
Quantitative and Multiquantitative MR Imaging
Overview of quantitative MR imaging techniques
Traditional MR imaging correlates with functional deficits but lacks sensitivity for early histopathologic changes-collagen disorganization, hyalinization, proteoglycan buildup, and neovascularization. Quantitative MR imaging (qMR imaging) techniques (eg, T2 mapping and T1ρ mapping) and UTE may potentially detect these microstructural alterations before overt macroscopic tearing and clinical dysfunction. ,
T2 and T2∗ mapping
Elevated T2 values correlate with collagen disorganization and tendon degeneration. In a rabbit model of PTTD, Fukawa and colleagues demonstrated that T2∗ values rise significantly in degenerative tendon regions. In contrast, Lockard and colleagues reported subregional T2∗ variation along the PTT without demonstrating a link to degeneration, although these consisted of healthy asymptomatic subjects. In that study, the mean PTT T2∗ was 7±1 ms, but subregion values ranged from 6±1 to 9±2 ms. By detecting early microstructural changes, T2∗ mapping potentially enhances characterization of early PTTD, though dedicated T2∗ mapping studies of symptomatic patients have yet to be published ; Khoury and colleagues (1996) reported elevated T2 signal in symptomatic PTTD patients but did not include asymptomatic controls for comparison.
Ultrashort echo time and advanced sequences
UTE MR imaging provides high-contrast imaging of short-T2 structures such as the PTT and adjacent ligaments. However, UTE-T2∗ and UTE-T1 rho are vulnerable to magic angle artifacts, such that angle-induced variation exceeds changes produced by tissue degeneration and pathology. In contrast, magnetization transfer (MT) biomarkers are less influenced by magic angle effects, revealing collagen quality indirectly via the magnetization exchange phenomenon between macromolecular and water pools. UTE-MT is sensitive to biochemical changes in various regions of the Achilles tendon in a time-dependent manner after long-distance running. These exercise-related UTE-MT changes are interpreted as physiologic loading/remodeling; in published UTE-MT work, they are evident at ∼2 days and tend to revert toward baseline by ∼4 weeks, while related UTE OSR/T2∗ studies show hours-days recovery kinetics. Jerban and colleagues found that UTE-MT biomarkers were significantly lower in an elderly cohort (mean age 75 years) compared to a younger cohort (mean age 29 years) for both the anterior tibial tendon (decreased by 17%) and PTT (decreased by 23%), with high interobserver agreement. Participants were asymptomatic volunteers; the observed reductions therefore most likely reflect normal, age-related collagen/matrix changes rather than clinical tendinopathy. In contrast, T2 and T1 mapping did not show a consistent difference between groups.
Clinical utility and limitations
The qMRI techniques, particularly T2 mapping, could detect early microstructural changes in the PTT that conventional T1/T2 imaging may miss, providing insight into tissue composition and degeneration. Multiparametric approaches may further distinguish inflammation, degeneration, and partial tears by combining metrics (eg, T2 and T1ρ values) and enable monitoring of treatment response, such as graft integration or biologic therapy efficacy. , Quantitative values are method-dependent: differences in scanners, sequences, and postprocessing can shift absolute T2/T1ρ numbers, limiting cross-site cutoffs. Fiber orientation and partial-volume at the curved navicular insertion can inflate T2/T1ρ and mimic disease unless sampling is standardized. Small cohorts and scarce outcome-linked thresholds mean changes should be interpreted with symptoms and morphology, not as stand-alone proof of tendinosis or healing. Limited availability of advanced implementations further slows routine clinical adoption of quantitative tendon MR imaging for PTT assessment (eg, T2/T1ρ mapping and UTE-MT).
Dynamic Imaging Protocols
Kinematic gait analysis
These joint-level findings are biomechanical, but we present them here to align with the dynamic imaging discussion; see §1.2 for broader context.
Multisegment gait analysis shows that PTTD redistributes work away from the ankle, reducing ankle power and increasing energy absorption across the Chopart (talonavicular–calcaneocuboid) joint, especially in Stages II-III, during walking. Using 3D motion capture and force-plate analysis, Stage II PTTD patients exhibit greater midfoot dorsiflexion and inversion with reduced midfoot abduction and larger sagittal-plane excursion (dorsiflexion/plantarflexion), along with proximal adaptations in knee/hip moments, increased knee internal rotation, and decreased hip adduction, during late stance. Practically, these signatures indicate where motion is absorbed (midfoot/Chopart) and when (late stance), informing stance-phase positioning for dynamic MR imaging/US and providing quantitative baselines for prepost comparisons. ,
Dynamic MR imaging
Dynamic MR imaging, including cine phase contrast, real-time, and spin-tag sequences, offers superior resolution, depth penetration, and reproducible motion quantification relative to dynamic ultrasound. Borotikar and colleagues demonstrated that cine phase contrast and real-time MR imaging are reliable for musculoskeletal motion assessment, while spin-tag MR imaging excels at quantifying muscle displacement; however, image quality varies with field strength and protocol parameters. Protocol setup and 1.5 T versus 3T differences further impact diagnostic capabilities. Notably, ultrasound is an excellent imaging modality because of the PTT’s superficial location, permitting high resolution ( Fig. 8 ) and dynamic imaging to assess PTT tendon gliding motion and subluxation, but it remains highly operator-dependent.
Ultrasound of full-thickness spring ligament tear and partial PTT tear versus the contralateral intact side. Sagittal plane ultrasound in the medial midfoot show a full thickness tear of the spring ligament SMB on the left ( dashed arrow ) and partial tearing of the overlying PTT ( solid arrow ); the intact right spring ligament SMB ( star ) and overlying PTT are shown for comparison. T, talar head.
Diffusion tensor imaging
Diffusion tensor imaging (DTI) offers a noninvasive evaluation of tendon microstructure by quantifying water diffusion anisotropy. In Achilles tendon studies, 3T DTI sequences improved SNR and detected collagen disruption via altered diffusivity and tractography metrics. However, no DTI studies have yet targeted the PTT, although DTI of the posterior tibial nerve in neuropathic conditions suggests a potential indirect marker of tendon health. ,
Emerging MR Imaging Techniques
3T MR imaging review
3T MR imaging provides higher signal-to-noise ratio (SNR) and finer spatial resolution than 1.5T. State-of-the-art coils at 1.5T can partially narrow this gap, yet 3T is more prone to magnetic susceptibility, chemical-shift, and dielectric artifacts, imposes greater specific absorption rate (SAR)-related heating limits, and demands protocol adjustments to account for altered T1/T2 relaxation times.
7T MR imaging: status, gaps, and broader musculoskeletal applications
7T MR imaging delivers markedly increased SNR and resolution for PTT visualization but remains largely research-focused, with B1 inhomogeneity, altered relaxation times, pronounced susceptibility artifacts, and elevated SAR demanding specialized coils and pulse sequences. A 2025 scoping review of 83 studies found only 11% addressing musculoskeletal applications, with none on PTTD.
7T MR imaging delineates disc microarchitecture and annular fissures with T2 mapping and sodium imaging ; detects early osteoarthritic cartilage degeneration via T2/T2 mapping, sodium imaging, and gagCEST ; and uncovers tendon microtears invisible at lower fields, highlighting its potential for early PTTD detection and monitoring. ,
Artificial intelligence and deep learning
Deep learning techniques, especially convolutional neural network (CNN), that flag early collagen disruption on routine MR imaging, show promise for detecting subtle PTTD changes when paired with quantitative T2 and T1ρ mapping. However, a bibliometric analysis found that only ∼3% of deep-learning studies in orthopedics focus on tendon imaging, underscoring the need for more PTTD-specific model development.
Surgical management of posterior tibial tendon dysfunction: evolving strategies
Overview of Current Surgical Landscape
Goals and outcomes of nonoperative management
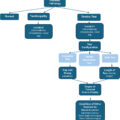
Nonoperative management for stage I and II PTTD aims to decrease inflammation, mechanically offload the PTT, and allow healing to halt degenerative progression as the first-line treatment. Structured protocols combining custom orthoses, designed to support the medial longitudinal arch, and high-repetition eccentric exercise programs have achieved successful outcomes in up to 83% of patients. Gómez-Jurado and colleagues similarly reported significant improvements in pain and function with orthotic support plus supervised exercise in early-stage disease. There is emerging evidence that targeted corticosteroid injection benefits some patients, with a small study of 38 injections showing that 18 (47%) experienced at least good pain relief. The role of such minimally invasive procedures in delaying or obviating the need for surgery remains to be elucidated, with most experts reserving surgical intervention for patients who fail a 3 to 6 month trial of these or other conservative measures.
Surgical indications, imaging, and techniques
Surgical indications for PTTD, along with corresponding imaging assessments and operative techniques by stage, are summarized in Table 3 .
Table 3
Stage-based indications, imaging, and surgical management of posterior tibial tendon dysfunction
| Stage | Indication | Imaging Assessment | Surgical Technique |
|---|---|---|---|
| II (refractory) | Symptomatic after 3 to 6 mo of conservative care | MR imaging for tendon degeneration/rupture + ligament assessment |
|
| III (rigid flatfoot) | Fixed hindfoot deformity ± forefoot supination | MR imaging as above |
|
| IV (ankle arthritis/deltoid insuff.) | Severe multicompartmental disease | MR imaging as above |
|
Related posts:
 Detailed Review of MSK Reporting and Data Systems
 3 Dimensional MR Imaging of the Hand and Fingers
 High-Resolution Peroneal Compartment Imaging at Ankle-2d and 3d MR Imaging
 High-Resolution Imaging of Knee Meniscus Anatomy and Tears
 MR Neurography of Lower Extremity Sports-Related Nerve Injuries
 Shoulder Impingement Syndromes: State of the Art Imaging
Stay updated, free articles. Join our Telegram channel

Full access? Get Clinical Tree


