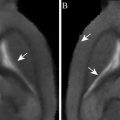
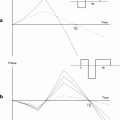
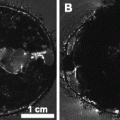
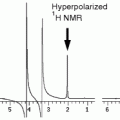
Fig. 1.
Immediately after the onset of a focal loss of perfusion, a cascade of detrimental events is initiated. Excitotoxicity lethally damages neurons and glia, and triggers a number of other phenomena, such as peri-infarct depolarizations, inflammation, and apoptosis, all of which contribute to tissue death in the end. Reproduced from (6) with permission.
Stroke can lead to many different symptoms depending on the location of the occlusion, thus brain area affected, commonly resulting in transient or permanent symptoms like complete or partial loss of somatosensory and sensory motor functions, paralysis, aphasia, nausea, and headaches (8). Except for administering recombinant tissue plasminogen activator (rt-PA) as a thrombolytic agent (9) to resolve and/ or to mechanically remove the clot obscuring the blood flow with a MERCI retriever, an embolectomy device (10), there is no other effective treatment for patients suffering a stroke. Thus, not only does stroke tragically affect many people but it also has a severe impact on the society as a whole through hospital care costs, rehabilitation costs, and lost work force capacity from both individuals having a stroke and their families caring and nursing from home (11). Some of the risk factors of suffering a stroke are hypertension, diabetes mellitus, smoking, alcohol abuse, and age. Since the average age of the population is increasing, and the stroke risk doubles with every decade over the age of 50, it is expected that the incidence of stroke also will increase concomitantly (8).
There are several animal models used experimentally in order to study stroke (for an overview see (11)). The most widely used model of stroke is unilateral middle cerebral artery occlusion (MCAO). MCAO can be induced in many ways, such as direct occlusion by permanent ligation after craniotomy (12) and by indirect occlusion by injecting fibrin clots into the common carotid artery (13). However, the most common way is the intraluminal filament occlusion technique, in which a filament is inserted in the common carotid artery, advanced into the circle of Willis and further until reaching the origin of the middle cerebral artery (14). This model, compared to its permanent counterparts, allows for reperfusion at any given time point after occlusion and, thus, the severity of stroke and extent of damage can be adjusted.
Stroke can be described as having an acute phase, during which a massive and rapid cell death occurs, leading to symptoms of functional deficits. Thereafter follows a subacute phase in which slower cell death and secondary phenomena take place, and, finally, a chronic phase which is recognized by tissue reorganization and functional improvement (Fig. 1). In the experimental setting, we can use MRI as a tool to study the mechanisms of stroke. The chain of events following an ischemic stroke is very complex and this chapter will not cover an in-depth description of the pathophysiology of stroke. However, we will give a brief overview of the main detrimental events occurring at each of the three above-defined time periods and discuss the ways in which MRI can be used as an instructive and valuable tool in stroke and stroke-related research.
2 MRI Contributions to Stroke Research
2.1 The Acute Phase
2.1.1 Events Occurring Within Minutes and Hours
The reduction in blood flow, due to vascular occlusion, leads to decreased delivery of energy metabolites, such as glucose and oxygen, to the cells in the affected tissue. Rapidly after onset of ischemia, cell respiration fails and the ATP pool is depleted (15). The cells depolarize, since they no longer can maintain the ionic gradients across the membranes (16), and voltage-sensitive ion channels are opened for calcium, sodium, and chloride to enter the cells. Together with these ions, water will stream into the cytoplasm, which causes a swelling of the cells called cytotoxic edema (17).
The intracellular calcium overload causes an accumulation of reactive oxygen species, which can degrade DNA and disrupt the electron transport chain in the mitochondria, leading to mitochondrial permeability transition (18). The increased permeability can trigger mitochondria matrix swelling, disruption of the outer membranes and, as a consequence, release of cytochrome C, known to be directly involved in apoptosis (20, 21). Mitochondrial dysfunction is also associated with activation of cyclooxygenase (COX) and nitric oxide synthase (NOS), both of which can be sources of highly reactive free radicals causing biochemical reactions that damage the cells even more (19, 20).
Due to anoxic depolarizations and the presynaptic uptake of calcium, transmitters will be released from intracellular stores. Within minutes after stroke onset, this results in a marked increase in the levels of the excitatory amino acid glutamate in all affected tissue (3, 6). The excess of glutamate in the extracellular space, and the subsequent activation of its ionotropic and metabotropic receptors, produces excitotoxicity since it further increases the intracellular calcium overload (21). This high calcium content within the cells will induce a wide range of detrimental calcium-dependent intracellular signaling cascades, including the activation of endonucleases, proteases, and phospholipases, which degrade the DNA, cytoskeleton, and proteins in the extracellular matrix, and result in cell death (22, 23).
The cells in the core region of the stroke will not be able to repolarize and are irreversibly damaged. However, the cells in the penumbra are still able to repolarize and, thus, undergo cycles of depolarization and repolarization (24). These waves of peri-infarct depolarizations, called spreading depressions, are mediated by increased potassium and glutamate levels, and are initiated by the infarct core but occur in the penumbra where they can travel from their point of origin all over the hemisphere. These spreading depression-like waves are thought to contribute to increased glutamate levels in the penumbra with low oxygen supply, by increased metabolic demand during the repolarizations. This again will, by metabolic exhaustion, recruit the penumbra into the growing infarct core (7, 25–27).
2.1.2 Angiography
Flow through larger vessels can be measured with magnetic resonance angiography (MRA). Techniques of MRA are based on the separation between moving and stationary spins, which can be achieved by applying radiofrequency (rf) pulses to saturate stationary tissue and, thus, enhance the flow-related signal contribution. Since MRA has a relatively low spatial resolution, it has mostly been confined to determine the existence and location of an occlusion or an aneurysm, or the degree of arterial stenosis in humans, having large vessels in the brain.
MRA can, however, be used to visualize the circle of Willis and even smaller branches of the middle cerebral artery (MCA) in both rats and mice (28–30) in three-dimensional datasets within a few minutes scan time. This is obtained without the use of contrast agent employing the time-of-flight (TOF) or inflow angiography. With this method, it is important to use a short echo time, at short repetition time, to make flowing blood much brighter than stationary tissue. It is a fast method providing both information of the potential for recanalization and enabling evaluation of therapeutic success of lysis of obstructing blood clots in experimental studies (31). Figure 2 illustrates the highly resolved architecture of perfused vessels in the rat brain, both before occlusion, during occlusion by clot emboli, and after treatment with the thrombolytic agent rt-PA.
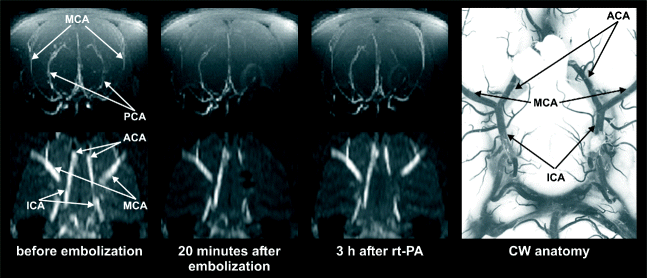

Fig. 2.
Maximum intensity projection maps of time-of-flight MR angiograms showing the architecture of perfused intracranial vessels of a Wistar rat. Upper row: Coronal projection of the whole brain. Lower row: Horizontal projection of the same data set focusing on the circle of Willis. At right: Low power photography of the circle of Willis following intravascular perfusion with latex. Angiograms were acquired before (left column) and after embolization with autologous clots (center column), and 3 h after intraarterial infusion of rtPA. Note the embolic occlusion of the right middle cerebral artery and posterior cerebral artery, followed by full thrombolytic recanalization. Reproduced from (31) with permission.
2.1.3 Perfusion-Weighted Imaging
Together with diffusion-weighted imaging (DWI; see Section 2.1.4) perfusion-weighted MR imaging (PWI) is the key imaging modality in studies of early stroke evolution, but continues to be important also during later phases of stroke evolution (see Chapter 6). While MRA depicts the patent or occluded vessel of interest, perfusion-weighted imaging demonstrates the effect of the vessel status on nutrient supply through the microvascular network to the tissue of concern. The ability to image the hemodynamic state of the brain after ischemic stroke is important, since the estimation of regional blood perfusion levels can provide critical information on the development of tissue damage.
The most widely applied MR approaches to assess cerebral microcirculation are, on the one hand, dynamic susceptibility contrast-enhanced (DSC) MRI and steady state susceptibility contrast-enhanced MRI, which measure signal changes after injection of contrast agent, and, on the other hand, arterial spin labeling (ASL) techniques, which use the arterial water as an intrinsic perfusion tracer (32).
After baseline acquisition, DSC, also called bolus track, MRI makes use of rapidly acquired MR images after an intravenous bolus injection of a paramagnetic contrast agent with T 2 and T 2 * susceptibility effects. During the passage of the contrast agent through the vasculature, T 2 and T 2 * are transiently reduced, reflected in a hypointense signal in the vessels and surrounding tissue (33). Thus, the relative loss of signal can be used to quantify cerebral blood flow (CBF) or cerebral blood volume (CBV). Quantification to convert the signal into CBF values requires determination of the arterial input function which sometimes can be difficult when large feeding arteries are not included in the image planes. Alternatively, in experimental context, the technique has been shown to be calibrated, under stable and defined conditions, by CBF autoradiography (34). This perfusion method is, however, less common in pre-clinical research, since repetition of the measurement is limited due to the required intermittent wash out of contrast agent.
The second method, arterial spin labeling (ASL), is completely noninvasive because it uses endogenous blood protons as contrast agent. This technique uses continuous inversion or saturation of inflowing arterial spins entering the region of interest (ROI) (35). In a different approach, it employs a single pulse, such as in a flow-sensitive alternating inversion recovery (FAIR) sequence, to tag spins flowing into the image plane (36). But it must, however, be noted here, that FAIR does not distinguish between arterial inflow and venous flow, but detects both contributions entering the image plane. Comparing the image of tissue perfused by labeled blood protons to the appropriate (untagged) control image results in a T 1-weighted signal difference which is proportional to the amount of inflowing protons or CBF (38, 40). This method has been used to detect differential perfusion deficits between the ischemic core and penumbral region in rats with focal ischemic stroke induced by an embolic model of MCAO (37). However, ASL is hampered by low signal-to-noise ratios. In addition, the CBF quantification requires knowledge of the apparent T 1 relaxation time, which steadily increases in the acute phase after ischemic stroke. However, recently, a multiecho continuous arterial spin labeling (CASL) sequence and T 2 of the ASL signal were used as an indicator of intra- versus extravascular ratio to incorporate, in the CBF calculations (38), an approach which may improve the accuracy of standard CBF quantification methods (39).
Steady state susceptibility contrast-enhanced MRI is another method with which tissue hemodynamics can be measured continuously (40). By employing T 2– and T 2 *-weighted MRI together with a contrast agent that is not rapidly washed out, but instead remains in the blood for a prolonged time, such as ultrasmall superparamagnetic iron oxide (USPIO) monocrystalline nanoparticles, relative CBV changes can be calculated. This technique has been used to serially measure, by gradient echo and spin echo, the total CBV and microvascular CBV in rats with unilateral MCAO (41). The authors demonstrated that between 1 and 3 h after ischemia there was a steady decrease in total CBV and, in areas destined for infarction, a progressive decline in microvascular CBV was observed. Moreover, gradient and spin echo steady state susceptibility contrast-enhanced MRI are sensitive to different sizes of blood vessels and have shown the potential to detect growth and (re-)distribution of old and newly formed vessels in ROIs (42).
Quantifications using any of the three methods face MRI-intrinsic challenges, since tissue regions with reduced blood flow also exhibit reduced signal intensity. Thus, the greater the perfusion deficit, the more compromised is the tissue perfusion detectability. Even though there are inherent methodological problems in perfusion quantifications, particular strength lies in combining PWI with other modalities such as DWI. A perfusion deficit larger than the lesion delineated by DWI, so-called PWI > DWI mismatch, is used in the clinic and clinical trials to define tissue at risk and selecting patients considered suitable for thrombolysis (43, 44). Essentially, the information given by DWI provides an estimation of tissue with irreversible damage, the core, and PWI provides an estimation of tissue with compromised tissue perfusion, reflecting possibly still reversible damage, with still normal diffusion (45).
2.1.4 Diffusion-Weighted Imaging
Rapidly after vascular occlusion, a cytotoxic edema develops due to the influx of water molecules together with calcium ions into the cells. This leads to a swelling of the cells and shrinkage of the extracellular compartment, but without change in the net water content in the tissue. MRI allows the measurement of incoherent Brownian motion, i.e., self-diffusion of molecules detectable by MR, using diffusion-weighted (DW) MRI. By employing strong magnetic gradient pulses in the rf pulse sequences, DWI can detect diffusion of water in tissue (46). Water diffusion in tissue is influenced by many factors, e.g., cell membranes acting as diffusion barriers. Therefore, the incoherent motion inside a voxel, detected by DWI, is called the apparent diffusion. Upon quantification of the effect, one speaks of the apparent diffusion coefficient (ADC).
The shift of water from extracellular to intracellular compartments occurring during the development of cytotoxic edema, results in signal intensity increase on DW MR images, which reflects a reduction in the ADC of brain tissue water (47, 48). Although the exact mechanism is not completely understood, the general assumption is that the ADC will be reduced when water moves to the intracellular compartment with more restricted diffusivity compared to the relatively unrestricted diffusion in the extracellular space (48–50).
A reduction in the tissue water ADC, and a concomitant rise in signal intensity on DWI in the rat brain, can be detected when cerebral blood flow decreases below a threshold of around 30 mL/(100 g/min) (51). This threshold is significantly higher than that required for brain vasogenic (see Section 2.2) edema, which is close to 10 mL/(100 g/min) and corresponds to the threshold of anoxic depolarization (52). Thus, DWI is a very sensitive tool for detecting the earliest steps of an ischemic event and mild ischemic changes occurring in the penumbral region by recording a gradual decrease of the tissue ADC.
Within the first 15 min following focal brain ischemia in rats, the ADC of brain water declines to around 75% of its normal value. Thereafter, the ADC value further drops to around 60% where it stabilizes in the ensuing next few hours (53). Then, at about 2 days after stroke onset, a “pseudo-normalization” of the ADC value occurs, which can be attributed to the balance of cytotoxic and subsequently developing vasogenic edema, due to an increased extracellular water content (47, 57).
Reductions in ADC can also occur without concomitant ischemia or energy depletion. Diffusion measurements are also sensitive to the abnormal release of neurotransmitters and ions, which takes place during an ischemic brain attack (54). Thus, the measurement of spreading depression-like depolarizations occurring in the ipsilateral cortex in rats subjected to stroke (55), which are accompanied by temporary cell swelling, can be detected as waves of ADC transients by using DWI (29, 30, 36, 60–62).
Whether DWI can provide any prognostic information, such as on the development of the lesion, and differentiate between reversible and irreversible tissue damage or not, remains unsure. The stroke severity is reflected in the degree of ADC decrease. Thus, a comparison of the amount of ADC decrease with breakdown of energy metabolism and with the milder event of tissue acidosis (during anaerobic glycolysis at preserved energy levels) has shown a very stable ADC threshold of 77% of normal ADC for the ischemic core and of 90% for the acidic tissue of the penumbral area (51). But complicating factors are the time for occlusion and reperfusion as well as localization of the lesion, strongly influencing absolute ADC values (56, 57). Therefore, reliable prediction of lesion progression cannot fully be made with DWI or calculated ADC maps alone (58) and whether this is possible at all with only MRI is still debated (52, 59).
2.1.5 Manganese-Enhanced Magnetic Resonance Imaging
Manganese, an essential heavy metal, is an important cofactor in a number of key enzymes in our bodies. The divalent manganese ion, Mn2+, is paramagnetic and is a particularly useful contrast agent for imaging the brain, since it causes a strong reduction of both T 1 and T 2 relaxation times of water in tissue (60) (see Chapter 28). Mn2+ can enter cells in the brain via transport mechanisms of calcium, bind intracellularly to calcium and magnesium binding sites, be transported in axonal tracts, and, in addition, be released into the synaptic cleft along with glutamate (67, 68). As a result of anoxic depolarization caused by ischemic stroke, calcium channels open and calcium and potassium enter the cells, leading to a series of events increasing the calcium influx even further. Therefore, it is expected that anoxic depolarizations will lead to enhanced influx and accumulation of Mn2+ in cells when excessive amounts of Mn2+ are present in the extracellular space (61).
Manganese-enhanced MRI (MEMRI) has been applied to detect episodes of anoxic depolarizations (62) and cortical spreading depression (63, 64). Aoki and colleagues (62) infused MnCl2 into the carotid artery of rats, permanently occluded their MCA, and recorded multislice T 1-weighted coronal images. Compared to animals in a sham group, they found that the signal intensity was markedly increased in the lateral caudate-putamen and in the lateroventral cortex (areas supplied by the MCA in rats) in animals with stroke. However, the high-intensity area on MEMRI was much smaller than both the measured DWI hyperintensity and ADC map decrease (Fig. 3). Therefore, the use of MEMRI appears to detect even earlier events in the acute ischemic phase than DWI, thus focusing on the early depolarized cells while DWI, at this early point, also will encompass all gradual increase of cytotoxic edema in cells not necessarily depolarized although hampered. Aoki and colleagues suggest that MEMRI may be a useful tool in the “super-acute” phase, to define the true ischemic core in animal models of stroke.
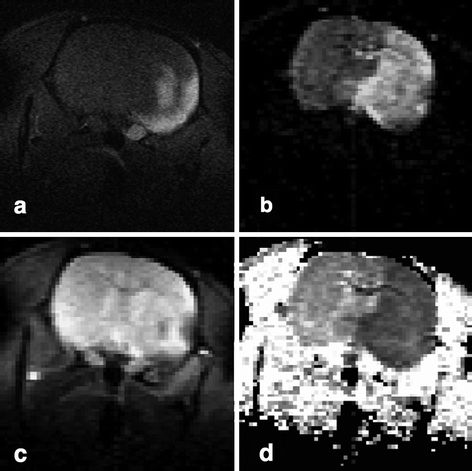

Fig. 3.
A comparison of MEMRI (a), DWI (b), T 2-weighted image (c), and ADC map (d) using the same model of experimental stroke. The lesion, localized in the lateral caudate-putamen and the lateral cortex, appears as a high-intensity area on MEMRI (a) and that area is comparatively smaller than both the DWI hyperintensity (b) and decreased ADC (d), whereas only a slight decrease in signal intensity was observed on the T 2-weighted image (c). Reproduced from Ref. (61) with permission.
One of the major drawbacks of using Mn2+ as a contrast agent is its cellular toxicity, known to produce neurological disorders, hepatic failure, and cardiac complications upon chronic exposure. On the other hand, in order to produce detectable and stable contrast, significant amount of Mn2+ is a requirement, since MR relaxation rates are proportional to the concentration of Mn2+ in the tissue. Therefore, a careful titration of Mn2+ concentration must be performed, to achieve best possible contrast without compromising safety (64) or tissue integrity, in the case of local administration (65).
2.2 The Subacute and Chronic Phases
2.2.1 Events Occurring Within Days and Weeks
Initially after a focal ischemic stroke, cells die mainly through necrosis. Subsequently, the blood–brain barrier (BBB) breaks down and plasma proteins such as albumin infiltrate the brain parenchyma, leading to vasogenic edema (74, 75). Vasogenic edema increases the tissue water content in the extracellular compartment and peaks at about 1–2 days after the ischemic event. The volume of water in the tissue is related to the extent of damage and to the degree of BBB impairment, and can lead to a dangerous compression of the midbrain, which calls for urgent craniectomy in the clinic (66). However, at 1 or 2 days following ischemic stroke, more and more cells, particularly in the boundary zones of the lesion, exhibit fragmented DNA typical for apoptosis (67). Caspases are known to be instrumental for the effectuation of apoptosis, and when activated they initiate a series of events, called programmed cell death, that will break down the cell components, shrink the cell, and, in the end, result in phagocytosis of the cell (68).
In addition, during the hours and days following an ischemic insult, the lesioned tissue will react to the insult by gene expression alterations, gliosis, and various inflammatory responses originating from either the central or the peripheral nervous system. These reactions are all highly connected with each other and will influence not only cell death and survival but also tissue reorganization and plasticity, and functional improvement.
Activation of glial cells, gliosis, occurs after many types of lesion in the brain and involves changes of morphology and gene expression, as well as increased proliferation of both astrocytes and microglia (69). Reactive astrocytes are primarily located at the border of the lesion and contribute to the formation of a gliotic scar. Microglia become activated, transform into phagocytes, and produce toxic metabolites and pro-inflammatory cytokines and chemokines such as tumor necrosis factor α (TNFα) and interleukin 1β (IL-1β). However, microglia play a dual role in brain damage by also having a positive effect on cell survival and neurogenesis, depending on the activation mechanism of microglia (70, 71).
Inflammatory mediators, e.g., TNFα and IL-1β, in combination with the enhanced expression of adhesion molecules on the vasculature, facilitate the invasion of inflammatory leukocytes from the periphery into the ischemic brain (72). Invading inflammatory leukocytes are cytotoxic, exert phagocytosis, and produce both antibodies and pro-inflammatory cytokines, all of which may cause increased cell death (69).
Functional, spontaneous recovery after ischemic stroke is frequently observed during the first weeks, but can progress during 6 months or possibly more (73). Reperfusion can explain recovery during the first days, when reversibly damaged regions are re-activated (6). Later achieved recovery is better explained by tissue reorganization and plasticity, although the mechanisms are not fully known. Intact areas close to the lesion may take over the function of the damaged areas or may be mediated by growing and sprouting of new connections during longer periods.
2.2.2 Relaxometry
The most commonly used MRI methods for observing stroke in the subacute and chronic phases are proton density, T 1-, and T 2-weighted MRI. An increase in proton density and in T 1– and T 2-weighted images in pathologic tissue is attributed primarily to an increase in interstitial water associated with the development of vasogenic edema (74). Proton density and T 2-weighted images become hyperintense within a few hours after stroke onset in rats. Depending on stroke severity and reperfusion conditions, the hyperintensity reaches maximal value at around 24 h (75, 76). As T 1 also tends to increase early after stroke onset (but only mildly compared to the increase in T 2), this will lead to a slight hypointensity in T 1-weighted images. The contrast between ischemic lesion and normal tissue is, however, only weak on T 1-weighted images. The varying relaxation-dependent contrast situation of T 1-, T 2-, and T 2 *-weighting, together with the BBB tracer dimegluminegadopentetate (Gd-DTPA) (see below) is depicted in Fig. 4.
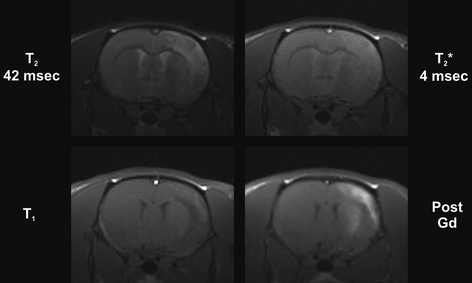

Fig. 4.
Relaxation-weighted imaging of MCAO in the rat. In coronal images during the chronic period, six days after stroke induction, the hyperintensity on the T 2-weighted image (top left) indicates the spread of the vasogenic edema and the beginning cystic transformation. This is also well reflected in the T 2 *-weighted image (top right), while there is very little contrast noticeable on the native T 1-weighted image (bottom left). After systemic Gd-DTPA injection, the hyperintensity of the T 1-weighted image allows detection of a disturbed BBB, generated by the leakage of the contrast agent from the vascular compartment into the parenchyma (reproduction courtesy of Tracy D. Farr, Cologne, unpublished).
Due to its sensitivity, T 2-weighted MRI is extensively applied in both clinical and experimental studies to delineate lesions and, thus, estimate lesion size or infarct volume. Within the first days after stroke, T 2 can be used to detect edema and edema-related anatomical changes, such as ventricular compression and midline shift, and ventricular enlargement in the chronic phase. With time, the T 2-weighted signal intensity usually either stabilizes or even increases, when the damaged cells are gradually removed by macrophages and replaced by cerebrospinal fluid.
Although increase and prolongation of T 1 and T 2 are primarily associated with late and irreversible damage, early T 1 and T 2 changes have been observed in the (hyper-) acute stages of experimental ischemic stroke. By using quantitative MR relaxometry, i.e., T 1 and T 2 mapping, it is possible to detect damage earlier than previously anticipated with these parameters (56, 57, 77). In addition, Wegener and colleagues (88) could discriminate between pannecrosis and selective neuronal death in subcortical tissues after transient MCAO, based on T 2 changes over time. They compared T 2 values for animals with either cortical and subcortical or only subcortical damage. Interestingly, the T 2 values returned to normal within about 2 weeks in animals with only subcortical lesions, which was associated with selective neuronal death according to histological analysis. In the larger lesions, on the contrary, T 2 normalization was only transient, followed by secondary T 2 increase. This was related to pannecrosis and cystic transformation of the subcortical lesion. Thus, T 2 mapping can be a useful tool in both diagnosing early determined lesions and in predicting tissue fate at later stages.
Gadolinium-based compounds such as Gd-DTPA are paramagnetic contrast agents, whose dominant effect is observed on T 1 shortening. Normally, the extravasation of injected contrast agent into the parenchyma is prevented by the BBB. But after stroke, the BBB is disrupted and therefore the contrast agent can leak from the vasculature to the brain parenchyma, leading to a local signal enhancement in T 1-weigthed MRI (Fig. 4, bottom right). The use of exogenous contrast agents to achieve T 1-weighted contrast has, ever since it was first reported (78), gained widespread use for the study of BBB integrity.
T 2 * imaging also plays an important role in imaging of cerebral ischemia, in particular following the inflammatory response occurring after an ischemic insult to the brain. In order to image the inflammatory response with MRI, contrast agents that shorten longitudinal and transversal relaxation times, are applied. Superparamagnetic iron oxide (SPIO) polycrystalline nanoparticles and USPIOs use magnetite (Fe3O4) for iron core and have different hydrophilic coatings for solubility (79). Inflammatory mature leukocytes derived from and activated in the periphery, e.g., blood-borne macrophages, enter the brain via the disrupted BBB. The macrophages are phagocytotic in nature and will, thereby, take up intravenously delivered contrast agent and carry it into the leaky stroke-damaged brain for a macrophage-based contrast. This contrast will be primarily negative but can also become positive depending on the choice of sequence (80–82). However, interpretation of data must be made with caution, since erythrocyte accumulation, i.e., vessels and microbleeds, also produce similar T 2 * effects (83). Moreover, there is still an ongoing debate about the specificity of this effect and whether systemically injected contrast agent can accumulate independent of macrophage infiltration, due to a disrupted BBB or contaminated cerebrospinal fluid (81).
Stay updated, free articles. Join our Telegram channel

Full access? Get Clinical Tree


