Fig. 1
Hybridisation of two complementary DNA strands. Dotted lines depict hydrogen bonds. A adenine, C cytosine, G guanine, T thymine
In essence, a DNA microarray is an orderly arrangement of usually hundreds of thousands of distinct DNA molecules immobilised on small glass slides, silicon wafers or nylon membranes that are exposed to fluorescently-labelled mix of RNA (or cDNA—complimentary DNA—made thereof) extracted from studied biological samples (Duggan et al. 1999). By convention the immobilised DNA molecules are called the probes and the sample under investigation is the target. The sequence of nucleotides in DNA probes is specified by previous studies on human genome. Each DNA probe latches onto the RNA or cDNA that matches its sequence. If hybridisation occurs, it is signalised by fluorescence and recorded. On Fig. 2, a Genechip platform, one of the most frequently used, is shown.
Fig. 2
The Affymetrix GeneChip technology: (b) preparation of sample for GeneChip arrays; messenger RNA is extracted from the cell and converted to cDNA; it then undergoes an amplification step; each cDNA will yield 50–100 copies which are labelled; (a) and (c) after fragmenting target cRNA from the sample tissue is hybridised to microarray cDNA, the probes immobilised on the chip are multiple short oligonucleotides which are complementary to the fragments of gene sequence located at the 3′ end of the gene; (d) the location of various probes is dispersed on the slide to, after hybridisation the chip is scanned (mean fluorescent intensity is a fit mean gene expression)
According to the length of DNA fragments spotted, all gene expression arrays can be subdivided into two groups as probes: (Bacher et al. 2009) cDNA microarrays that use approximately 200- to 500-bp double-stranded DNA fragments, which are normally produced by PCR; and oligonucleotide microarrays that use 25–70 bp of single stranded DNA. The latter provide more standardised results and, in most applications, have replaced the cDNA-based analyses. Readers interested in more detailed information and comparison of platforms are referred to numerous review articles and books (Pollack 2009; Bilitewski 2009).
The information yield by an individual microarray study is huge and this is then multiplied by the number of analyses necessary to draw biologically valid conclusions (depending on goal, this number is in the range of 10–100). For clinically usable information even more studies are necessary (in the range of 50–500). Taking into account that one study yields huge amounts of raw data, the necessity of bioinformatical approach becomes obvious, while classical statistical analysis is insufficient.
The bioinformatical analysis is performed on various levels. First, quality assurance and normalisation of the data is a very crucial step, followed by evaluation of data by means of various methods. Commercially provided software gives only preliminary results, which constitute only the first step before the deeper evaluation. Monte Carlo based calculations are often used at this step which makes the microarray analysis close to the image analysis, used in nuclear medicine. When significantly changed gene sets are identified, gene annotation studies and ontological linkages are being performed.
Gene expression data analysis can be divided into two approaches: unsupervised and supervised methods (Armstrong and van de Wiel 2004). Supervised analysis techniques are used for identifying differentially expressed genes between groups of tumour samples; for example, where histopathology (e.g. papillary or follicular thyroid cancer) or clinical outcome (e.g. survival, recurrence, etc.) is known. Gene sets, designated as gene expression signatures or profiles, are in this way generated from a set of “training samples” for disease classification or outcome prediction. Then the significance of the identified expression profile has to be tested using independent sample sets (validation sets). The alternative approach, the unsupervised analysis, aims at identifying similarly regulated genes across specimens examined without supplying the biological or clinical information on their origin. This method is also suited for finding novel relationships between samples (or genes) based on similarities in their gene expression patterns. The unsupervised analysis, applied to group genes with similar expression profiles across the tumour samples analyzed, can identify in this way possible covarying and/or functionally related genes. With this approach one can: (1) depict new tumour classification or subclassification; (2) identify potentially important genes characterising tumour; (3) identify new drug targets to provide new therapeutic tools and (4) identify biomarkers for establishing or confirming diagnosis and outcome of therapy.
4 Differences in Gene Expression Profile Between Normal and Neoplastic Thyroid
The thyroid follicular cells give rise to a variety of malignant tumours that differ markedly in their morphology, biological and clinical behaviour. Contrary to most other cancers, both papillary and follicular thyroid cancers, despite being malignant, retain many properties of their cells of origin. While the nuclear features of papillary cancer are rather characteristic, it can be sometimes very challenging to distinguish between malignant and benign follicular tumours due to their morphological resemblance. Histoarchitecture-based criteria play here a much more distinct role than cytological appearance. For functional similarities of papillary and follicular thyroid cancer the best example streams from nuclear medicine, as iodine transport and metabolism-related genes are expressed both in normal and malignant tissues, although in the latter case the expression is significantly impaired on different levels, so usually radioiodine uptake in malignant tissue is much lower than in normal thyroid.
Considering these morphological and functional similarities, thyroid cancer cells were expected to be ineffectively distinguished by gene expression profiling from nontransformed, normal tissue. However, the opposite has been proven, at least for papillary thyroid cancer.
4.1 Papillary Thyroid Cancer
The first microarray-based study published by Huang et al. in 2001 (Huang et al. 2001), showed very distinct difference in gene expression profile between papillary thyroid carcinoma (PTC) and normal thyroid tissue. They used microarray approach with 12,000 genes to profile eight PTCs and matching normal thyroid tissues. Fifty genes with the most distinct gene expression changes were specified. Genes of a number of categories, including thyroid metabolism (e.g. TPO (thyroid peroxidase); SLC5A5 (NIS, sodium iodide symporter), tumour suppressor genes (e.g. apoptosis regulator Bcl–2), cell adhesion (e.g. FGL–2, fibrinogen-like 2) and signal transduction (e.g. STC–1, stanniocalcin 1) had decreased expression. Decreased expression of genes specifically related to thyroid function (e.g TPO or NIS), proved that PTC, while being well-differentiated thyroid cancer, was less differentiated than normal thyroid. The list of 24 overexpressed genes included some genes already known for differential expression in PTC from single gene studies, e.g.; FN1 (fibronectin 1), MET (met proto-oncogene), or LGALS3 (galectin 3). However, in addition to already known ones, many new genes not previously associated with PTC were identified, such as CITED1 (Cbp/p300-interacting transactivator, with Glu/Asp-rich carboxy-terminal domain 1, also known as melanocyte-specific gene 1), involved in pigmented melanoma cells, which was initially believed to be melanoma specific. This later on gave an input to validate CITED1 as a marker for differential diagnosis of malignant from benign thyroid tumours (Prasad et al. 2004; Arora et al. 2009). Differences in gene expression profile between papillary PTC and normal thyroid tissue appeared very distinct and stable and were confirmed and extended by other authors (Giordano et al. 2005; Jarzab et al. 2005; Fontaine et al. 2008). As shown by a meta-analyses of PTC studies [(Griffith et al. 2006), Oczko-Wojciechowska, manuscript in preparation], the similarity between analyses was closer for studies using similar microarray platforms, but general tendencies were strong enough to be seen on various platforms. Considering gene ontology classes, genes related to cell adhesion, immune response, response to wounding and development controlling contributed the most to observed differences in gene expression. As we observed in our approach to PTC gene expression profile (Jarzab et al. 2005), a very characteristic feature of PTC was the huge prevalence of over-expressed genes, when compared with normal thyroid, while in majority of other cancers under-expressed genes, lost in cancer, prevailed.
The distinct feature of papillary thyroid cancer, indicated already by Huang et al. (Huang et al. 2001), was an over-expression of cell adhesion genes, responsible for migration and invasion of cancer cells. A large set of cell adhesion genes, mainly over-expressed, differed all PTCs not only from normal thyroids but also from follicular tumours as depicted in Fig. 3 (Handkiewicz-Junak et al. 2010).
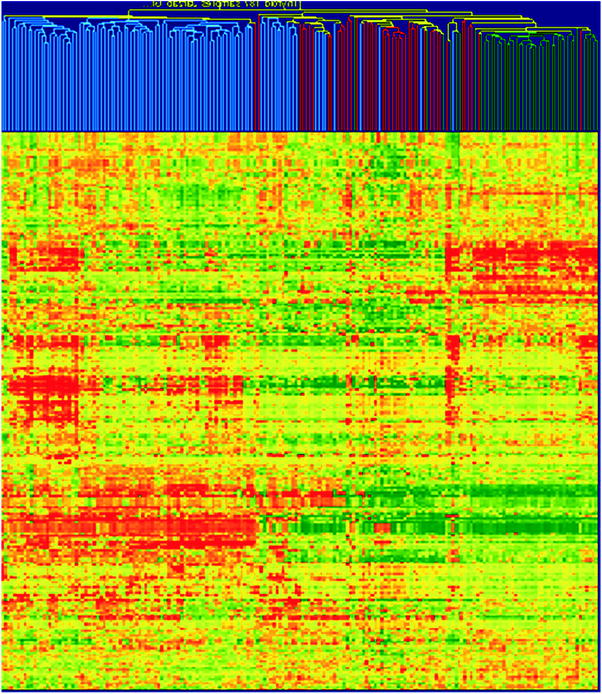
Fig. 3
Hierarchical cluster analysis based on 100 PTC and 99 FTC, follicular ademonas (FA) and non-neoplastic thyroid samples from own material (49 PTC tumours) and those published by Giordano et al. (Giordano et al. 2005) and Weber et al. (Weber et al. 2005). A large cluster of cell adhesion-related genes that are homogenously up-regulated in PTCs but down-regulated in follicular tumours and benign thyroid is clearly visible. By their expression nearly all PTCs may be separated from follicular tumours (both FTC and FA) and benign tissues. The intensity of the colour refers to the intensity of gene expression; red refers to the up-regulation, and green refers to the down-regulation. Colour coding of tissues: blue, PTC; red, follicular tumours (FTC and FA); green, benign tumours (reprinted from (Handkiewicz-Junak et al. 2010) with permission from Elsevier)
Some studies have combined morphologic or genetic subclassification with gene expression profiling data to define expression profiles that correlate with specific PTC subtypes or mutations. Using a cohort of 51 PTC tumours Giordano et al. (Giordano et al. 2005) found a good correlation between gene expression profile and morphology as there was a good separation between follicular and classical variant of PTC, however, the tall cell variant loosely grouped among classical type without clear separation. They also showed that mutational status was more highly correlated to gene expression than morphology, confirming the previous observation (Fagin 2004) of BRAF and RET/PTC mutations as dominant alternative molecular events in PTC. The distinct differences in gene profile between PTC without BRAF mutations or RET/PTC rearrangements when compared to PTC with this mutations, were confirmed by others (Durand et al. 2009). However, similarities were also obvious: it was shown that BRAF mutations and RET/PTC rearrangements resulted in similar gene expression profile and led to decreased expression of genes related to thyroid differentiation (e.g. TG, TPO, NIS, DUOX1, DUOX2), while cancers that do not harbour BRAF or RET/PTC mutations retained differentiation profile similar to normal thyroid.
4.2 Follicular Thyroid Cancer
Gene expression profiles of FTC were analyzed in several microarray studies, with the aim to improve the molecular differentiation between FTC and follicular adenomas and to elucidate the molecular etiology of FTC (Giordano et al. 2005; Cerutti et al. 2004; Lacroix et al. 2005). Different sets of genes characteristic for FTC had been established. Weber et al. (Weber et al. 2005) identified the combination of CCND2 (cyclin D2), PCSK2 (proprotein convertase subtilisin/kexin type 2), and PLAB (growth differentiation factor 15) while Cerutti et al. specified completely different set of genes which comprised DDIT3 (DNA-damage-inducible transcript 3), ARG2 (arginase, type II), ITM1 (integral membrane protein 1) and C1orf24 (family with sequence similarity 129, member A). The lack of overlap between those studies is not unexpected, as changes in expression of many genes may provide similar differential diagnosis, the lack of independent confirmation of either study is more worrying. This indicates on heterogeneity of follicular thyroid tumours.
The studies mentioned above did not consider mutation status of FTC, yet it is known from PTC studies that it can have profound effect on gene profile. Indeed, studies by Lacroix et al. (Lacroix et al. 2005) and Giordano et al. (Giordano et al. 2006) identified a highly overlapping set of genes that were preferentially expressed in FTC with PAX8/PPARgamma rearrangements. Since many of the differentially expressed genes were known PPARgamma targets, these studies gave also a new insight into FTC pathobiology indicating that PAX8/PARgamma fusion gene may function as an oncogene analogous to other fusion genes present in leukaemia and soft tissue tumours (Teixeira 2006).
4.3 Poorly Differentiated and Undifferentiated Thyroid Cancers
Cases of well-differentiated thyroid cancers (WDTC) with areas of poor or lacking differentiation, accompanied by progression in number of chromosomal abnormalities, suggest a model of progression from well-differentiated thyroid cancers to poorly differentiated or anaplastic ones (Wiseman et al. 2007). Indeed, molecular profiling showed that the MAP-kinase signalling pathway, which includes the well-known molecular lesions in WDTC, was also strongly affected in undifferentiated tumours (Montero-Conde et al. 2008). Other pathway showing important alterations was TGFbeta signalling pathway, associated with the epithelial-to-mesenchymal transition characteristic for less differentiated, advanced cancers (Grande et al. 2002). Other observations from microarray analysis also supported the hypothesis of progression from well to poorly differentiated thyroid cancers (Pita et al. 2009), suggesting that poorly differentiated cancers had expression profile closer to PTC, especially its follicular variant, than to FTC. The group of Santoro, by analysis of gene expression profile of anaplastic cancer, indicated on new potential molecular targets useful for therapy, among them POLO kinase (Nappi et al. 2009).
4.4 Gene Expression Profile of Cold and Hot Thyroid Nodules
Although molecular etiology of autonomously functioning/hot thyroid nodules (AFTNs) is quite well established with activating TSH receptor observed in more than 60 % of cases, the molecular cause of cold thyroid nodules (CTNs), their benign, functional inactive counterparts is so far largely unknown. Also the data about altered signal transduction or changed expression of oncogenes, tumour suppressors or signalling molecules in thyroid nodules are rather scarce.
Recently a 20 genes set was identified for AFTNs has been established (Fujarewicz et al. 2007). In the selected gene set, cell adhesion and extracellular matrix-related genes were found, genes belonging to the wide group of growth process/apoptosis/immune response and signalling. By comparison with PTC, the AFTNs signature was not found in any of the cancers analyzed, that confirmed the low risk of malignancy in AFTNs. In the CTN multigene classifier mainly genes related to proliferation and growth processes were significant. Contrary to AFTN, the CTN multigene signature could be observed in papillary thyroid carcinoma, which indicated that gene expression changes characteristic for benign hyperplasia have to be separated from true cancer genes by further studies.
5 DNA Microarrays in Differential Diagnosis of Thyroid Tumours
The primary goal of the evaluation of patients with nodular thyroid disease is the exclusion of thyroid malignancy. However, the identification and differentiation of rarely occurring thyroid cancer from frequently occurring benign nodular thyroid disease is a challenging task. Although, at present, fine needle aspiration cytology (FNAC) represents the most sensitive and specific tool for the differential diagnosis of thyroid malignancy, it has important limitations. First of all if FNAC reveals follicular neoplasia and the diagnosis formally expressed is a suspicious of follicular neoplasam it cannot distinguish between malignant and benign tumours. In that case surgery followed by histopathological examination is the only way to discriminate between follicular carcinoma or the follicular variant of papillary carcinoma on one side (follicular variant of medullary carcinoma is sometimes diagnosed) and follicular adenoma or even hyperplastic nodule or thyroiditis on the other. However, even histopathological examination is not always conclusive and diagnosis of “follicular tumour of uncertain malignant potential” or “well-differentiated tumour of uncertain malignant potential” is recommended for tumours with questionable features of malignancy. Therefore, molecular markers would be helpful to discriminate between malignant and benign tumours. Recently, Fontaine et al. (Fontaine et al. 2008) performed a microarray study on a group of tumours of uncertain malignancy (T-UM) with either questionable nuclear features of PTC or questionable capsular and/or vascular invasion. They generated a list of 16 predictive genes and showed that gene profile of some T-UM correlated with the profile of the PTC, suggesting that at least some T-UM were carcinomas while other were putative benign tumours. Unfortunately due to low number of FTC they were not able to generate any predictive gene list for follicular thyroid cancer. Nevertheless, the ability of a few marker genes to serve as diagnostic aid to pathological examination was shown.
PTC is regarded as very characteristic entity by pathologists, however, even then the criteria used by various teams differ (LiVolsi and Baloch 2004) and some 5–10 % of cancers constitute a diagnostic problem (Lange et al. 2006) (Lange D in press). Especially, if we consider that PTC constitutes up to 90 % of all thyroid cancers, the optimisation of its diagnosis appears necessary. This is also a challenge, although for PTC the huge number of genes with changed expression constitutes the problem, not the paucity. If the whole set of differentially expressed genes is considered, this results in list of hundreds of genes which is not acceptable for diagnostic purposes. This can be illustrated by our study on 23 PTC samples and respective benign/normal thyroids, until now the largest published one (Jarzab et al. 2005). Initially we identified 295 genes differently expressed between normal and tumour tissues. Using Support Vector Machines, a Monte Carlo-based group of methods, we were the first to focus not on a set of the best genes but on the best set of genes to diagnose PTC (Jarzab et al. 2005). Applying one of the advanced mathematical methods (Recursive Feature Replacement algorithm) we reduced the number of necessary genes which constituted the best possible combination of differentiating genes. The heat-map shown on Fig. 4 contains mainly over-expressed genes (among 19 genes constituting the optimal PTC classifier there are only 3 under-expressed). The careful inspection of changes in expression of particular genes included into the classifier shows that there are only a few with uniform change in expression. In fact inclusion of many genes stably over-expressed in PTC would give a redundant information. This information is provided by dipeptidylpeptidase, DPP4 and cadherin 3, CDH3 as well as SERPINA1 expression but only DPP4 is uniformly down-expressed in all normal tissues. The addition of other genes with their variable expression pattern helps to include all subclasses of PTC which may be correctly recognised by the multigene classifier. With this gene set, the sensitivity of PTC detection was 85.7 % and the specificity was 100 %.
 (Yttrium-90 Microspheres) for Metastatic Hepatic Malignancies
 Thyroid Carcinoma
 of Progressive Dedifferentiated and Medullary Thyroid Cancer with Radiolabeled Somatostatin Analogs
 Bisphosphonates for Bone Pain Palliation
 Radiopharmaceuticals for PET Dosimetry Before, During, and After Endoradiotherapy
 Use of Dosimetry in the Planning of Patient Therapy


Related posts:
(Yttrium-90 Microspheres) for Metastatic Hepatic Malignancies
Thyroid Carcinoma
of Progressive Dedifferentiated and Medullary Thyroid Cancer with Radiolabeled Somatostatin Analogs
Bisphosphonates for Bone Pain Palliation
Radiopharmaceuticals for PET Dosimetry Before, During, and After Endoradiotherapy
Use of Dosimetry in the Planning of Patient Therapy
Stay updated, free articles. Join our Telegram channel
Full access? Get Clinical Tree
