Eye and Orbit
J. Levi Chazen
C. Douglas Phillips
Deborah R. Shatzkes
Eye and Orbit
The orbit lies at the intersection between the central nervous system (CNS) and the head and neck, and its pathology reflects this convergence. Diseases of the optic nerve, its sheath, and the globe relate to the underlying histologic similarity to the brain and its coverings. The remaining orbital contents are affected by many entities familiar to us from adjacent structures, including the sinonasal cavities and the salivary glands. Modern multidetector computed tomography (CT) offers superb depiction of the bony orbit and its contents with high-resolution submillimeter slice thickness. However, magnetic resonance (MR) offers improved soft tissue contrast and the ability to detect subtle enhancement, and is superior in the assessment of extension of orbital disease to the adjacent intracranial and sinonasal compartments. Very often, the two modalities are complementary.
In this chapter, modern techniques of MR imaging (MRI) of the orbit are reviewed, followed by normal anatomy of the eye and orbit, with particular attention to features that are of relevance to MRI. Following a review of ocular pathology, orbital disease is discussed within the context of a pattern-based approach. The range of ocular and orbital pathology, as depicted by high-resolution MR, is illustrated and related to pathologic and clinical findings.
Orbital MR Techniques
Constantly improving MR hardware, new pulse sequences, enhanced coil designs, and the option of scanning at 3.0 T or higher contribute to ever-improving orbital imaging. In the past, MR evaluation of the eye and orbit was best performed using surface coils placed over the orbital regions, as discussed in previous editions of this text (1). Ongoing refinements in MR technology permit excellent evaluation of the retrobulbar orbital structures with commercially available head coils. While providing superb signal-to-noise ratio (SNR) within the orbit, orbital surface coils were limited in their depth of signal penetration such that the optic chiasm and brain were not evaluated. Switching from a surface coil to a head coil mid-examination in order to image the entire visual axis would add considerably to study duration.
Clinical imaging at 3 T is now commonplace. Imaging at a higher field strength increases SNR; this can then be translated into higher spatial resolution at a given scan duration or for maintaining resolution and decreasing imaging time. However, the increased field strength brings with it several disadvantages and challenges, particularly for orbital imaging. There is increased sensitivity to magnetic field inhomogeneities and increased susceptibility artifacts at 3 T when compared to 1.5 T. Given that the orbits are surrounded by pneumatized paranasal sinuses, the resultant distortion artifacts at air–bone and air–brain interfaces are an important issue. These artifacts along the planum sphenoidale may severely limit evaluation of the intracanalicular and intracranial portions of the optic nerve (2). The artifacts worsen with frequency-selective fat suppression pulses used in conventional chemical shift selection suppression (CHESS) imaging. If parallel imaging (PI) is used, it reduces these susceptibility artifacts for an improvement in image quality, an important advantage of this technique at 3 T. PI also reduces the amount of energy deposited into the patient’s tissues, known as specific absorption rate (SAR). Maximum SAR levels are reached more quickly at 3 T than at 1.5 T, and the decreased imaging time afforded by PI keeps the SAR lower (3). Orbital images are also more susceptible to motion degradation at 3 T than at 1.5 T. One other disadvantage of high field is lengthening of the T1 relaxation time, but this is not as limiting for scanning the orbit as for the brain.
Small-diameter surface coils provide the highest-resolution images of ocular and orbital anatomy and pathology by virtue of an inherently greater SNR. This is because the receive coil (the surface coil) is closer to the area of interest than is the head coil, and unwanted patient-generated motion from areas outside the orbital region does not compromise the images. As mentioned previously, surface coils are often unnecessary when a modern high-quality phased array head coil is employed at 3 T. However, a concentric coil technique may be advantageous (4).
Even with faster and more efficient scanning techniques, MR of the orbits continues to be adversely affected by eye and lid motion (Fig. 18.1). The patient should be asked to relax
and keep the eyes open or closed but to try to avoid repeatedly shifting gaze. For shorter sequences, the patient may be asked to keep the eyes open and fix their gaze on a point within the bore of the magnet. For imaging children and claustrophobic patients, appropriate sedation is important for high-quality orbital imaging. Patients wearing eye makeup should be instructed to remove it as metallic oxides are often present in these cosmetics and cause susceptibility artifact (Fig. 18.2). These artifacts are more pronounced at 3.0 T (5).
and keep the eyes open or closed but to try to avoid repeatedly shifting gaze. For shorter sequences, the patient may be asked to keep the eyes open and fix their gaze on a point within the bore of the magnet. For imaging children and claustrophobic patients, appropriate sedation is important for high-quality orbital imaging. Patients wearing eye makeup should be instructed to remove it as metallic oxides are often present in these cosmetics and cause susceptibility artifact (Fig. 18.2). These artifacts are more pronounced at 3.0 T (5).
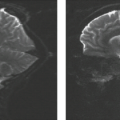
 FIGURE 18.1 Ghosting artifacts. Axial T2-weighted image shows multiple ghosting artifacts (arrows) due to movement of the eyes during scanning that degrades the image quality. |
The most abundant tissue in the orbit is fat, and differences in the resonant frequencies of protons bound to water and those bound to fat result in chemical shift misregistration, a troublesome artifact causing image degradation. The near-universal use of fast spin-echo (FSE) sequences in modern practice has resulted in some reduction in these artifacts when compared with early spin-echo (SE) imaging. Conspicuity of enhancing tumor margins and localization of inflammatory and infectious diseases with respect to the various structures of the orbit has been further enhanced by improved fat suppression techniques. The short-tau inversion recovery (STIR) sequence offers nulling of the fat signal and excellent display of structures within the fat. Contemporary fat suppression methods include Dixon techniques where in- and out-of-phase SE acquisitions are performed with (3-point) or without (2-point) a phase correction acquisition. The resultant images with pure water and pure fat signal can produce excellent T1-weighted postcontrast or T2-weighted clinical sequences (5). Dixon fat suppression techniques have improved SNR over CHESS and also result in more uniform fat suppression over the imaging volume, a significant advantage in orbital imaging (Fig. 18.3).
Diffusion-weighted imaging (DWI) of the orbit may provide helpful diagnostic information, particularly when infection is suspected (6). Apparent diffusion coefficient (ADC) values may also help differentiate benign from malignant orbital lesions (7). In particular, DWI has shown promise in distinguishing orbital lymphoma from benign lymphoproliferative lesions (8). Standard whole-brain echo-planar diffusion may suffer from significant susceptibility artifact in the orbit, limiting clinical utility. Nonecho-planar DWI appears to successfully reduce susceptibility and motion artifact at the expense of SNR. This technique has been validated in retinoblastoma detection and appears to hold widespread promise in orbital imaging (9).
A complete orbital MRI protocol should include T1-weighted and fat-suppressed (FS) T2-weighted sequences for lesion characterization, and images should be obtained in the axial and coronal planes. For optimal demonstration of optic nerve lesions, orienting the axial images slightly inferior to the orbitomeatal line will result in most of the optic nerve visualized on a single slice. The coronal plane best demonstrates the entire course of the optic nerve in cross section. Obliquely oriented sagittal images parallel to the plane of the optic nerve may also be obtained. A small field of view (FOV), on the order of 12 to 18 cm, is recommended, as well as minimal slice thickness, typically 3 mm with 10% gap (Table 18.1). Many vendors offer three-dimensional (3D) sequences with good SNR and the volume acquisition negates consideration of a slice gap. Variable matrix sizes of 192 to 512 are generally used depending on FOV and SNR. Submillimeter voxels are usually achieved. Administration of intravenous (i.v.) gadolinium-based contrast is indicated for virtually all orbital MR studies and postcontrast axial and coronal T1-weighted FS sequences are then obtained. There are several reasons for having precontrast and postcontrast images in the orbit. For most pathology, the lesion is very conspicuous against the background of hyperintense orbital fat on unenhanced T1-weighted images. A minority of lesions, including calcified, hemorrhagic, or proteinaceous abnormalities, have intrinsic T1 hyperintensity, which could be mistaken for enhancement if only postcontrast images were available. Furthermore, fat suppression may be imperfect in superficial regions like the orbit, and confusing T1 hyperintense artifacts caused by the fat suppression pulse can masquerade as enhancement (Fig. 18.4). This artifact is also problematic in the presence of ferromagnetic dental work and aerated paranasal sinuses, where fat signal suppression is difficult. Coronal orbital sequences should extend posteriorly through the optic chiasm, and axial fluid-attenuated inversion recovery (FLAIR) and/or T2-weighted images are typically obtained through the entire brain. Prior to imaging at any field strength, all patients should be questioned for the possibility of metallic material in or around the orbit. Ferromagnetic material may move in response to the magnetic field and cause injury to the eye or optic nerve. If there is uncertainty with regard to presence or composition of an orbital foreign body, a noncontrast CT study should be obtained prior to MR scanning.
Normal Anatomy
The anatomy of the orbit and its contents has been thoroughly reviewed by many authors (10,11,12). The ease of imaging in multiple planes, coupled with the high inherent contrast of intraorbital structures as visualized by MRI, makes the anatomy of the orbit ideal for evaluation by this modality.
On MR, the characteristic signal intensity of retrobulbar fat (hyperintensity on T1-weighted sequences and hypointensity on FS T2-weighted sequences) as well as the absence of signal from cortical bone and, in most cases, from flowing blood provide an excellent background for depiction of intraorbital anatomy and pathology using conventional pulse sequences. As a foundation to recognizing ocular and orbital pathologies, the normal anatomy of these regions is reviewed.
Orbital Walls and Canals
The orbits are pyramid-shaped bony compartments that contain the globes and their associated muscles, nerves, and blood vessels, as well as retrobulbar fat and the lacrimal glands (10,11). The orbital apex is directed posteriorly, and its base projects anteriorly. The four walls of the orbit separate intraorbital contents from the surrounding brain and facial structures and are seen as combinations of signal void from cortical bone and variable signal intensity from bone marrow, depending on the pulse sequence (Fig. 18.5).
TABLE 18.1 Sample High-Resolution Orbital Imaging Protocol at 3 Tesla | |||||||||||||||||||||||||||||||||||||||||||||||||||||||
|---|---|---|---|---|---|---|---|---|---|---|---|---|---|---|---|---|---|---|---|---|---|---|---|---|---|---|---|---|---|---|---|---|---|---|---|---|---|---|---|---|---|---|---|---|---|---|---|---|---|---|---|---|---|---|---|
| |||||||||||||||||||||||||||||||||||||||||||||||||||||||
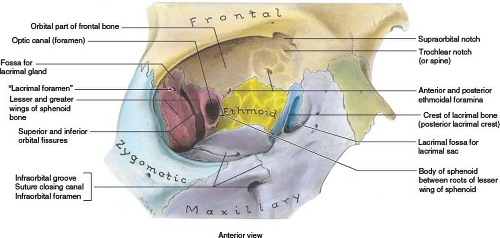 FIGURE 18.5 Bony orbital wall anatomy. (From Moore KL, Dalley AF. Clinically Oriented Anatomy. 5th ed. Baltimore, MD: Lippincott Williams & Wilkins; 2006, with permission.) |
The roof of the orbit is triangular in shape and is formed by the orbital plate of the frontal bone and lesser wing of the sphenoid bone, separating the orbit from the anterior cranial fossa. The lacrimal gland resides in the lacrimal fossa in the superolateral aspect of the orbit anteriorly. At the superomedial aspect of the orbit anteriorly is a small fossa (the trochlear pit) at the site of attachment of the cartilaginous pulley (trochlea) of the superior oblique muscle tendon. In the posterior portion of the roof of the orbit lies the optic canal, situated between the roots of the lesser wing of the sphenoid (the optic struts) and lying lateral to the body of the sphenoid bone. This canal transmits the optic nerve and its meninges, as well as the ophthalmic artery (OA) and sympathetic nerves, from the middle cranial fossa. The optic strut separates the optic canal from the superior orbital fissure. The signal void from these bony structures on MR serves to highlight the intracanalicular optic nerve and other structures coursing through the fissures and canals. Modern multidetector-row CT imaging provides exquisite bony detail of these regions (13).
The floor of the orbit comprises the maxilla but also has contributions from the zygomatic and palatine bones. The infraorbital nerve (from the second division of the fifth cranial nerve) and its accompanying artery course along the floor of the orbit in the infraorbital canal as they pass from the inferior orbital fissure to the infraorbital foramen. This nerve is clearly delineated as a soft tissue structure on coronal MR and should be sought in cases of maxillary sinus pathologic processes or trauma because it is commonly affected clinically. From the anteromedial angle of the floor of the orbit, lateral to the nasolacrimal canal, arises the inferior oblique muscle. Anteriorly, the orbital rim is in continuity with the anterior wall of the maxillary sinus below.
The lateral wall of the orbit, the thickest and strongest orbital wall, separates the orbital contents from the temporal fossa, which contains the temporalis muscle. This wall is formed by portions of zygomatic bone, frontal bone, and the greater wing of the sphenoid. Two major fissures are present in the lateral wall of the orbit. The superior orbital fissure lies between the greater and lesser sphenoid wings and is separated medially from the optic canal by the optic strut. The wider, more medial portion of the superior orbital fissure transmits the superior ophthalmic vein (SOV), cranial nerves III, IV, and VI, the ophthalmic division of V, and sympathetic nerve fibers between the orbit and the middle cranial fossa. The inferior orbital fissure connects the orbit with the infratemporal and the pterygopalatine fossa. It is between the maxilla and the palatine bone below and the greater sphenoid wing above. The inferior orbital fissure transmits the infraorbital artery, nerve, and the venous connection between the inferior ophthalmic vein and the pterygoid venous plexus.
The medial wall, the thinnest wall of the orbit, separates the ethmoid and sphenoid sinus air cells from the orbit. The largest component of the medial wall is formed by the ethmoidal orbital plate and is termed the lamina papyracea.
The orbital septum is a thin, fibrous sheath continuous with periosteum that is attached to the anterior orbital margin. It extends to the levator superioris of the upper eyelid and the tarsal plate of the lower eyelid. This structure divides the orbit into pre- and postseptal compartments and is important in limiting the spread of infection. The extensive orbital fat is delimited anteriorly by the orbital septum.
Muscles of the Globe
Six skeletal extraocular muscles insert on the sclera and control motion of the eyeball (Figs. 18.6–18.12). The four rectus muscles (superior, inferior, lateral, and medial) arise from a common tendinous ring at the orbital apex, the annulus of Zinn, and form a muscle cone that runs forward and inserts onto the front of the sclera. The superior rectus is the longest muscle, being approximately 40 mm in length, and the medial rectus has the largest diameter in the normal orbit. The medial and lateral recti lie in the same axial plane, and the superior and inferior recti lie in the same vertical plane (11). The inferior
oblique muscles insert into the posterior portion of the sclera. The superior oblique is the thinnest extraocular muscle and lies in the superomedial aspect of the orbit, coursing forward above the medial rectus muscle. Its tendon passes through the cartilaginous trochlea; turns laterally, posteriorly, and downward; and inserts into the posterolateral aspect of the sclera. The course of this muscle is well delineated by MR. The inferior oblique muscle, the only muscle to arise from the front of the orbit (11), originates from a depression in the upper surface of the maxilla, lateral to the nasolacrimal canal. This muscle passes backward and laterally, inferior to the inferior rectus, to insert into the posterolateral sclera. Its course is best seen on coronal images. The superior oblique muscle is supplied by the trochlear nerve, and the lateral rectus is supplied by the abducens nerve, whereas all other extraocular muscles are supplied by the oculomotor nerve.
oblique muscles insert into the posterior portion of the sclera. The superior oblique is the thinnest extraocular muscle and lies in the superomedial aspect of the orbit, coursing forward above the medial rectus muscle. Its tendon passes through the cartilaginous trochlea; turns laterally, posteriorly, and downward; and inserts into the posterolateral aspect of the sclera. The course of this muscle is well delineated by MR. The inferior oblique muscle, the only muscle to arise from the front of the orbit (11), originates from a depression in the upper surface of the maxilla, lateral to the nasolacrimal canal. This muscle passes backward and laterally, inferior to the inferior rectus, to insert into the posterolateral sclera. Its course is best seen on coronal images. The superior oblique muscle is supplied by the trochlear nerve, and the lateral rectus is supplied by the abducens nerve, whereas all other extraocular muscles are supplied by the oculomotor nerve.
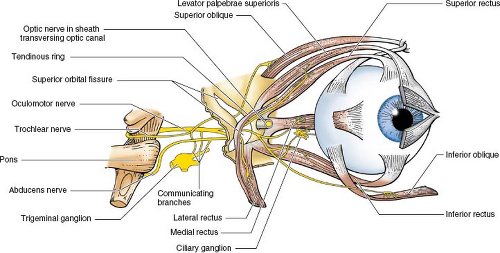 FIGURE 18.6 Orbital soft tissue anatomy. (From Moore KL, Dalley AF. Clinically Oriented Anatomy. 5th ed. Baltimore, MD: Lippincott Williams & Wilkins; 2006, with permission.) |
 FIGURE 18.7 Orbital soft tissue anatomy. (From Moore KL, Dalley AF. Clinically Oriented Anatomy. 5th ed. Baltimore, MD: Lippincott Williams & Wilkins; 2006, with permission.) |
The levator palpebrae superioris muscle lies just under the roof of the orbit, above the superior rectus muscle. It is also supplied by the oculomotor nerve and controls the upper eyelid. Below the superior rectus muscle lies the SOV, and below it lies the optic nerve, all clearly seen on coronal images.
The normal extraocular muscle has intermediate intensity on T1-weighted images and stands out as hypointense against the background of high-intensity orbital fat. It is similarly relatively hypointense on FSE T2-weighted images without fat suppression. It should be noted that normal muscles enhance significantly after i.v. contrast; this enhancement is dramatic on FS images.
Nerves of the Orbit
The optic nerve (the second cranial nerve) connects the retina with the brain and extends between the posterior globe and the optic chiasm (Figs. 18.6–18.12). Approximately 90% of its fibers are afferent (14), arising in the retinal ganglion cell layer. In the orbit, the optic nerve lies within the muscle cone and proceeds posteriorly and medially from the globe in an oblique sinuous course to gain entry into the middle cranial fossa via the optic canal and ending in the optic chiasm. The optic nerve is fully myelinated by 7 months of age, but it continues to increase in size and thickness for the first 8 years of life (15). The intracanalicular portion of the nerve enters the optic canal superior to the ophthalmic artery. The intraorbital optic nerve is surrounded by continuations of the three layers of meninges, as well as by the cerebrospinal fluid (CSF)-filled subarachnoid space. The outermost dura fuses with orbital periosteum and with the annulus of Zinn, which perhaps explains the finding of pain associated with eye movement in optic neuritis (ON) (15). The perioptic arachnoid is adherent to the pia and dura
within the optic canal except along its inferior side, which is the only site of free communication between perioptic and intracranial subarachnoid spaces (15). The optic nerve is easily distinguished from CSF in the optic nerve sheath by MR, especially on T2-weighted images, whereas with CT, intrathecal contrast administration is generally required (16).
within the optic canal except along its inferior side, which is the only site of free communication between perioptic and intracranial subarachnoid spaces (15). The optic nerve is easily distinguished from CSF in the optic nerve sheath by MR, especially on T2-weighted images, whereas with CT, intrathecal contrast administration is generally required (16).
The third cranial nerve, or oculomotor nerve, is the major motor supply for eye movements, enervating extraocular muscles except the superior oblique and lateral rectus muscles. After emerging from the midbrain just medial to the cerebral peduncle, it runs just lateral to the posterior communicating artery and then traverses the upper lateral wall of the cavernous sinus. The nerve divides into superior and inferior divisions, which pass through the superior orbital fissure and enters the muscle cone of the orbit, alongside the nasociliary nerve, a branch of the first division of the fifth nerve.
The trochlear nerve (fourth cranial nerve) is the only cranial nerve that arises from the dorsal aspect of the brainstem, emerging just below the inferior colliculus. It passes from the brainstem through the lateral wall of the cavernous and the superior orbital fissure and enters the extraconal orbit to supply the superior oblique muscle. Because of its unique intracranial course, it is commonly contused after significant head trauma.
The ophthalmic nerve (the first division of the fifth cranial nerve) is a sensory nerve that receives input from the globe and its conjunctivae, the lacrimal gland, the nose and nasal mucosa, the upper lid, frontal sinus, scalp, and forehead (10,11). Arising from
the trigeminal ganglion, it traverses the dura in the lateral aspect of the cavernous sinus to divide near the superior orbital fissure into its three branches: lacrimal, frontal, and nasociliary. These small branches subsequently pass through the superior orbital fissure into the orbit and can often be seen on T1-weighted MR images as they course through the orbital fat. The lacrimal nerve enters the orbit superior to the annulus of Zinn (a tendinous ring from which the rectus muscles arise) and proceeds along the lateral aspect of the extraconal space (with the lacrimal artery), above the superior border of the lateral rectus muscle, to give branches to the lacrimal gland, upper eyelid, and conjunctiva. The frontal nerve is also extraconal in location and courses anteriorly on the levator palpebrae superioris muscle (superior to the superior rectus muscle). The nasociliary nerve—the sensory nerve for the globe—enters the orbit via the superior orbital fissure to its intraconal location, between the two divisions of the oculomotor nerve. It runs anteriorly under the superior rectus muscle and courses medially to lie between the superior oblique and the medial rectus muscles. The nasociliary nerve forms part of the afferent limb of the corneal reflex (11).
the trigeminal ganglion, it traverses the dura in the lateral aspect of the cavernous sinus to divide near the superior orbital fissure into its three branches: lacrimal, frontal, and nasociliary. These small branches subsequently pass through the superior orbital fissure into the orbit and can often be seen on T1-weighted MR images as they course through the orbital fat. The lacrimal nerve enters the orbit superior to the annulus of Zinn (a tendinous ring from which the rectus muscles arise) and proceeds along the lateral aspect of the extraconal space (with the lacrimal artery), above the superior border of the lateral rectus muscle, to give branches to the lacrimal gland, upper eyelid, and conjunctiva. The frontal nerve is also extraconal in location and courses anteriorly on the levator palpebrae superioris muscle (superior to the superior rectus muscle). The nasociliary nerve—the sensory nerve for the globe—enters the orbit via the superior orbital fissure to its intraconal location, between the two divisions of the oculomotor nerve. It runs anteriorly under the superior rectus muscle and courses medially to lie between the superior oblique and the medial rectus muscles. The nasociliary nerve forms part of the afferent limb of the corneal reflex (11).
The abducens nerve is the sixth cranial nerve and supplies only the lateral rectus muscle. Exiting the pontomedullary junction, it traverses the central aspect of the cavernous sinus just below the internal carotid artery. After passing through the superior orbital fissure and into the intraconal orbit, it enters the medial aspect of the lateral rectus muscle.
Vessels of the Orbit
Vascular structures containing flowing blood emit variable signal intensities on MR, depending on the pulse sequence parameters, the velocity of the flow, and physical properties of the state of flow (i.e., laminar, turbulent, etc.) (Figs. 18.8–18.11). In the orbital vessels detected by MR, relevant normal flow phenomena (17,18,19) include (a) signal void, identified on most SE pulse sequences when flow is rapid or sufficiently complex (e.g., turbulent); (b) flow-related enhancement, seen as high intensity in patent but relatively slow flow states, at entry level slices (i.e., at one end of a stack of acquired slices), or on gradient-echo images (20); and (c) second-echo rephasing (17), identified as high signal intensity within patent but again relatively slowly flowing systems whereby early echo images demonstrate low (or absent) signal and delayed second-echo images show a marked increase in signal.
The OA is the first major branch of the internal carotid artery (ICA) and the chief artery of the orbit. In the vast majority of individuals, it arises from the anteromedial aspect of the ICA just distal to the point where the artery has penetrated the dura. It passes anterolaterally through the optic canal, below the optic nerve. Once within the orbit, it crosses over or under the optic nerve and proceeds medially. Within the orbit it gives off numerous branches, supplying the retina, ciliary body, extraocular muscles, lacrimal glands, and ethmoid sinus, among other structures (21). It is usually visible on thin-section MR images as a very thin serpentine structure with internal signal void.
The orbit is drained by the superior and inferior ophthalmic veins. The SOV, the largest and most consistently visualized intraorbital vessel on MR images, forms at the root of the nose from the union of the supraorbital and facial veins and enters the intraconal space of the orbit to lie adjacent to the inferior aspect of the superior rectus muscle, above the optic nerve. It courses posteriorly and laterally within the muscle cone and then turns medially and enters the superior orbital fissure at the orbital apex to drain into the cavernous sinus. The diameter of the SOV varies from 2 to 3.5 mm and can change somewhat with head position or Valsalva maneuver. Asymmetry of the SOVs may be present in normal patients (22). The inferior ophthalmic vein originates as a plexus on the floor of the orbit and drains either directly or indirectly into the cavernous sinus (10,11). It is not easily seen on MR unless it is pathologically enlarged.
Lacrimal Gland
The lacrimal gland lies in the lacrimal fossa, a postseptal extraconal space in the superolateral aspect of the anterior orbit (Figs. 18.7–18.10). The gland abuts the lateral rectus and levator superioris muscles. It consists of a smaller and more superficial palpebral portion and a larger orbital portion; the palpebral portion may be visualized when the upper lid is everted. Glandular tissue may normally be somewhat heterogeneous on MR, but it is generally isointense to muscle on T1- and T2-weighted images. Note that if one uses a surface coil, the lacrimal gland, because of its proximity to the coil, may be hyperintense without true pathologic involvement, particularly when fat suppression is also used. The gland normally enhances. Tears drain medially into superior and inferior canaliculi, which empty into the lacrimal sac in a small fossa at the inferomedial margin of the orbit, usually visualized only if it is pathologically enlarged due to nasolacrimal duct obstruction or a neoplastic or inflammatory process. The nasolacrimal duct measures 2 cm in length and empties into the inferior nasal meatus (11).
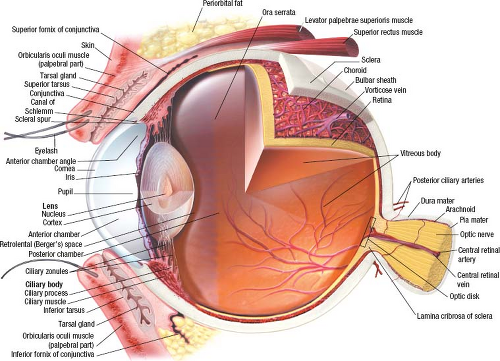
Globe
The globe is unique in that it contains both the most and the least water-laden soft tissues in the body—the vitreous and the lens, respectively (Figs. 18.8–18.14). The vitreous is 98% to 99% water, the lens is 65% to 69% water, and the cornea is 80% water; these differences alone produce highly contrasting MRI characteristics. The eye occupies approximately one-third (or less) of the volume of the orbit (11). The vitreous represents about two-thirds of the volume of the eye, approximately 4 mL, and is a gel-like, transparent extracellular matrix composed of a meshwork of 0.2% collagen fibrils interspersed with 0.2% hyaluronic acid, polymers, water, and a small amount of soluble proteins.
The wall of the globe consists of three layers. The outermost layer is a fibrous protective coat that constitutes the sclera and, anteriorly, the transparent cornea. The cornea forms the anterior one-sixth of the outer circumference of the globe. Centrally, the cornea is only 0.5 mm thick, where the anterior and posterior surfaces are parallel. While the cornea is composed of five distinct layers, the stroma (or substantia propria) forms 90% of its thickness. This layer is mainly interlacing parallel bundles of avascular collagen fibrils surrounded by mucopolysaccharide ground substance (23). The functions of the cornea are to protect the anterior segment of the eye and to be a component of the eye’s refractive system. The curvature of the cornea is stable throughout adult life in the absence of pathology, but it is significantly greater in newborns and young infants. On MRI, the cornea appears mainly as a low-intensity structure because it is fibrocollagenous and very low in mobile water proton density. The cornea is highlighted by a thin rim of slight hyperintensity on T1-weighted images, which may represent the coat of adherent tear film rather than corneal tissue itself. The rigid sclera comprises the remaining outer protective coat of the globe, merging with the cornea at the limbus anteriorly. The sclera is also mainly composed of collagen bundles, and functions to protect the globe, maintain intraocular pressure, and serve as a site of attachment for extraocular muscles (15). The outer layer of sclera is continuous posteriorly with the optic nerve dura. The sclera changes shape and thickness throughout life. During early childhood, it thickens and becomes opaque, enlarging with the growth of the eye. With a sustained increase in intraocular pressure during this time, the sclera may stretch and result in an enlarged globe. In contrast, the adult sclera is less likely to stretch diffusely, but focal thinning with ectasia can result in staphylomas or focal protrusions in areas of thinned sclera (15). In elderly patients, the sclera becomes even more rigid due to a decrease in hydration; scleral calcification can occur, commonly at sites of rectus muscle insertion (15). On MR, the sclera is similar to the cornea and other fibrocollagenous structures and is seen as a thin, low-intensity region at the periphery of the globe.
The sclera is covered by Tenon’s capsule, which is a fibroelastic membrane that envelops the eye from the optic nerve to the level of ciliary muscle. Tenon’s capsule is also called the bulbar fascia of the globe. This fibroelastic socket encloses the posterior four-fifths of the globe and separates the globe from the central orbital fat. Anteriorly, Tenon’s capsule blends with the sclera just behind the corneoscleral junction and fuses with the bulbar conjunctiva. It is perforated behind by the optic nerve and its sheath and the ciliary nerves and vessels. The inner surface of Tenon’s capsule is smooth and is separated from the outer surface of the sclera by the episcleral (Tenon’s) space. This is a potential space that is traversed by fibers of loose connective tissue, which extend between the fascia and the sclera. Orbital inflammatory and intraocular neoplastic processes (e.g., retinoblastoma, melanoma) are the most common lesions to involve Tenon’s space.
The uveal tract consists of the choroid, ciliary body, and iris, a set of structures having vascular and nutritive function. In addition to blood vessels, it contains nerves, connective tissue, and pigmented melanocytes. The vascular supply of the uveal tract includes “blood–ocular barriers,” analogous to the blood–brain barrier at several points, including the retinal pigment
epithelium (for the choroid), the retinal blood vessel endothelium (for the retina), the vessel endothelium of the iris, and the pial and retinal vessels at the optic nerve head (15). The iris is a pigmented diaphragm that separates the region between the peripheral aspects of the lens and the superficial cornea into an anterior and a posterior chamber. Both these chambers contain aqueous humor and are depicted as fluid-containing spaces on MR. The peripheral part of the iris attaches to the ciliary body. Two major parts of the ciliary body are the pars plicata, which forms the most anterior 2 mm, and the pars plana, comprising the more posterior flat portion. The main source of aqueous is the pars plicata (15). The ciliary body extends from the iris to merge with the choroid at the ora serrata, which also marks the point of tight fusion between sensory retina and retinal pigment epithelium. The ciliary body connects to the lens via the zonule, a suspensory ligament. These structures are involved in lens accommodation. The choroid extends from the ora serrata to the optic nerve head and is the major vascular and pigmented tissue of the uvea “middle coat” of the globe (15). The entire uveal tract is hyperintense on T1-weighted MR images. These structures stand out on T2-weighted images as low intensity against the hyperintense vitreous and aqueous. The retina consists of a thin outer retinal pigment epithelium layer and an innermost sensory retina, which contains neural elements for visual perception. These two retinal layers are bound tightly only at the ora serrata and at the optic disk; otherwise, they are maintained in close apposition by the intraocular pressure and weak contact points. In young patients, the vitreous is rather firmly held to the inner sensory retina, but this bonding becomes tenuous with aging. MR can routinely separate the sclera from the choroid and retina because the fibrous sclera is low intensity on T1-weighted images, in contrast to the hyperintense choroid/retina. High-resolution conventional MR can often delineate the iris and ciliary body in cooperative patients. Ultrahigh-resolution imaging (23) can separate the pars plana from the pars plicata of the ciliary apparatus. It has been hypothesized that the high intensity of portions of the choroid, iris, and ciliary apparatus on T1-weighted images is related to their pigmented (i.e., melanin-containing) epithelium. Furthermore, it has been shown by electron microscopy that the retinal pigment epithelium may contain other naturally occurring metallic (paramagnetic) ions, including iron and copper (24).
epithelium (for the choroid), the retinal blood vessel endothelium (for the retina), the vessel endothelium of the iris, and the pial and retinal vessels at the optic nerve head (15). The iris is a pigmented diaphragm that separates the region between the peripheral aspects of the lens and the superficial cornea into an anterior and a posterior chamber. Both these chambers contain aqueous humor and are depicted as fluid-containing spaces on MR. The peripheral part of the iris attaches to the ciliary body. Two major parts of the ciliary body are the pars plicata, which forms the most anterior 2 mm, and the pars plana, comprising the more posterior flat portion. The main source of aqueous is the pars plicata (15). The ciliary body extends from the iris to merge with the choroid at the ora serrata, which also marks the point of tight fusion between sensory retina and retinal pigment epithelium. The ciliary body connects to the lens via the zonule, a suspensory ligament. These structures are involved in lens accommodation. The choroid extends from the ora serrata to the optic nerve head and is the major vascular and pigmented tissue of the uvea “middle coat” of the globe (15). The entire uveal tract is hyperintense on T1-weighted MR images. These structures stand out on T2-weighted images as low intensity against the hyperintense vitreous and aqueous. The retina consists of a thin outer retinal pigment epithelium layer and an innermost sensory retina, which contains neural elements for visual perception. These two retinal layers are bound tightly only at the ora serrata and at the optic disk; otherwise, they are maintained in close apposition by the intraocular pressure and weak contact points. In young patients, the vitreous is rather firmly held to the inner sensory retina, but this bonding becomes tenuous with aging. MR can routinely separate the sclera from the choroid and retina because the fibrous sclera is low intensity on T1-weighted images, in contrast to the hyperintense choroid/retina. High-resolution conventional MR can often delineate the iris and ciliary body in cooperative patients. Ultrahigh-resolution imaging (23) can separate the pars plana from the pars plicata of the ciliary apparatus. It has been hypothesized that the high intensity of portions of the choroid, iris, and ciliary apparatus on T1-weighted images is related to their pigmented (i.e., melanin-containing) epithelium. Furthermore, it has been shown by electron microscopy that the retinal pigment epithelium may contain other naturally occurring metallic (paramagnetic) ions, including iron and copper (24).
The lens is a normally transparent, biconvex crystalline structure approximately 1 cm in greatest diameter that transmits light and separates the aqueous from the vitreous. It forms part of the posterior boundary of the anterior chamber. Zonular fibers of the suspensory ligaments hold the lens in place by attaching it to the ciliary body. During fetal development, the lens is nearly spherical in shape, but eventually it assumes an elliptical configuration because of selective growth in the equatorial diameter into adult life. The infantile lens is usually seen as a globular and spherical shape. The adult lens, measuring approximately 4 μm in thickness, consists of multiple layers of cells arranged in a concentric pattern (10). These zones are acquired in a circumferential pattern with age, and their formation may depend on periods of slow growth (25). Cells forming the adult lens nucleus grow during childhood, whereas the lens cortex surrounding the nucleus continues to develop throughout life (25). The lens cortex is surrounded by a 2- to 20-mm thick lens capsule, essentially an acellular insoluble protein-polysaccharide material. The lens itself contains approximately two-thirds water and one-third structural protein. These proteins are synthesized in the cortex and precipitate in the nuclear region (26,27). Although most lens protein is soluble, the amount of insoluble protein increases in concentric layers toward the central part of the lens (15). The development of lens opacification (i.e., cataract), although of several diverse etiologies, seems to be related more to conformational changes in protein structure than to an increase in amount of insoluble protein (15). MR appears to be able to distinguish the low-intensity lens nucleus from the external cortex, a more hyperintense structure on T1-weighted images. The lens nucleus is markedly hypointense on T2-weighted images, which is probably related to a low density of mobile water protons in combination with markedly restricted motion of water by macromolecules (i.e., lens proteins). The highly structured nature of lens proteins, which would significantly affect nearby water, is a striking example of the importance of water motion, in addition to water content, to the signal intensity on MR images (28).
Ocular Lesions
Ocular Melanoma
Malignant melanoma of the pigmented epithelium of the uveal tract (iris, ciliary body, and choroid) is the most common intraocular malignancy in adults (29). Other malignant and benign masses and masslike lesions involving the globe are listed in Table 18.2. Uveal melanomas are nearly always unilateral and are uncommon in the pediatric age group. This form of melanoma is much less frequent than the cutaneous variety, and most commonly metastasizes to the liver. The clinical presentation varies from decreased visual acuity to pain or inflammation. The typical appearance of ocular melanoma is a focal mass at the periphery of the globe extending into the vitreous, which may be polypoid, flat, or crescentic in shape. On CT, melanotic melanoma demonstrates increased attenuation. Uveal melanoma is often associated with retinal detachments, and it is difficult to distinguish the melanotic melanoma from an adjacent subretinal collection on CT due to similar densities. MR is considerably better at this distinction based on signal intensity patterns (Fig. 18.15) (30). On T2-weighted images, intracellular (early) methemoglobin is markedly hypointense, extracellular (chronic) methemoglobin is markedly hyperintense, and melanin is slightly hypointense (31) (Table 18.3). In addition, distinguishing between melanoma and an exudative or hemorrhagic retinal detachment on MR or CT is easier with i.v. contrast because the tumor enhances, whereas the adjacent hemorrhage or fluid collection does not. Tumoral enhancement is secondary to an abnormal (or absent) blood–ocular barrier, similar to the phenomenon in the brain (32). Melanotic melanoma has a shorter T1 and T2 than most other malignant ocular tumors, resulting in hyperintensity of the lesion on T1-weighted images and hypointensity on T2-weighted images (Fig. 18.16) (30). The typical T2 hypointensity of uveal melanoma is also distinct from
most other ocular tumors, which are usually T2 hyperintense. However, the degree of melanin content in melanomas is variable; approximately 31% of uveal melanomas are amelanotic or minimally pigmented (Fig. 18.17) (33). As a result, this subset of melanomas will have an MR appearance similar to other neoplasms not containing melanin.
most other ocular tumors, which are usually T2 hyperintense. However, the degree of melanin content in melanomas is variable; approximately 31% of uveal melanomas are amelanotic or minimally pigmented (Fig. 18.17) (33). As a result, this subset of melanomas will have an MR appearance similar to other neoplasms not containing melanin.
TABLE 18.2 Differential Diagnosis of Choroidal Melanoma in Adults | ||||||||
|---|---|---|---|---|---|---|---|---|
|
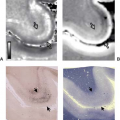
 FIGURE 18.15 Choroidal melanoma with detachment (ex vivo). A: T1-weighted magnetic resonance (MR) (400/15). B: Proton density–weighted MR (2,000/15). C: T2-weighted MR (2,000/75). Large choroidal melanoma (1) is hyperintense on T1-weighted (A) and hypointense on T2-weighted images (C) due to the presence of melanin. Note the associated hemorrhagic detachment (2). (Courtesy of J. M. Gomori, MD, Philadelphia, PA.) |
Enucleation has historically been the mainstay of treatment for primary uveal melanoma and remains the treatment of choice when there is little or no vision to save. However, studies have shown minimal difference in survical between radical and conservative treatment (34). For this reason, conservative therapies, such as radiation treatment, are typically attempted in order to preserve vision.
Ocular Metastases
In the adult patient with a malignancy, the globe is the most frequent site of metastasis to the orbit; in fact, up to 90% of orbital metastases are intraocular (35). Hematogenously disseminated metastases to the globe are usually located within the uveal tract, in concordance with its highly vascular nature. The most common sites of primary carcinoma metastatic to the eye are breast (Fig. 18.18) and lung (Fig. 18.19), but a variety of neoplasms can spread to this region. It is quite common for choroidal metastases to be accompanied by exudative or hemorrhagic retinal detachment. Distinguishing metastases to the globe from melanoma can be challenging based on signal characteristics and enhancement patterns. In a study comparing
36 patients with ocular metastases with 200 patients with uveal melanoma, morphology appeared to be the most specific differentiating factor with a placoid appearance of the lesion seen only with metastases. (Fig. 18.18) (30). A solitary lesion, retinal detachment, and larger tumor were features more commonly associated with melanoma.
36 patients with ocular metastases with 200 patients with uveal melanoma, morphology appeared to be the most specific differentiating factor with a placoid appearance of the lesion seen only with metastases. (Fig. 18.18) (30). A solitary lesion, retinal detachment, and larger tumor were features more commonly associated with melanoma.
TABLE 18.3 Signal Intensity Patterns of Melanoma Versus Hemorrhage | |||||||||||||||||||||
|---|---|---|---|---|---|---|---|---|---|---|---|---|---|---|---|---|---|---|---|---|---|
| |||||||||||||||||||||
Retinoblastoma
Retinoblastoma (Rb) is the most common intraocular malignancy of childhood and occurs in approximately 1 in 15,000 births. Although this tumor is believed to be congenital, it is not necessarily recognized at birth. The average age at diagnosis
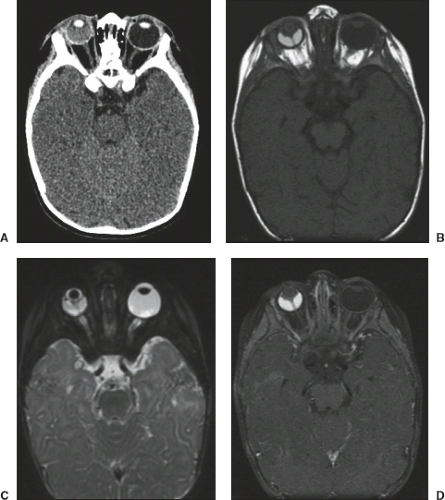
is 18 months, and the bilateral form presents earlier than the more common unilateral tumor. Rb is the most common cause of childhood leukokoria—a white, pink–white, or yellow–white pupillary reflex (Fig. 18.20), though there are multiple entities that must be considered in the differential diagnosis (Table 18.4). Rb is caused by a mutation of the Rb gene (an antioncogene) on chromosome 13q14, which may occur in heritable and nonheritable forms (36). It demonstrates two primary growth patterns. The first is endophytic, in which the tumor grows into the vitreous (Fig. 18.21) and may result in floating clumps of tumor cells, known as seeding of the vitreous (37,38). The second type is exophytic growth beneath the retina, frequently causing retinal detachment and, in advanced cases, resulting in extraocular growth into the orbit or along the optic nerve (Fig. 18.22). This pattern can result in intracranial leptomeningeal seeding of the tumor. A rare diffuse growth pattern is seen in 1% to 2% of patients and typically presents in older patients with a median age of 6 years (39). This pattern can be confused clinically with inflammation (pseudohypopyon), and the diagnosis of Rb can be consequently delayed (37). MR may show retinal detachment without a discrete mass lesion. The rare “trilateral” retinoblastoma (bilateral retinoblastoma with associated pineal tumor) is another manner in which this tumor may present (Fig. 18.23) (40).
is 18 months, and the bilateral form presents earlier than the more common unilateral tumor. Rb is the most common cause of childhood leukokoria—a white, pink–white, or yellow–white pupillary reflex (Fig. 18.20), though there are multiple entities that must be considered in the differential diagnosis (Table 18.4). Rb is caused by a mutation of the Rb gene (an antioncogene) on chromosome 13q14, which may occur in heritable and nonheritable forms (36). It demonstrates two primary growth patterns. The first is endophytic, in which the tumor grows into the vitreous (Fig. 18.21) and may result in floating clumps of tumor cells, known as seeding of the vitreous (37,38). The second type is exophytic growth beneath the retina, frequently causing retinal detachment and, in advanced cases, resulting in extraocular growth into the orbit or along the optic nerve (Fig. 18.22). This pattern can result in intracranial leptomeningeal seeding of the tumor. A rare diffuse growth pattern is seen in 1% to 2% of patients and typically presents in older patients with a median age of 6 years (39). This pattern can be confused clinically with inflammation (pseudohypopyon), and the diagnosis of Rb can be consequently delayed (37). MR may show retinal detachment without a discrete mass lesion. The rare “trilateral” retinoblastoma (bilateral retinoblastoma with associated pineal tumor) is another manner in which this tumor may present (Fig. 18.23) (40).
Retinoblastoma demonstrates hyperintense signal to the vitreous on T1-weighted images, hypointensity on T2-weighted images, and shows mild to intense enhancement on postcontrast MR images (41). Retinal detachment may be associated with Rb, as with other ocular tumors (Fig. 18.21). Rb shares histopathologic features with other primitive neuroectodermal tumors such as medulloblastoma and pineoblastoma (42), and its MR signal patterns may be similar to those of these tumors and to adult ocular melanoma (43).
TABLE 18.4 Differential Diagnosis of Leukocoria | ||||||||||||||||||||
|---|---|---|---|---|---|---|---|---|---|---|---|---|---|---|---|---|---|---|---|---|
|
FS contrast-enhanced T1-weighted images are critical in the detection of episcleral and optic nerve invasion, findings of considerable clinical importance. Mortality from Rb varies considerably with optic nerve involvement; there is a 10% mortality in isolated tumor, 15% mortality with invasion of the lamina cribrosa, and 44% mortality with frank optic nerve invasion (44). Enhancement of the anterior eye segment (AES) has been noted in many patients with Rb (38,45). This phenomenon is termed rubeosis iridis and is due to neovascularization of the iris, likely from intraocular ischemia. It has been found to significantly correlate with extension of Rb into the choroid and prelaminar segment of the optic nerve (optic disc) (38,45). The likely mechanism is believed to be central retinal vein occlusion by the Rb or associated retinal detachment causing disruption of the blood–aqueous barrier and subsequent enhancement (45,46).
Survivors of familial Rb have a genetic predisposition to the development of second neoplasms, which is enhanced by radiation therapy for the Rb (47,48,49). Most of these are sarcomas and most occur within the radiated field (Fig. 18.24); however, some may be at distant sites. In addition, an increased incidence of epithelial malignancies such as lung and bladder cancers has been reported among long-term survivors of Rb before widespread use of radiation therapy (50). These studies and many others emphasize that Rb survivors require tumor surveillance throughout life due to their increased risk of developing second neoplasms.
Persistent Hyperplastic Primary Vitreous
Virtually all developmental anomalies of the vitreous are related to a persistence of the fibrovascular components of the “primary vitreous.” The primary vitreous forms from the third to ninth gestational weeks and essentially regresses completely during the later stages of fetal life (52). The only residual structure of the primary vitreous present in the normal globe after birth may be the 1- to 2-mm-wide canal of Cloquet. It extends from the optic nerve head to a point just inferior and nasal to the posterior pole of the lens (43). Persistent hyperplastic primary vitreous (PHPV) refers to abnormal congenital persistent remnants of embryonic hyaloid vessels along this canal; it is the second most common cause of leukokoria. A fibrovascular connective tissue plaque is situated in the vitreous immediately behind and adherent to the lens and connects laterally to abnormally elongated ciliary processes (43). Fat, muscle, and cartilage have all been found in the retrolental mass (53).
The anterior aspect of the plaque may actually extend through the lens capsule and distort the lens morphology. The lens may also show cataractous change or be replaced by fatty tissue (43). From the posterior aspect of the retrolental mass of tissue, the hyaloid artery and linear connective tissue are often found extending all the way to the optic disk. In advanced forms of PHPV, the globe is commonly microphthalmic. The abnormally shaped lens and iris are shifted anteriorly with narrowing of the anterior chamber.
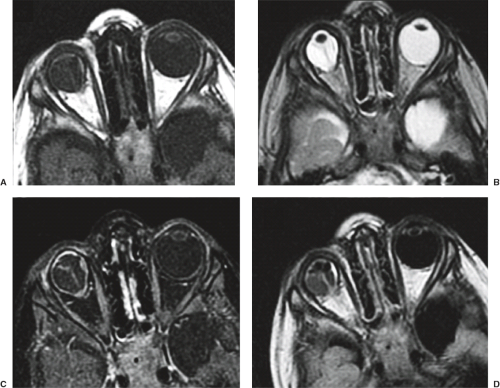
The classically described hyaloid vasculature remnants are seen on MR as linear, low-intensity structures extending directly from the posterior part of the lens/plaque complex all the way to the optic nerve head (54) (Fig. 18.25–18.27). The vitreous is often high intensity on T1-weighted images because of associated hemorrhage within retrolental vitreal membranes, subretinal space, and subhyaloid space. Because the retrolental mass is highly vascular, it demonstrates contrast enhancement. The lens is typically dysmorphic; if a normal lens is seen in the presence of a retrolental mass, another entity, such as retinopathy of prematurity or the rare ciliary body medullopithelioma, should be considered.
Coats Disease
This nonhereditary congenital benign entity consists of unilateral retinal telangiectasia with an associated massive subretinal exudative fluid accumulation causing retinal detachment (43). Boys (80%) aged 6 to 8 years are typically affected. The lipoproteinaceous effusion appears hyperintense on T1- and T2-weighted sequences (Fig. 18.28). The entire globe is abnormal in signal intensity once the retinal detachment is complete. MR spectroscopy (MRS) will reveal a lipoproteinaceous peak between 1 and 1.6 ppm (55). The low-intensity leaves of the retina, apposed in the midline secondary to the massive subretinal effusions, may simulate the linear, low-intensity hyaloid vasculature remnants seen in PHPV, as described earlier. However, the normal morphology of the lens, the failure to identify the retrolental mass, and the normal shape and size of the globe in Coats disease should distinguish this entity radiologically from PHPV.
Choroidal and Retinal Vascular Tumors
Vascular tumors of the choroid are very rare benign lesions, the most common of which, the choroidal hemangioma, is more consistent histologically with a hemartoma or malformation than a true neoplasm (56). Untreated lesions typically do not enlarge but may result in visual loss by progressive retinal detachment (57). There are circumscribed and diffuse variants, the latter typically diagnosed in infancy and associated with Sturge–Weber syndrome (Fig. 18.30) (58). The circumscribed variants occur sporadically and are typically diagnosed between the second and fourth decades; these lesions may be mistaken both clinically and radiographically for choroidal melanoma or metastases (Fig. 18.30) (59).
Retinal hemangioblastomas, previously referred to as retinal angiomas, are benign vascular retinal neoplasms, histologically similar to the cerebellar hemangioblastoma (60). When associated with von Hippel–Lindau (VHL), they typically present at about 20 years of age but may occur sporadically later in life. Multiple retinal hemangioblastomas are pathognomonic for VHL although up to 50% of patients with isolated lesions will also have VHL. Although considered hamartomatous in nature, these lesions can enlarge. Furthermore, their propensities to bleed and cause exudative retinal detachments often result in abrupt symptomatology. When small they may be difficult to visualize on MRI, but larger lesions may appear minimally
hyperintense on T1-weighted images, similar to melanotic melanoma. All choroidal and retinal vascular lesions demonstrate intense contrast enhancement.
hyperintense on T1-weighted images, similar to melanotic melanoma. All choroidal and retinal vascular lesions demonstrate intense contrast enhancement.
Miscellaneous Retinal Lesions
Another rare enhancing ocular lesion is the retinal astrocytoma, an entity seen almost exclusively in the setting of tuberous sclerosis or neurofibromatosis type 1 (NF1) (Fig. 18.31). These lesions may calcify and thus be difficult to distinguish from Rb; however, they are typically limited to the optic disk and generally lack hemorrhage or necrosis (51). Papillitis reflects focal swelling of the optic disc. It typically occurs in children and is described most frequently in the setting of multiple sclerosis (MS) (Fig. 18.32) (61). Papilledema may be seen with increased intracranial pressure from a variety of causes, and is typically a bilateral process, unlike papillitis (Fig. 18.33) (62).
Retinal and Choroidal Detachment
The retina is composed grossly of sensory and retinal pigment epithelium layers. These two components are only firmly attached at two points: the optic disk posteriorly and the ora serrata anteriorly (43). The entire course of the delicate sensory retina is otherwise only weakly and tentatively apposed to the
retinal pigment epithelium by intraocular pressure, microscopic villi, and mucopolysaccharide substance (43).
retinal pigment epithelium by intraocular pressure, microscopic villi, and mucopolysaccharide substance (43).
There are three potential spaces in the eye where fluid may accumulate, resulting in detachment of the various coats of the globe. The first is the posterior hyaloid space, between the base (posterior hyaloid membrane) of the hyaloid and the sensory retina. Separation of the posterior hyaloid membrane from the sensory retina is referred to as posterior hyaloid detachment. The second is the subretinal space, between the sensory retina and the retinal pigment epithelium; separation of the sensory retina from the retinal pigment epithelium is referred to as retinal detachment. The third is the suprachoroidal space, between the choroid and the sclera. The retinal pigment epithelium and Bruch membrane (the basal membrane of the choroid) are tightly adherent to the choroid and become separated only when both layers are torn, but the choroid is only loosely attached to the sclera and can be separated, resulting in a choroidal detachment. Choroidal detachment implies separation of sclera from subjacent choroid (or ciliary body, hence the term “ciliochoroidal detachment”). Note that in the strict sense, the term “retinal detachment” implies separation of retinal pigment epithelium from the Bruch membrane of the choroid. It is generally stated, however, that when the pigmented epithelial layer of the retina is separated from the
sensory retina by fluid accumulation, a retinal detachment results. Retinal detachments are due to fluid in the subretinal space; ciliochoroidal detachments show collections in the suprachoroidal space.
sensory retina by fluid accumulation, a retinal detachment results. Retinal detachments are due to fluid in the subretinal space; ciliochoroidal detachments show collections in the suprachoroidal space.
Retinal detachments are classified as rhegmatogenous, serous or exudative, or tractional. Most detachments are rhegmatogenous and are secondary to a rhegma (“rent”) in the sensory retina leading to accumulation of subretinal fluid (63). A tractional retinal detachment occurs secondary to vitreal degeneration and retraction of the retina from condensation and fibrosis of the underlying vitreous. Tractional retinal detachments are most frequently seen in the setting of diabetic retinopathy. Serous or exudative retinal detachments are caused by subretinal fluid accumulation leaking from abnormal small
vessels, frequently secondary to neoplastic disease (melanoma, metastases, hemangioma, or retinoblastoma), Coats disease, or inflammation (Figs. 18.27 and 18.28).
vessels, frequently secondary to neoplastic disease (melanoma, metastases, hemangioma, or retinoblastoma), Coats disease, or inflammation (Figs. 18.27 and 18.28).
 FIGURE 18.32 Papillitis. Axial postcontrast fat-suppressed T1-weighted image showing asymmetric enhancement of the left optic nerve head (arrow). |
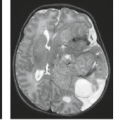
 FIGURE 18.33 Papilledema. Axial T2-weighted image showing prominence of the optic nerve head bilaterally, more pronounced on the left. |
Spontaneous detachments are said to occur in less than 10 per 100,000 per year (64), most commonly between the ages of 40 and 80. Patients are predisposed to retinal detachment if they have severe axial myopia, surgical aphakia (lens absence), or a history of contralateral retinal detachment. Gradual vision loss is a common clinical presentation; if untreated, more than half of patients will lose vision entirely (63). Treatment is focused on reapposition of the sensory retina to the underlying pigmented epithelial layer and preventing re-opening of the tear (retinopexy). Surgical options include retinopexy, scleral buckling (Fig. 18.34), and pars plana vitrectomy. Temporary tamponade may also be obtained with intraocular gas or silicone oil (Fig. 18.35) (63).
Ciliochoroidal detachments can be due to either serous effusions or hemorrhagic collections. Hemorrhagic choroidal detachment, or choroidal hematoma, is usually related to trauma or surgical intervention (Fig. 18.36). Ciliochoroidal serous effusions are commonly secondary to trauma, especially vitreous surgery, and inflammation (15). In most ciliochoroidal effusions, ocular hypotony is present and, in fact, is believed to represent a significant contributing factor to the development of the effusion itself (15). Ocular hypotony
may be the result of inflammatory diseases, accidental perforation of the eyeball, ocular surgery, or intensive glaucoma therapy. Clinically, the choroidal detachment appears as a smooth, gray–brown elevation of the choroid extending from the ciliary body to the posterior segment. It is difficult with ophthalmoscopy to distinguish a serous from a hemorrhagic choroidal detachment.
may be the result of inflammatory diseases, accidental perforation of the eyeball, ocular surgery, or intensive glaucoma therapy. Clinically, the choroidal detachment appears as a smooth, gray–brown elevation of the choroid extending from the ciliary body to the posterior segment. It is difficult with ophthalmoscopy to distinguish a serous from a hemorrhagic choroidal detachment.
Practically speaking, funduscopic examination can easily detect retinal detachments, so the essential role of MR is to exclude unsuspected neoplasm, such as choroidal melanoma (see earlier section), and i.v. contrast should be administered in all such cases. The MR appearance of retinal and ciliochoroidal detachments varies depending on the amount of hemorrhage or protein in the subretinal or suprachoroidal fluid (Fig. 18.37). It may not always be possible to differentiate retinal from choroidal detachments on MRI; however, some distinguishing features may be present. Ciliochoroidal detachments, frequently extend anteriorly into the ciliary body, are parallel to each other when occurring both on the nasal and temporal aspects of the globe, and are somewhat limited in spreading posteriorly by insertions of the vortex veins supplying the choroid. Retinal detachments characteristically are limited anteriorly at the ora serrata (Figs. 18.36 and 18.38) and may have a V shape, with the apex of the V at the optic nerve head (Figs. 18.36 and 18.39) (65). Nonhemorrhagic retinal detachments should appear as typical fluid intensity, but marked elevation of protein content may shorten the relaxation time (66,67). In fact, MR has been reported to be able to distinguish subretinal collections of varying protein content because of this differential relaxation time shortening (67). Therefore, even nonhemorrhagic collections may occasionally be more intense than normal vitreous on certain pulse sequences. Okabe et al. (66) correlated the appearance on MR of rhegmatogenous and nonrhegmatogenous collections to their protein content. Short T1 and T2 are seen in chronic rhegmatogenous and nonrhegmatogenous effusions, being present in those lesions with markedly elevated protein concentrations, in contrast to recently acquired rhegmatogenous detachments that contained low protein. As described earlier, the appearance of hemorrhage varies with its evolutionary stage and environment.
Globe Shape Abnormalities
Axial myopia is characterized by elongation of the globe in the anteroposterior dimension. The shape of the globe is smooth, without any focal bulge. A staphyloma is an acquired defect in the globe wall resulting in focal protrusion of a thinned cornea or sclera, usually posterotemporal to the disk (Fig. 18.40).
Staphylomas are lined with iris or choroidal tissue. Retinal detachment and/or staphyloma commonly accompany a severely myopic globe (Table 18.5) (68).
Staphylomas are lined with iris or choroidal tissue. Retinal detachment and/or staphyloma commonly accompany a severely myopic globe (Table 18.5) (68).
Colobomas (Fig. 18.41) are congenital defects in the retina, choroid, iris, lens, and/or optic nerve situated inferonasally and are often seen as excavations into the optic nerve head that result from failure of closure of the fetal optic fissure (15). These lesions are bilateral in up to 60% of cases. Colobomas are transmitted as an autosomal dominant trait with variable penetrance. The utility of MRI in the workup of these lesions lies in its ability to reveal any additional associated CNS anomalies that are frequently seen with colobomatous lesions, such as encephalocele or callosal agenesis and its spectrum of concurrent malformations (69,70).
Microphthalmia is classified as either simple or complex, depending on whether the small eye is anatomically intact or is malformed (71). Microphthalmos and retinal cysts may occur in conjunction with coloboma (colobomatous cyst) and are clearly detected with MR (72). If a colobomatous cyst is present, the cyst lies inferior to the site of exit of the nerve from the globe and is often the cause of superior displacement and proptosis of a microphthalmic eye (15). The major differential diagnoses in that case are meningocele and congenitally cystic globe. Coloboma may also occur in association with choristoma, a malformation composed of heterotopic mesodermal elements usually within or adjacent to the coloboma (15). Microphthalmia may also occur secondary to intrauterine infection or as an isolated anomaly, in which case it is often bilateral.
Macrophthalmos (buphthalmos), or congenital glaucoma, is a result of maldevelopment of the outflow channels in the anterior chamber angle causing increased intraocular pressure. Glaucoma in a young child results in an enlarged globe due to distensibility of the sclera. Buphthalmos (Fig. 18.42) may be unrelated to intraocular pressure, however, and may be seen as an isolated entity, secondary to massive intraocular tumor, or in association with neurofibromatosis type 1.
Marfan syndrome is a common cause of ectopica lentis which may manifest with subtle lens subluxation or complete bilateral lens dislocation; bilateral globe enlargement is also seen (Fig. 18.43) (73).
Marfan syndrome is a common cause of ectopica lentis which may manifest with subtle lens subluxation or complete bilateral lens dislocation; bilateral globe enlargement is also seen (Fig. 18.43) (73).
 FIGURE 18.39 Hemorrhagic retinal detachment. Noncontrast computed tomography axial (A) and sagittal (B) images show the characteristic V-shaped retinal detachment. |
 FIGURE 18.41 Bilateral colobomas with retinal cysts. Axial T2-weighted image with bilateral irregular cysts in the posterior globe that are contiguous with the vitreous cavity. |
TABLE 18.5 Globe Shape Abnormalities | ||||||||||||||||||||||||
|---|---|---|---|---|---|---|---|---|---|---|---|---|---|---|---|---|---|---|---|---|---|---|---|---|
|
 FIGURE 18.42 Buphthalmos. Axial T1-weighted postcontrast image. Nonspecific enlargement of the right eye. |
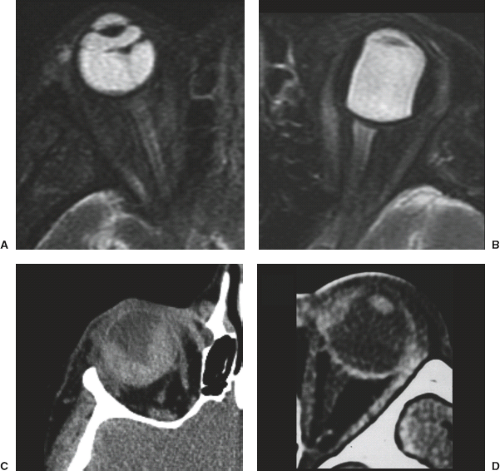
Phthisis bulbi represents an end-stage atrophic globe that has undergone extensive degenerative changes. This condition can result from any of a variety of insults, including prior inflammation and trauma. In phthisic eyes, the sclera becomes markedly thickened, irregular, and calcified. These globes are easily recognized on MR by their characteristic morphology and by their signal intensity patterns: peripheral hyperintensity on T1-weighted images and hypointensity on T2-weighted images (Fig. 18.44), reflecting iron and other paramagnetic ion deposition along with the dystrophic calcification. Finally, a characteristic distortion of globe shape is seen in patients who have had prior scleral banding procedures as treatment for retinal detachment, often in patients with high myopia (Fig. 18.34).
Ocular Trauma
CT is the first-line imaging modality in the acute presentation of ocular trauma. CT benefits from rapid acquisition, thin multiplanar reformations, and sensitivity for orbital fracture approaching 100% (74). MR shows significant benefit for characterization of ocular detachments and nonradiopaque foreign bodies including wood, which may be particularly problematic on CT. MR should not be performed if there is a chance of an intraocular metallic foreign body (e.g., bullet fragments or shrapnel) (75).
 FIGURE 18.44 Phthisis bulbi. Axial T1 (A) and T2-weighted (B) images demonstrate a shrunken left globe with an irregular peripheral rim of relative hypointensity on T2-weighted imaging. CT (C) shows the characteristic dystrophic calcification.
Stay updated, free articles. Join our Telegram channel
Full access? Get Clinical Tree
 Get Clinical Tree app for offline access

|


