Fat and Water Properties in Cardiovascular Magnetic Resonance Imaging
Mark Doyle
OVERVIEW
Fat and water signals are very important in producing contrast in cardiovascular images, allowing differential diagnosis, and identifying cardiovascular features. There are several properties that differentiate fat and water signals including the following:
Resonance frequency
These can be exploited in a number of ways in cardiovascular magnetic resonance (CMR).
T2 contrast
Bright versus dark fat and water signal
Double and triple inversion recovery (IR)
Phase sensitive IR imaging
Chemical shift imaging
T2 Contrast
In general, the echo time (TE) parameter determines the sensitivity to T2. The T2 of myocardium, 80 milliseconds, is relatively low compared to its T1, 850 milliseconds. In contrast, the T2 of fat, 110 milliseconds, is relatively long compared to its T1, 260 milliseconds. In broad terms, for cardiac imaging there are two TE regions of interest:
The decay curves describing T2 signal for myocardium and fat are such that in the short TE range very little differentiation is realized (the signal decays in each material by approximately 10% for the TE range 0 to 30 milliseconds) (see Fig. 23-1). Further, in the long TE range, although modest differentiation is achieved (fat being approximately 50% brighter), further differentiation based solely on T2 weighting is not easily achieved.
T2 and Gradient Echo
In general, gradient echo sequences are designed to be sensitive to flow. For this reason the lowest TE is generally the best choice, because it maximizes the sensitivity to flow. In this case, fat and water signals are not strongly differentiated on the basis of T2, but are more influenced by T1 relaxation. Disruption of the blood flow signal is not strongly influenced by T2, but T2* is increased in the presence of turbulence. Effectively, T2* decreases with increasing turbulence and in regions of increasing velocity gradients. Therefore, turbulent and accelerating flow may appear as low signal regions.
T2 and Spin Echo
The spin echo sequence is predominantly used in the fast spin echo mode: A series of echoes are acquired to produce a segmented scans. In the fast spin echo sequence, TE times can be relatively long, and fat appears brighter than water. However, there is not much further differentiation due to TE in the range 150 to 300 milliseconds.
FAT, WATER, AND FREQUENCY
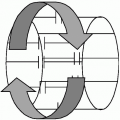
Fat and water each contribute a strong signal in the proton resonance. The fat resonance frequency is 1.5 parts per million (ppm) separated from water. At 1.5 T, this evaluates to 224 Hz (i.e., 64 MHz × 1.5 ppm). When the scanner frequency is set to resonate at the water frequency, water is always the “in-phase signal,” (see Fig. 23-2). This is accomplished
by setting the resonance frequency of the system to 64 MHz (for 1.5 T systems). The scanner detects this frequency as a uniform signal because it compares each signal against this reference frequency. This type of detection is said to take place in the “rotating reference frame,” that is, by comparing the detected signal frequency against an internal reference frequency, the detector is effectively rotating in synchronization with the reference frequency. Another term for this is phase-sensitive detection (PSD). At 1.5 T, the reference frequency of water is 64 MHz. As the water and fat resonances are separated slightly in frequency they produce a beat pattern as they drift in and out of phase. This leads to distinct “out-of-phase” and “in-phase” times of 1.8 milliseconds, and 4.2 milliseconds, respectively. Tissue that is composed of a combination of fat and water can be imaged to appear as:
by setting the resonance frequency of the system to 64 MHz (for 1.5 T systems). The scanner detects this frequency as a uniform signal because it compares each signal against this reference frequency. This type of detection is said to take place in the “rotating reference frame,” that is, by comparing the detected signal frequency against an internal reference frequency, the detector is effectively rotating in synchronization with the reference frequency. Another term for this is phase-sensitive detection (PSD). At 1.5 T, the reference frequency of water is 64 MHz. As the water and fat resonances are separated slightly in frequency they produce a beat pattern as they drift in and out of phase. This leads to distinct “out-of-phase” and “in-phase” times of 1.8 milliseconds, and 4.2 milliseconds, respectively. Tissue that is composed of a combination of fat and water can be imaged to appear as:
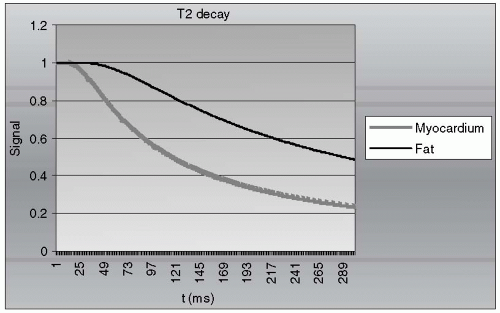 FIGURE 23-1 T2 decay of fat relative to water: over the short echo time (TE) range (0 to 30 milliseconds) fat and water signals decay by <10%; as time proceeds, the water signal (e.g., myocardium) decays faster than the fat signal and some appreciable fat-water contrast is generated. However, beyond 150 milliseconds, the contrast between the two tissues changes relatively slowly. |
Dark (i.e., signals are out of phase)
Bright (i.e., signals are in phase)
This is most appropriate for gradient echo imaging.
T1 Differentiation for Fat and Water
The T1 values for fat and water are quite distinct:
Water 850 milliseconds
Fat 150 to 300 milliseconds
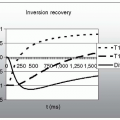
Because the T1s are distinctly different, IR can be used to generate dramatic contrast. In a single IR sequence, all spins (fat and water) are inverted by
application of a 180-degree radiofrequency (RF) pulse (see Fig. 23-3


application of a 180-degree radiofrequency (RF) pulse (see Fig. 23-3
Stay updated, free articles. Join our Telegram channel

Full access? Get Clinical Tree


