In 2004, Souka et al. [6] published on the feasibility of examining cardiac and non-cardiac fetal anatomy in 1144 low-risk women between 11 and 14 weeks. The scan was performed using both transabdominal sonography (TAS) as well as TVS imaging the following anatomical structures: skull, brain, face, spine, four-chamber and three-vessel views of the heart, stomach, abdominal wall, kidneys, bladder, and extremities. The results revealed that a complete anatomy scan was possible in 48 % of the fetuses. Non-cardiac anatomy was successfully imaged in 86 % of the fetuses. The use of TVS increased the successful examination of fetal anatomy from 72 to 86 % of the fetuses. Transvaginal scanning was particularly helpful in examining the face, kidneys and bladder (Table 19.2). Similarly, to other studies they found that as the crown-rump length increased so did the visualization rates of fetal structures.
Table 19.2
Visualization rates of non-cardiac and cardiac structures with increasing CRLa
CRL (mm) | Non-cardiac (%) | Cardiac | |
|---|---|---|---|
4 ChV (%) | 3V (%) | ||
45–54 | 65 | 67 | 25 |
55–64 | 84 | 86 | 46 |
65–74 | 93 | 93 | 58 |
>74 | 96 | 97 | 67 |
In 2004, Timor-Tritsch et al. [7] tested the ability of a group of American sonographers to successfully perform fetal structural evaluation 11-14 weeks. The results showed comparable detection rates to those reported by European authors. In their prospective cross-sectional study of 223 women between 11 and 13 6/7 weeks, the sonographers were asked to look for fetal structures of the head, neck, spine, heart, abdomen, chest, and extremities targeted 37 fetal structures (Table 19.3). Cases were divided by gestational age into two groups: 11–12 and 13–14 weeks. Similarly to prior studies, as the gestational age increased the number of structures seen increased as well. In this study, the heart structures had the lowest percentage rate of visualization which is not surprising since most practitioners find the fetal heart to be among the most difficult fetal structures to image. The authors concluded that anatomic survey of the fetus between 11 and 14 weeks can be performed by sonographers with good detection rates of most fetal structures.
Table 19.3
Percentage of structures seen at 11–12 and 13–14 weeks by dedicated sonographersa
Structure | 11–12 weeks | 13–14 weeks | P value |
|---|---|---|---|
n = 121 (%) | N = 102 (%) | ||
Head and neck | |||
Calvarium | 120 (99) | 100 (98) | NS |
Intracranial anatomy | 115 (95) | 97 (95) | NS |
Lateral ventricles | 109 (99) | 94 (92) | NS |
Choroid plexus | 118 (98) | 97 (95) | NS |
Cerebellum | 63 (52) | 70 (69) | 0.01 |
Posterior fossa/cisterna magna | 67 (55) | 73 (72) | 0.01 |
Nuchal anatomy | 115 (96) | 95 (93) | NS |
Lenses | 106 (88) | 91 (89) | NS |
Profile | 110 (91) | 91 (89) | NS |
Nose/lips | 86 (71) | 81 (79) | NS |
Face | 89 (74) | 85 (83) | 0.08 |
Spine | |||
Cervical | 97 (80) | 91 (89) | NS |
Thoracic | 98 (81) | 89 (87) | NS |
Lumbar | 87 (72) | 79 (77) | NS |
Sacral | 42 (35) | 49 (48) | NS |
Heart | |||
Cardiac axis | 86 (71) | 75 (73) | NS |
4-chamber view | 33 (27) | 42 (41) | 0.03 |
RVOT | 47 (39) | 59 (58) | 0.04 |
LVOT | 45 (37) | 62 (61) | 0.0004 |
Aortic arch | 22 (18) | 31 (30) | 0.03 |
Ductal arch | 18 (15) | 24 (24) | NS |
Abdomen and chest | |||
Lungs | 77 (64) | 79 (77) | 0.02 |
Diaphragm | 65 (87) | 94 (92) | NS |
Ventral wall (cord insertion) | 117 (97) | 98 (96) | NS |
Stomach | 118 (98) | 100 (98) | NS |
Kidneys | 97 (80) | 93 (91) | 0.02 |
Bladder | 113 (93) | 92 (96) | NS |
2 vessels observed by the bladder | 102 (84) | 92 (90) | NS |
Bowel | 93 (77) | 90 (88) | 0.02 |
Genitalia | 39 (32) | 51 (50) | 0.007 |
Extremities | |||
Humerus | 118 (98) | 98 (96) | NS |
Radius/ulna | 115 (95) | 99 (97) | NS |
Hand | 118 (98) | 100 (98) | NS |
Fingers | 104 (86) | 92 (90) | NS |
Femur | 119 (98) | 98 (96) | NS |
Tibia/fibula | 111 (92) | 96 (94) | NS |
Foot | 117 (97) | 95 (93) | NS |
In a recent systematic review, Rossi et al. [8] looked at the efficacy of ultrasound between 11 and 14 weeks in the diagnosis of fetal structural malformations. They reviewed 19 articles with 78,002 fetuses undergoing fetal anatomical survey at 11–14 weeks. There were 996 fetuses with malformation with a prevalence of 12 malformations per 1000 fetuses. The overall detection rate of anomalies in this systematic review was 51 %, with detection rates increasing to 62 % when both TAS and TVS were included. Furthermore, the detection rate increased to 65 % among those patients who were at high risk for malformations.
Which Fetal Anatomical Structures Should Be Sought in the Fetal Anatomical Survey at 11 to 13 6/7 Weeks?
Before proceeding, it is important to make one critical clinical important point to keep in mind when scanning the fetus at these gestational ages. Gestational age matters! Not all structures sought during the second trimester (18–22 weeks) scan are completely formed at 11 to 13 6/7 weeks and not all fetal structures “mature” at the same time or at the same gestational age. For example, the fetal brain develops and continually changes during embryonic/fetal life. Depending on the gestational age structures may be deemed normal or pathologic while in reality they did not yet complete their development. For example, in the first trimester a difference of 5–7 days in the gestational age may lead to misdiagnosing a normally developing ventricular structure such as the rhombencephalon as ventriculomegaly or non-visualization of the falx as holoprosencephaly. Therefore, when performing an early fetal anatomical survey, the American Institute of Ultrasound in Medicine (AIUM) [9] list of structures that constitutes a fetal anatomical scan at 18–20 weeks cannot be applied to the fetus at this early gestational age. In 2013 the International Society of Ultrasound in Obstetrics and Gynecology (ISUOG) published guidelines [10] as well as a list of suggested structures to be included in the first trimester anatomical survey (Table 19.4).
Table 19.4
Suggested anatomical assessment at time of 11 to 13 + 6-week scana
Organ/anatomical area | Present and/or normal? |
|---|---|
Head | Present |
Cranial bones | |
Midline falx | |
Choroid-plexus-filled ventricles | |
Neck | Normal appearance |
Nuchal translucency thickness (if accepted after informed consent and trained/certified operator available)b | |
Face | Eyes with lensb |
Nasal boneb | |
Normal profile/mandibleb | |
Intact lipsb | |
Spine | Vertebrae (longitudinal and axial)b |
Intact overlying skinb | |
Chest | Symmetrical lung fields |
No effusions or masses | |
Heart | Cardiac regular activity |
Four symmetrical chambersb | |
Abdomen | Stomach present in left upper quadrant |
Bladderb | |
Kidneysb | |
Abdominal wall | Normal cord insertion |
No umbilical defects | |
Extremities | Four limbs each with three segments |
Hands and feet with normal orientationb | |
Placenta | Size and texture |
Cord | Three-vessel cordb |
In this chapter we use the ISUOG list of suggested structures to be imaged at 11 to 13 6/7 weeks (see Table 19.4). Using these guidelines we present fetal anomalies that can be detected at these ages.
Head
Exencephaly–Anencephaly Sequence, Cephalocele
Anomalies that result from failure or abnormal closure of the anterior cranial neuropore at around 26–32 days post conception result in cerebral, spinal or a combined cerebral and spinal defects or dysraphia among these exencephaly–anencephaly sequence, cephaloceles, and spina bifida are among the most common defects with a reported prevalence of 1/1000 pregnancies [11].
The exencephaly–anencephaly sequence is a lethal malformation. In exencephaly the typical sonographic features is acrania in which a relatively well formed brain is seen without the covering fetal cranium (Fig. 19.1). As the pregnancy continues the exposed fetal brain begins to disintegrate eventually, resulting in the typical sonographic features of anencephaly in which the cranium is absent and the fetal orbits prominent. Increasing the US gain the amniotic fluid appears speckled as the result of the sloughing off of the exposed brain tissue (Fig. 19.2) [12]. Reported detection rates at 11 to 13 6/7 weeks are 100 % [8, 13].


Fig. 19.1
A 10 3/7 weeks fetus with exencephaly–anencephaly sequence. (a) Sagittal view: the normal fetal calvarium is not seen; instead the head appears “flat” and irregular. (b) Coronal view of the fetal head depicting significant amount of brain tissue that has “drooped” to the side of head since it is not confined by the calvarium. (c) 3D reconstruction of the fetus demonstrating exencephaly. (Arrow: abnormal head with absent calvarium.)
Fig. 19.2
Dichorionic–diamniotic (DCDA) twins at 13 1/7 weeks. (a) The amniotic fluid of twin A appears speckled compared to the amniotic fluid of twin B. (b) Further anatomic evaluation of twin A reveals the typical features of the exencephaly–anencephaly sequence; the head appears irregular and lacks the typical sonographic appearance of the smooth and regular echogenic calvarium (arrow)
Cephalocele is a cranial defect that occurs along the bony sutures, through which brain and/or meninges or a combination of both herniates; this defect is thought to occur as a result of faulty cranial mesoderm development. Recent theories suggest that cephalocele is developmentally and genetically different from exencephaly–anencephaly sequence and should not be considered a neural tube defect [11]. Studies on posterior cephalocele occurring in fetuses with Meckel syndrome have found a relationship with ciliopathy syndromes [11]. Sonographic features are sac-like structures posterior to the head in cases of posterior cephalocele or anterior by the fetal face in cases of an anterior cephalocele (Fig. 19.3). The cephalocele may be small or large. They may contain only meninges (meningocele) or brain tissue (meningomylocele). The larger the cephalocele the more brain tissue it contains, the worse is the prognosis for the fetus. Microcephaly may be seen in as many as 20–25 % of the cases. Reported detection rates at 11 to 13 6/7 weeks are 100 % [8].

Fig. 19.3
Posterior cephalocele at 12 4/7 weeks. (a) Axial section of the fetal head demonstrating the posterior cranial defect through which brain has herniated into the posterior cephalocele sac (arrow). (b) Sagittal view of the fetal head demonstrating the posterior cranial defect, the cephalocele sac with the brain and midbrain herniating into the sac (arrow). (c) 3D reconstruction of the cephalocele
Holoprosencephaly
During normal fetal development the falx cerebri, a midline structure that separates the single cavity of the forebrain into two hemispheres, should be seen after 9–10 weeks in all normal brains. Lack of visualization of the falx cerebri is consistent with alobar holoprosencephaly (HPE) (Fig. 19.4). At 11 to 13 6/7 weeks the choroid plexus is seen on each side of the midline falx; this configuration has been likened to a butterfly with the wings open [14] (see Fig. 19.4a). Using the “butterfly sign” Sepulveda et al. [15] screened 11,068 live fetuses for HPE over a 9-year period. Among this cohort they diagnosed 11 cases of HPE, which demonstrated lack of visualization of the “butterfly sign.” Detection rate of HPE using the absent “butterfly sign” was 100 %. In addition, they noted that 40 % had a biparietal-diameter less than the fifth centile for gestational age (GA); which further aided in the diagnosis.

Fig. 19.4
A composite image of a normal brain and four cases of holoprosencephaly. (a) Axial section of a normal fetus at 13 2/7 weeks for comparison, displaying the midline falx cerebri which divides the brain into the right and left hemispheres; the echogenic choroid plexus is seen to each side of the falx (Arrow=Falx). This appearance has been likened to a butterfly with open wings. (b) Fetus with HPE at 9 6/7 weeks. (c) Fetus with HPE at 11 4/7 weeks. (d) Fetus with HPE at 12 1/7 weeks. (e) Fetus with HPE at 13 2/7 weeks. The common sonographic feature of all four fetuses with holoprosencephaly imaged in an axial view is the absent falx; single ventricular cavity; choroid plexus superior to the fused thalami; and absence of the normal “butterfly” appearance of the axial view
Holoprosencephaly is a common malformation involving the forebrain; this malformation results from complete or incomplete failure of the forebrain to divide during the second to the third week post-conception [16–18]. The prevalence of holoprosencephaly at 11 to 13 6/7 weeks has been reported as 1:1300 pregnancies; with approximately 66 % having a chromosomal abnormality of which 86 % have trisomy 13 and 4 % trisomy 18 [19]. This anomaly has a spectrum ranging from the most severe alobar HPE, to semilobar HPE, and to lobar HPE and the least severe middle interhemispheric variant (MIHV). In approximately 80 % of individuals affected with HPE [9] a craniofacial anomaly is also present [16]. The craniofacial anomalies range from cyclopia (single midline eye), synophthalmia (partial midline face fusion of the two eye), and a proboscis (nasal appendage with a single nostril located above the eyes) [17]. During the first trimester, most of the cases of HPE that are diagnosed are alobar; although the semilobar type can also be diagnosed; however, at 11 to 13 6/7 weeks, this presents a challenging task. Three-dimensional inversion rendering can be used to differentiate between a normal brain and HPE; this can be used as an additional tool in the diagnosis of HPE in the first trimester [20] (Fig. 19.5). Lobar HPE, which is a more subtle malformation and depends upon the appearance of the cava is diagnosed at or after the 18- to 20-week anatomy scan. Most fetuses affected by HPE do not survive. Detection rates of 50–100 % have been reported [8, 13].

Fig. 19.5
Three-dimensional display of the three orthogonal scanning planes (axial, coronal, and sagittal) as well as the inversion mode; in which the anechoic cerebral spinal fluid is “inverted” and displayed as an echogenic structure in a fetus with trisomy 13 at 13 5/7 weeks with alobar HPE. (a) Coronal section showing the single or “mono” ventricle; absence of the midline structures and fused thalami. (b) Sagittal view of the fetus; the face is facing the left side of the picture; the head contains fluid. (c) Axial section showing similar features described in (a). Box 3D depicts the inverted image of the fluid contained within the single brain ventricle
Neck
Thickened Nuchal Translucency and Cystic Hygroma
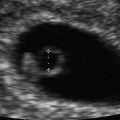
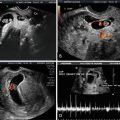
The significance of thickened or increased nuchal translucency (NT) in the screening for aneuploidies, congenital heart defects and other malformations is well established. Thickened NT refers to a measurement that is greater than the 95th centile; which in turn increases with gestational age and is just about 2.5 mm; in contrast, its 99th centile is fixed at 3.5 mm (Fig. 19.6) [21, 22]. A thickened NT in itself is not an abnormality since it can be seen in both normal pregnancies as well as those with pathologies. Kagan et al. [23] looked at the relationship between thickened NT and chromosomal defect. With increasing NT from the 95th centile to 3.4 mm the incidence of chromosomal aneuploidy was 7 %; at an NT of 3.5–4.4 mm the incidence of chromosomal aneuploidy was 20 %; at a NT of 4.5–5.4 mm it was 45 %; at a NT of 5.5–6.4 mm, 50 %; at a NT of 6.5–7.4 mm, 70 %; and with NT of ≥8.5 mm, 75 %. Another interesting finding was that about half of the fetuses with trisomy 21 has NTs ≤ 4.5 mm; NT greater than 4.5 mm was seen in about 60 % of the cases with trisomy 13, 75 % of fetuses with trisomy 18 and 90 % of cases of Turner syndrome; moreover, fetuses with Turner tended to have the thickest NT ≥ 8.5 mm.

Fig. 19.6
Fetus at 11 5/7 weeks demonstrating NT of 3.1 mm; at this gestational age this measurement falls above the 95th centile
In euploid fetuses with thickened NT the association with congenital heart defects (CHD) is well known. In a 2003 meta-analysis by Makrydinas et al. [24] an NT > 95th centile had a sensitivity of 37 % and specificity of 96.6 %; and for NT > 99th centile they were 31 % and of 98.7 %, respectively, with a positive likelihood ratio of 24 for the diagnosis of major congenital heart defect [21, 24]. In a subsequent 2013 meta-analysis by Sotiriadis et al. [25] they found that approximately 45 % of chromosomally normal fetuses with CHD had an NT > 95th and 20 % had an NT > 99th centile.
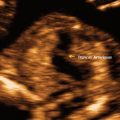
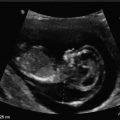
Cystic hygroma refers to bilateral, septated, cystic, fluid-filled spaces located in the occipitocervical region [26]. This is a result of obstruction between the lymphatic and venous vessels in the neck resulting in accumulation of lymph in the jugular lymphatic sacs (Fig. 19.7). In fetuses with cystic hygroma between 11 and 13 6/7 weeks approximately 51 % [27] to 54.9 % [28] will have a chromosomal abnormality; of which trisomy 21 is the most common. In a recent retrospective cohort study of 944 fetuses with first trimester cystic hygroma; the prevalence of trisomy 21 was 21.4 %; followed by monosomy X (Turner syndrome) 12.1 %, trisomy 18 at 11.4 % and trisomy 13 at 3.6 % and other karyotypic abnormalities such as other trisomies, deletions, duplications, unbalanced translocations, inversions, and sex chromosome abnormalities [28]. Among the fetuses with normal karyotype 28.8 % had a major anomaly. Urinary, central nervous system, and cardiac were the most common accounting for 15 % of the anomalies [28]. In the same cohort six fetuses had genetic syndromes; Angelman and Noonan syndrome were among the genetic syndromes seen. Perinatal loss occurred in 39 % of ongoing pregnancies and the overall abnormal outcome ensued in 86.6 % of the fetuses [28].

Fig. 19.7
Fetus at 12 3/7 weeks with cystic hygroma. (a) Posterior coronal section showing the bilateral cystic dilatation at the level of the posterior neck area (arrow). This pathology is a result of obstruction between the lymphatic and venous vessels in the neck resulting in accumulation of lymph in the jugular lymphatic sacs. (b) Sagittal view of the fetus showing extensive posterior hygroma and the total body edema. (c) 3D reconstruction of cystic hygroma
Face
Absent Nasal Bone, Cleft Lip ± Palate, Cataracts, Micrognathia
During the early anatomical survey, similarly to the traditional second trimester anatomical survey, a profile view of the face should be obtained. This may reveal an absent or hypoplastic nasal bone, a cleft lip and/or palate, or micrognathia.
Absent nasal bone is not a fetal malformation per se however it is a marker of fetal aneuploidy; specifically of the common trisomies (Fig. 19.8). The nasal bones are actually paired structures, there is a right and a left nasal bone, and there can be unilateral as well as bilateral absence or hypoplasia. Absent nasal bone is seen in 60 % of fetuses with trisomy 21, 53 % of trisomy 18 and in 45 % of trisomy 13; its absence confers a likelihood ratio of 27.8 for Down syndrome; furthermore, it can be seen in 2.5 % of euploid fetuses [29]. Among euploid pregnancies absent nasal bone is seen more frequently in African American women (5.8 %) than in white women (2.6 %) or Asian women (2.1 %) [30]. In a recent publication among 57 fetuses with absent nasal bone and normal karyotype three fetuses had an adverse outcome and, in all, additional sonographic abnormalities were seen [30].

Fig. 19.8
Two fetuses are seen, one with a normal and one with absent nasal bone and cystic hygroma. To image the nasal bone or its absence it is important to obtain the correct sagittal scanning plane of the face which shows the tip of the nose (long arrow) and the palate (short arrow). (a) Fetus at 12 1/7 weeks with a normal-appearing nasal bone. (b) Fetus with absent nasal bone at 13 6/7 weeks
Cleft lip and/or palate (CLP) is a common facial anomaly with a reported incidence of 1.7 per 1000 live births; however, ethnic and geographic variation exist [31]. In up to 80 % of the cases cleft lip is unilateral, typically affecting the left side and most of the affected fetuses are male. However, isolated cleft palate is more commonly seen in females with a reported incidence of 1 in 2500 live births [31]. During development, a continuous upper lip is formed by 8 weeks when the medial nasal and maxillary processes fuse. Failure of fusion of the medial nasal and maxillary processes will result in a cleft lip affecting one or both sides. The palate develops from the primary and the secondary palate. Its development starts at 7 weeks, but is not completed until the 14th week. At 11 to 13 6/7 weeks a sagittal, coronal, and axial view using 2D and 3D sonography can detect a CLP (Fig. 19.9). In cases of bilateral cleft lip and palate a protuberance is seen anterior to the lips in the sagittal plane; in the axial plane the cleft lip and palate can be seen as a deep indentation. Three-dimensional ultrasound, specifically 3D reconstruction of the face using the coronal plane can help in evaluating the facial defects (see Fig. 19.9b). Detection rates of CLP in the first trimester are low, ranging from 5 to 50 % [8, 13]. The retronasal triangle (see Fig. 19.9e) can be imaged, using 2D or 3D sonography, by obtaining an anterior coronal view of the fetal face. The apex of the retronasal triangle is made up of the two nasal bones, the sides are the frontal process of the maxilla and the base of the triangle is the primary palate [32]. In cases of CLP, a defect can be imaged at the base of the triangle, at the site of the palate (Fig. 19.9b Box C) Boc C. The retronasal triangle view likely can improve the detection and diagnostic rates of CLP; however, no large prospective studies looking at efficacy of the retronasal triangle are available to date. Furthermore, this view has recently been reported as a new way to evaluate the presence or absence of the nasal bones [32–34].

Fig. 19.9
Fetus with unilateral left-sided cleft lip and palate at 12 5/7 weeks. (a) Axial section through the upper lip of a fetus with unilateral cleft lip and palate diagnosed at the time of the nuchal translucency scan (arrow). (b) 3D orthogonal planes of the same fetus. Box A: a sagittal view of the face. Upper Left Box B: a coronal section showing the abnormal retronasal triangle with a gap at the area of the left side of the palate (arrow). Lower Left Box C: the axial section; arrow points to defect (c) 3D reconstruction of the fetus with the unilateral cleft lip and palate (arrow). (d, e) 2D and 3D thick slices of a normal retronasal triangle
Cataracts: the reported incidence is 1–6/10,000 births [35]. The fetal lens develops from the surface ectoderm before the sixth week of gestation [35]. Fetal cataracts may be the result of a very early in-utero fetal infection, such as rubella, varicella, herpes and CMV, exposure to a toxin (anti-psychotic drugs such as carbamazepine), idiopathic or genetic. A genetic cause is seen in 30 % of unilateral cases and in 50 % of bilateral cases [35]; genetic causes includes syndromes such as Walker–Warburg syndrome and karyotypic abnormalities such as trisomy 21, 18, and 13. The normal sonographic appearance of the fetal lens is that of a ring with an anechoic center and an outer echogenic rim (Fig. 19.10a). At times the hyaloid artery can be seen as a linear structure between the posterior aspect of the lens and the optic disc; however, the hyaloid artery typically regresses before birth. In fetal cataracts there is opacification of the anechoic center-core of the lens; at times, in conjunction with cataracts, there may be reduction in the size of the fetal eyes [36] (see Fig. 19.10b).

Fig. 19.10
 Aneuploidy Screening: The Ongoing Role of First-Trimester Ultrasound
 Invasive Procedures in the First Trimester
 Threshold, Discriminatory Zone, and “The New Rules”
 The Fetal Heart in Early Pregnancy
 First-Trimester Embryology: An Overview
 A Consequence of Cesarean Delivery: First-Trimester Cesarean Scar Pregnancy


Axial section of the fetal face at the level of the fetal orbits. (a) Normal fetus within the orbits the normal lenses are seen. The sonographic appearance of a normal lens is that of an echoic ring with a central sonolucency (arrows). (b) Axial section of a fetus with autosomal dominant cataracts at 12 5/7 weeks. Within the normal orbits, the ring-like appearance of the lens is lost and replaced by a ring filled with a central echogenic material, the cataract. The arrow points to the small and receding jaw
Related posts:
Aneuploidy Screening: The Ongoing Role of First-Trimester Ultrasound
Invasive Procedures in the First Trimester
Threshold, Discriminatory Zone, and “The New Rules”
The Fetal Heart in Early Pregnancy
First-Trimester Embryology: An Overview
A Consequence of Cesarean Delivery: First-Trimester Cesarean Scar Pregnancy
Stay updated, free articles. Join our Telegram channel
Full access? Get Clinical Tree
