Known etiologies
Possible etiologies
Parental chromosomal abnormality
Environmental exposures
Untreated hypothyroidism
Heritable and/or acquired thrombophilias
Uncontrolled diabetes mellitus
Infection
Septated congenital uterine anomaly
Maternal alcoholism
Asherman’s syndrome
Polycystic ovarian syndrome
Antiphospholipid syndrome
Chemical Evidence of Pregnancy Failure
There is very little evidence to support biochemical screening for pregnancy viability. Studies evaluating pregnancy-associated plasma protein A (PAPP-A), estriol, α-fetoprotein, and inhibin A did not find statistical association with a change in these markers and early pregnancy loss. However, β-hCG and progesterone levels may have a direct relationship with early pregnancy maturation. Several studies have reported a mathematical relationship between rising β-hCG levels and “normal” pregnancy maturation. Kadar and associates reported that a 66 % rise in the β-hCG level in 48 h is associated with a normal intrauterine pregnancy [6]. However, significant weaknesses are noted in the study sample size and methodology rendering this conclusion unreliable. The study was based on only 20 patients who were sampled inconsistently at 1- to 5-day intervals, and the 48-h interval was determined after lowering the confidence interval to 85 %. A more recent study by Barnhart and associates found β-hCG increased by 24 % in 1 day and 53 % by 2 days; however, their sampling interval was also inconsistent, varying between 1 and 7 days, raising concerns about the reproducibility of their results [7]. Although the trend of a rising β-hCG titer may not reliably predict a viable pregnancy, a low β-hCG titer with an “empty” gestational sac should raise concern for pregnancy failure [8]. Low progesterone levels have also been associated with an increased risk for pregnancy failure [3, 9] This association increases significantly as progesterone levels fall below 30 nmol/L [3]. The association of pregnancy failure is strongest when correlating a woman’s age and gestational sac size. Failure increases with advancing maternal age and increased sac size [3].
Multiple studies have attempted to determine a level of β-hCG at which a normal intrauterine pregnancy should be identified on ultrasound, frequently referred to as the discriminatory level. By transvaginal ultrasound (TVS), this discriminatory level was determined to be 1000 mIU/mL by some authors to 2000 mIU/mL by others [10]. This discriminatory level is defined as the threshold between an abnormal (spontaneous abortion or ectopic) and a normal intrauterine pregnancy. Doubilet and Benson reported the highest β-hCG that proceeded visualization of an intrauterine pregnancy by TVS and an eventual term live newborn as 4336 mIU/mL. They concluded that the β-hCG discriminatory level should not be used solely to determine first-trimester pregnancy management [10]. Therefore, a β-hCG discriminatory level is not a reliable marker for predicting pregnancy failure or an abnormal pregnancy.
Ultrasound Characteristics of Early Pregnancy
Events in early pregnancy follow a predictable sequence as documented by transvaginal sonography (see Chap. 7 for details). A gestational sac is the first identifiable sonographic sign of pregnancy at approximately 5 weeks from the last menstrual period. The gestational sac is a small cystic structure, eccentrically located within the uterine cavity as a result of implantation within the endometrial lining. The sac is circular and well defined without any visible contents. By 5 weeks, 3 days, a yolk sac can be visualized as a round structure, usually eccentrically located. An embryo is first noted adjacent to the yolk sac around 6 weeks gestation. At this point, a fetal heart rate may be visualized. The embryo continues to increase in size and slowly takes on a more fetal form as it approaches 10 weeks of gestation with the crown-rump length increasing approximately 1 mm/day.
Imaging of the Early Pregnancy
The appearance and location of a first-trimester pregnancy are best imaged using a high-frequency transvaginal probe. With the transvaginal approach, the ultrasound probe is in close proximity to the pregnancy, allowing for excellent resolution. High-resolution imaging provides the necessary detail to visualize an early yolk sac, visualize and measure cardiac activity, and obtain an accurate crown-rump length measurement at an early gestational age. A transvaginal exam does not require a full bladder and in addition allows for an assessment of the adnexa and ovaries.
Ultrasound Evidence of Pregnancy Failure
Gestational Sac
The location and appearance of the gestational sac provide vital clues as to the likelihood of pregnancy failure. On initial sonographic evaluation, the location of the gestational sac is important to document and helps determine future viability and risk for pregnancy loss, as well as maternal morbidity, specifically from obstetrical hemorrhage if ectopic. The relationship of the sac to the cornual regions and to the cervix or prior uterine scar should be documented.
Location
Gestational sacs located in the extremes (cornua or cervix) of the uterine cavity will tend to be abnormal and either fail or need to be removed due to their risk for rupture and hemorrhage. Implantation in the cornual regions requires close observation with serial examinations. Those on the cavity side of the tubal ostia, referred to as subcornual, will tend to grow into the uterine cavity and proceed normally (Fig. 15.1a, b). Those within the interstitial portion of the tube will be cornual ectopic pregnancies and need additional therapy (Fig. 15.2). Implantations close to or in the endocervical canal tend to fail due to the poor vascular infrastructure; however, some will persist, becoming cervical ectopic pregnancies (Fig. 15.3). Cervical ectopic pregnancies will eventually rupture and/or hemorrhage risking significant maternal morbidity. Identification of the gestational sac low within the uterine cavity is associated with an increased risk for failure. Nyberg and coworkers assessed gestational sac location. They reported that when a gestational sac is located within the lower uterine segment, the risk for pregnancy failure is increased with a sensitivity and positive predictive value (PPV) of 20 and 94 % [11].
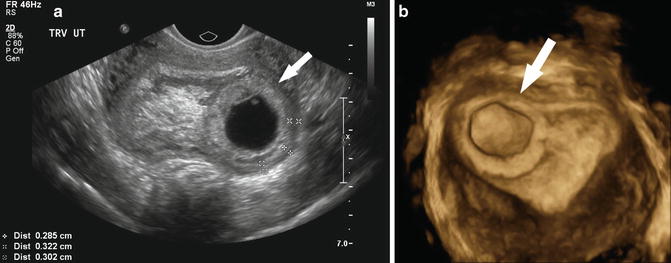


Fig. 15.1
(a) Subcorneal implantation. A transvaginal, axial, fundal image of a subcorneal implantation of a 5 week 0 day gestational sac is depicted. (b) Subcorneal implantation. In this 3D-rendered transverse image of the same pregnancy depicted in (a), the subcorneal implantation is identified by the arrow
Fig. 15.2
Ectopic pregnancy. A corneal ectopic pregnancy (arrow) at 6 week 3 day is shown in this transverse image of the right uterine cornea
Fig. 15.3
Cervical ectopic pregnancy. A 7 week 6 day cervical ectopic pregnancy is depicted by the arrow in this midsagittal view of the cervix
Appearance
The first sign of pregnancy identified by ultrasound is the gestational sac which is a round, anechoic cystic structure with an echogenic wall eccentrically located within the endometrial lining (Fig. 15.4a). The sac is usually identified when it reaches 2–3 mm in size in the fourth week of gestation. Gestational sac size is reported as a mean sac diameter (an average of the sagittal, transverse, and anteroposterior diameters of the sac). The appearance and size of the sac are important sonographic predictors of early pregnancy failure.

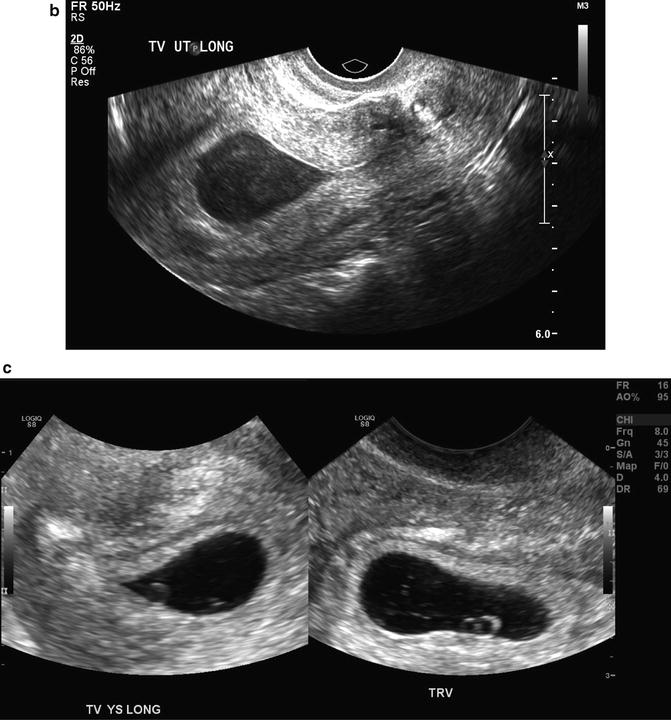
Fig. 15.4
Early gestational sacs. (a) A normal 4 week 1 day gestational sac is shown in the longitudinal and axial transvaginal images. Note the “donut”-shaped ring around the gestational sac known as a double decidual sac sign. (b) Transvaginal, midsagittal image of a pregnancy pseudosac within the uterine cavity is depicted with an ectopic pregnancy (not shown) at 5 weeks 2 days gestation. (c) Longitudinal and transverse images of an abnormal “tear drop”-shaped gestational sac with an abnormal-appearing yolk sac at 5 weeks 5 days gestation
A centrally located cystic structure with a thin wall usually represents pseudogestational sac, a fluid collection within the uterine cavity, rather than a gestational sac (Fig. 15.4b). A pseudogestational sac can be seen when the pregnancy is located outside of the uterine cavity as with a tubal or cervical ectopic pregnancy. It tends to be “tear drop”-shaped and lacks the expected echogenic rim of a gestational sac and may contain debris. If a pseudogestational sac is suspected, further imaging is necessary to identify a possible ectopic pregnancy.
Although there is little research to predict outcome, gestational sacs that appear collapsed or contain a significant amount of debris are at high risk for pregnancy failure (Fig. 15.4c). These pregnancies may be anembryonic or may represent a recent embryonic demise. The debris may be the result of a recent hemorrhage. Careful examination of the sac for evidence of a yolk sac and/or embryo is required since the debris may mask these structures.
Nyberg and associates analyzed the appearance of the gestational sac in 168 subjects and found that a thin decidual reaction (≤2 mm), a weakly echogenic decidual reaction, and an irregular sac contour had a PPV for pregnancy failure of 96 %, 98 % and 97 %, respectively [11]. Moreover, the authors’ report that a gestational sac located in the lower uterine segment has a PPV of 94 % for pregnancy failure (Fig. 15.5). A distorted gestational sac shape had the highest PPV for pregnancy failure at 100 %. Although the PPV was high, the sensitivity of these findings was low, ranging from 10 % for a distorted shape to 53 % for a weak echogenic decidual reaction (Fig. 15.6).


Fig. 15.5
Abnormally positioned gestational sac. This is a midsagittal, transabdominal image of a 5 week 0 day gestational sac implanted in the lower uterine segment portion (solid black arrow) of the uterine cavity with an intrauterine contraceptive device in the endocervical canal (white arrow)
Fig. 15.6
Irregular gestational sac. A transvaginal, axial image is shown depicting an irregular 7 week 5 day gestational sac in a failed pregnancy found to be triploidy by karyotype. Note the cystic (hydropic) placenta (arrow) sometimes seen in triploidy
Several investigators have noted that the early gestational sac forms a cystic echogenic complex which expands into the uterine cavity and is outlined by the echogenic decidual tissue. This sonographic appearance has been referred to as the double decidual sac sign (DDS), and studies have advocated the absence of this sign as a predictor of pregnancy failure (see Fig. 15.4a). Nyberg and associates found that the absence of the DDS has a PPV of pregnancy failure of 94 %. Bradley and colleagues reported the utility of the DDS in differentiating an ectopic pregnancy from an early intrauterine pregnancy but found that the DDS was a poor predictor for pregnancy failure [11, 12]. Doubilet and Benson describe poor interobserver agreement for the presence of a DDS (κ = 0.24) and note that first-trimester outcome was unrelated to the presence of a DDS [13].
Yeh and associates described another early sonographic sign of pregnancy. They reported that the early gestational sac is implanted within thickened decidua on one side of the uterine cavity, and the combination of these sonographic findings was coined the intradecidual sign (IDS) [14] (Fig. 15.7). The IDS was identified in 92 % of intrauterine pregnancies as early as 25 days of gestation, yielding a sensitivity and specificity of 92 and 100 %. Laing and associates found the IDS to have a sensitivity and specificity of 34–66 % and 55–73 %, respectively, with poor interobserver agreement [15]. The overall accuracy for predicting an intrauterine pregnancy was only 45 %. Chaing and colleagues revisited the utility of an IDS for determination of an intrauterine pregnancy and found more favorable sensitivity, specificity, accuracy, and interobserver agreement (kappa statistic) of 70 %, 100 %, 75 %, and 0.79, respectively [16]. Doubilet and Benson also investigated the IDS as a sign of a viable intrauterine pregnancy and found poor interobserver agreement with a kappa statistic of 0.23. They found no statistically significant relationship between the presence of an IDS and viability at the end of the first trimester [13]. Based on the present literature, the DDS and IDS are often not visualized or are difficult to discern, and the ultimate pregnancy outcome seems unrelated to the presence of these two findings. Given the poor agreement among investigators, these signs do not appear predictive of pregnancy success or failure.
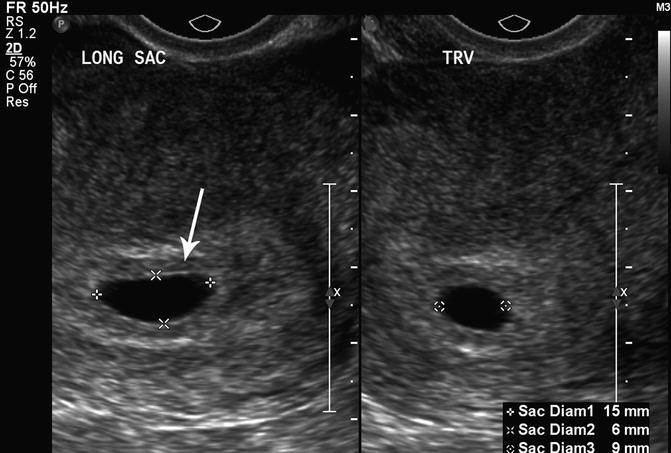
Fig. 15.7
Intradecidual sign. A transvaginal, axial image of a 5 week 1 day gestational sac with an intradecidual sign (arrow) is shown
Size/Growth
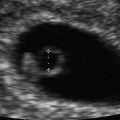
The most predictive criterion for identifying a failed pregnancy is the presence of a large gestational sac for expected age that does not contain an embryo. Several studies have investigated a critical value for the minimal mean sac diameter above which a normal embryo should reliably be identified by TVS. Initial studies suggested a cutoff of 16 mm but were based on small numbers [17]. Other studies identified empty gestational sacs with a mean sac diameter between 17 and 21 mm that subsequently were found to be viable pregnancies [18, 19]. Pexsters and associates found the interobserver error in the measurement of the mean sac diameter to be ±19 % [20]. Considering the results of these studies, a 21-mm mean sac diameter by one observer could be as high as 25 mm as measured by a second observer. Therefore, a mean gestational sac diameter of 25 mm, in the absence of an embryo, would be the best diagnostic cutoff for a failed pregnancy (Fig. 15.8).
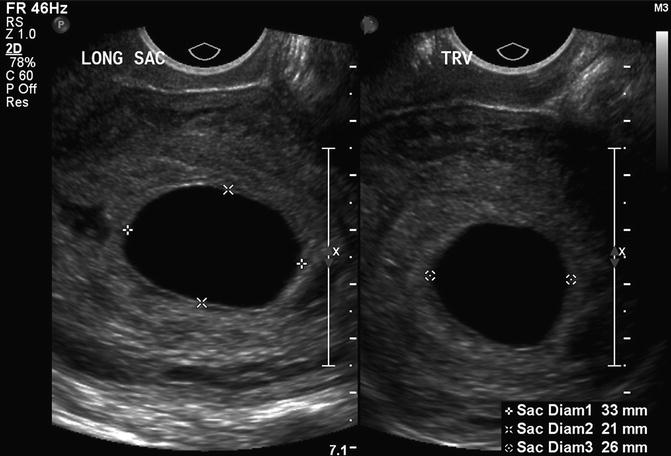
Fig. 15.8
Large, empty gestational sac. This is a transvaginal, axial image of an empty 7 week 5 day gestational sac with a mean sac diameter of 27 mm, indicating a failed pregnancy
A normal gestational sac grows approximately 1 mm per day during the first trimester (Fig. 15.9) [21]. However, predicting pregnancy failure by subnormal sac growth is not reliable [22]. Usual timing of early pregnancy events (±0.5 weeks) includes visualization of the gestational sac by 4.5 weeks, yolk sac by 5.5 weeks and an embryo with cardiac activity by 6 weeks, but variation exists. A single examination at 6 weeks that does not demonstrate an embryo with cardiac activity is not diagnostic of pregnancy failure especially if the pregnancy is dated by the menstrual cycle, which is frequently unreliable. A second examination is recommended to confirm pregnancy failure. Once a gestational sac is visualized within the uterus, an embryo with cardiac activity should be identified sonographically within 14 days. If a gestational sac and yolk sac are visualized, an embryo with cardiac activity should be seen within 11 days [23, 24]. Failure to meet these milestones would be suggestive of pregnancy failure.

Fig. 15.9
Graph depicts the mean gestational sac diameter in mm ± 2 standard deviations compared to the gestational age in weeks created with data from ref. [24]
Amnion
The amniotic cavity is a space between the cytotrophoblast and the embryonic disc, which is lined by amnion cells. The amnion is usually visualized near the same time as the embryo (approximately 6.5 weeks). During the early first trimester (6.5–10 weeks), the diameter of the amniotic cavity is approximately equal to the embryonic crown-rump length (amniotic diameter = 1.1 × CRL − 0.07) [25]. A small or non-visualized embryo in a well-formed amniotic cavity is suggestive of a failed pregnancy. Horrow found that a CRL/amniotic cavity difference greater than 0.48 cm (0.86 ± 0.38 cm) was associated with pregnancy failure. McKenna and associates reported that an “empty amnion” (defined as a visible amnion without an embryo) was always associated with pregnancy failure (Fig. 15.10) [26]. Yegul and colleagues described that a visible amnion with an identifiable embryo (less than 5.4 mm) without cardiac activity was associated with pregnancy failure. This finding was referred to as the “expanded amnion sign,” and in their analysis, this sign had a PPV of 100 % [27]. A further study by this group found that visualization of an amniotic cavity without evidence of an embryo (referred to as the “empty amnion sign”), confirmed pregnancy failure regardless of the gestational sac size with a PPV of 100 % [28].
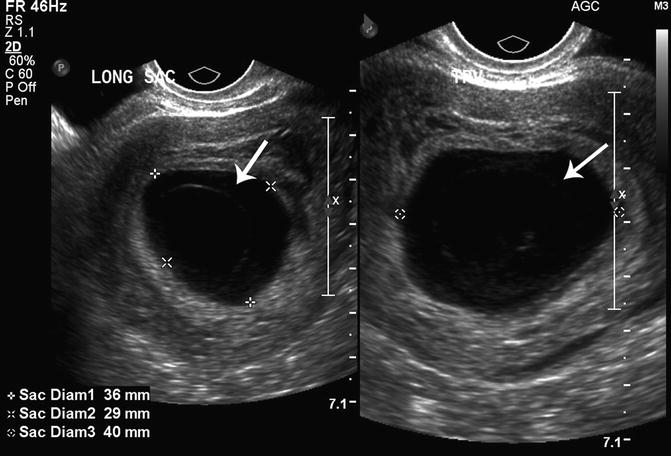
Fig. 15.10
Empty amnion. An empty amnion at 6 weeks 6 days gestation is shown (arrows) in this transvaginal, axial view of the uterus
Placenta/Chorionic Frondosum
The chorion is formed from mesoderm and trophoblasts and becomes the wall of the chorionic cavity. The chorionic cavity is the anechoic fluid collection in which the embryo, amnion and yolk sac are suspended and grow, and is measured as the “gestational sac.” The cavity is eventually obliterated by the expanding amnion, resulting in the single amniotic cavity.
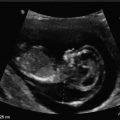
The most significant concern for the chorion is hematoma formation. Bleeding during the first trimester of pregnancy is one of the most common obstetrical complications, occurring in approximately 14 % of all pregnancies [29]. This bleeding can result in hematoma formation of the subchorion. Multiple studies have linked subchorionic hematomas (SCH) with both early and late adverse pregnancy outcomes. The definition of a hematoma is not always clearly defined, but the majority of investigators recognize a hematoma as a crescent-shaped, hypoechoic fluid collection behind the fetal membranes and/or the placenta. Hematomas may be subchorionic (between the chorion and myometrium) or retroplacental (behind the placenta) and frequently become filled with debris as they age [30, 31] (Fig. 15.11a, b).

Fig. 15.11
(a) Subchorionic hematoma. A large subchorionic hematoma is denoted by calipers in this transvaginal, axial image at 5 weeks 5 days gestation, showing an early embryonic pole (arrow). (b) Subchorionic hematoma. This transvaginal, axial image shows a subchorionic hematoma (thick white arrow) in a 5 week 0 day gestation with a normal-appearing yolk sac (thin black arrow)
Vaginal Bleeding
Falco and associates followed 270 pregnant women with vaginal bleeding between 5 and 12 weeks gestation and found that 17 % developed SCHs. Pregnancy failure ranged from 6 to 84 %, depending on the presence of other factors such as the gestational sac CRL difference, menstrual sonographic age difference and the embryonic heart rate [2]. They found that the fetal heart rate was the most powerful predictor of pregnancy outcome in their linear regression model, with a low heart rate (less than 1.2 SDs which is 94 beats per minute (bpm) at 6 weeks gestation to 124 bpm at 10 weeks gestation) increasing the risk for pregnancy failure. Borlum et al. followed 380 women with vaginal bleeding and found an 11.3 % increased pregnancy loss rate in the presence of a SCH [32]. Schauberger and colleagues found that 14 % of women with a confirmed viable pregnancy by ultrasound performed for vaginal bleeding experienced pregnancy failure by 20 weeks gestation [33]. Additional studies on women with first-trimester vaginal bleeding have reported similar results of both early pregnancy failure and pregnancy loss up to 20 weeks gestation [34].
Hematoma
Multiple studies have investigated the risk of pregnancy loss after the identification of a SCH and the findings are mixed. Additionally, there is crossover between women with first-trimester vaginal bleeding and those in which hematoma formation is actually confirmed by ultrasound. Comparison of these studies is limited by the varied methodologies and study design limitations (small sample size, lack of a control group, limited description and analysis of patient characteristics and publication bias) [35, 36]. The rate of SCH ranged from 0.5 to 20 % in these studies, and while studies by Pedersen et al. and Stabile et al. found no association of SCH to pregnancy failure, other studies by Borlum et al. and Maso et al. found at least a twofold increased risk [32, 34, 37, 38]. Most studies did not find any statistical relationship between the hematoma volume and adverse outcome; however, Maso et al. found that the overall risk for spontaneous abortion was 2.4 times higher when the hematoma was identified before 9 weeks of gestation [34]. One of the largest studies by Ball and coworkers evaluated 238 subjects with a SCH and found a 2.8-fold increased risk of spontaneous abortion (a loss before 20 weeks gestation) [31]. In those subjects with a SCH, vaginal bleeding increased the risk of spontaneous abortion compared to subjects without vaginal bleeding but findings did not reach statistical significance (p = 0.057) [31]. A systematic review and meta-analysis by Tuuli and coworkers calculated a 2.2-fold increased risk of spontaneous abortion in the presence of a SCH [35]. Based on these findings, it is reasonable to assume that a SCH is associated with a twofold increased risk for pregnancy failure.
Chorionic Bump
Harris and colleagues studied the association of a round avascular mass extending from the choriodecidual surface into the gestational sac described as a chorionic bump, with first-trimester pregnancy outcome [39] (Fig. 15.12a, b). They hypothesized that chorionic bumps represent choriodecidual hemorrhages and reported that the chorionic bump was associated with a fourfold increased risk for pregnancy loss, mostly in the first trimester. Sana et al. performed a retrospective case-controlled trial and found that a chorionic bump identified in the first trimester had approximately double the risk of pregnancy loss compared to matched controls. Neither study found a statistically significant relationship between the size or location of the chorionic bump and the risk of pregnancy loss [40].
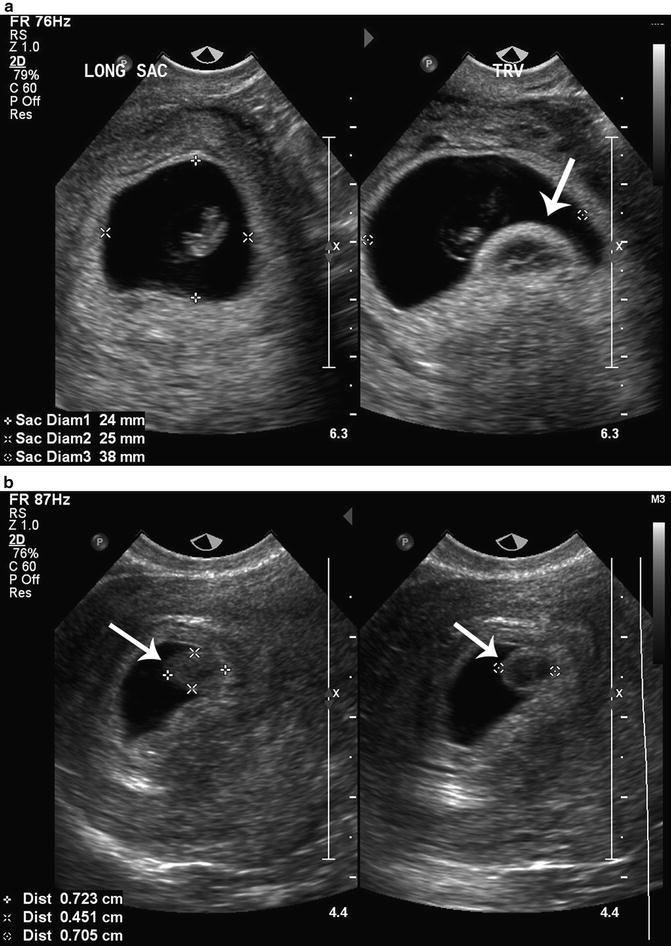
Fig. 15.12
(a) Chorionic bump. A chorionic bump (arrow) is visualized in the right longitudinal image of this 8 week 0 day gestational sac with an embryonic pole. (b) Chorionic bump. A chorionic bump (arrows) is measured in these transvaginal, axial and longitudinal images of a 5 week 0 day gestational sac
Vascular Pattern
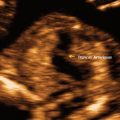
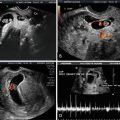
Once a gestational sac is visualized, uteroplacental circulation can be identified in most viable pregnancies (Fig. 15.13). Moving echoes within the 8- to 11-week placenta detected by grey scale imaging is noted more frequently in those with pregnancy failure compared to viable pregnancies (88–100 % vs. 36–60 %, p < 0.01–0.001) [41]. In women with pregnancy failure, the placenta tends to have a mottled appearance due to numerous centrally located venous lakes (Fig. 15.14). Wherry and colleagues found that low-resistance arterial endometrial blood flow is associated with trophoblastic tissue but could not discriminate between a viable pregnancy and pregnancy failure [42]. Jaffe et al. prospectively followed color Doppler interrogation of the decidual spiral arteries and the intervillous space in 100 women at 7–12 weeks gestation and recorded pregnancy outcomes [43]. Thirteen women had pregnancy failure in the first trimester and six had second trimester medical complications including hypertension, preeclampsia and diabetes. Abnormal color Doppler imaging was defined as active blood flow in the intervillous space and a resistive index > 0.55 in the spiral arteries. A reassessment of their data targeting first-trimester failure yielded a sensitivity, specificity, PPV, and negative predictive value of 92 %, 82 %, 43 %, and 99 %, respectively. These findings suggest that color Doppler may be helpful in predicting pregnancy failure but should not be used alone as diagnostic.


Fig. 15.13
Intervillous vascular flow. Color Doppler highlights the intervillous vascular flow (arrow) in this 5 week 6 day failed pregnancy
Fig. 15.14
Peritrophoblastic vascular flow. This image shows normal peritrophoblastic flow (arrow) in a 4 week 6 day pregnancy
Yolk Sac
The primary yolk sac regresses by week 2 or 3 of pregnancy and is no longer visible by ultrasound. The secondary yolk sac (YS) is the earliest embryonic landmark visualized by ultrasound; it is usually identified by about the 5.5 weeks when the gestational sac is about 8–10 mm (Fig. 15.15). However, in occasional normal pregnancies, the YS may not be visualized until a gestational sac size of 20 mm [19]. The yolk sac is a circular structure with a hyperechoic wall and measures approximately 3–5 mm. It increases in size steadily up to 8–11 weeks gestation and disappears by 12 weeks (Fig. 15.16). Identification of the YS confirms that an intrauterine fluid collection is a gestational sac even before the appearance of the embryo. Since the YS is continuous with the embryo, amnion, and connecting stalk in the early first trimester, it will typically be found close to the wall of the gestational sac.


Fig. 15.15
Normal gestational sac and yolk sac. A normal 5 week 6 day gestational sac and yolk sac are shown in this parasagittal, transvaginal image
Fig. 15.16
Graph compares a normal yolk sac size in mm ± 2 standard deviations with the crown-rump length in mm using data from ref. [46]. Reprinted with permission from Lindsay DJ, Lovett IS, Lyons EA, et al. Yolk sac diameter and shape at endovaginal US: predictors of pregnancy outcome in the first trimester. Radiology 1992; 183: 115–118
Appearance
The description of an abnormal or deformed YS varies slightly by study, but the majority of investigators describe an abnormal YS as having any of the following: an irregular (non-circular) shape, wrinkled margins, indented walls, collapsed walls, thick echogenic walls, doubled (appearance of 2 or more YS) or containing echogenic spots or bands (see Figs. 15.4c, and 15.17a, b). An echogenic YS, with an echogenic central portion rather than anechoic has not been considered abnormal. Only one study described adverse outcomes in pregnancies with an echogenic YS, but several others report this finding in normal pregnancies [44]. Echogenic yolk sacs should be differentiated from a calcified YS in which acoustic shadowing is demonstrated. Calcified yolk sacs are usually indicative of a loss of fetal cardiac activity before 12 weeks of gestation [45].
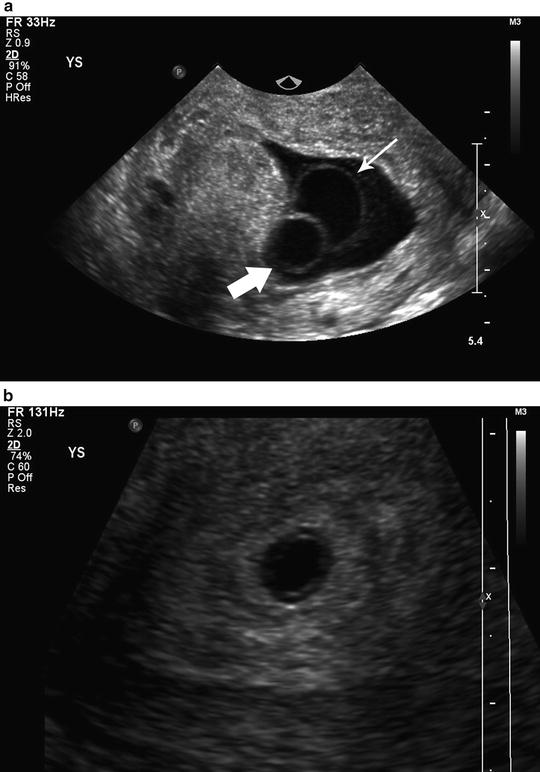
Fig. 15.17
 Aneuploidy Screening: The Ongoing Role of First-Trimester Ultrasound
 Invasive Procedures in the First Trimester
 Threshold, Discriminatory Zone, and “The New Rules”
 The Fetal Heart in Early Pregnancy
 First-Trimester Embryology: An Overview
 A Consequence of Cesarean Delivery: First-Trimester Cesarean Scar Pregnancy


(a) Large yolk sac. A large yolk sac (thick arrow) is seen compressing an empty amnion (thin arrow) at 6 weeks 1 day gestation in this transvaginal, midsagittal image. (b) Large yolk sac. A large yolk sac is visualized, filling the chorionic cavity in this axial, transvaginal image of a 4 week 1 day gestation
Related posts:
Aneuploidy Screening: The Ongoing Role of First-Trimester Ultrasound
Invasive Procedures in the First Trimester
Threshold, Discriminatory Zone, and “The New Rules”
The Fetal Heart in Early Pregnancy
First-Trimester Embryology: An Overview
A Consequence of Cesarean Delivery: First-Trimester Cesarean Scar Pregnancy
Stay updated, free articles. Join our Telegram channel
Full access? Get Clinical Tree
