Fig. 6.1
Blood flow (BF) in the right common femoral vein in a lying subject holding his/her breath. The sine curve corresponds to the wave transmitted from the right atrium. It is a composite wave superimposed on the venous return. (a) Curve modulation at normal speed (4 s in display). (b) Curve modulation at slow speed (12 s in display)
Copyright: [Author]
This sine curve must be distinguished from the arterialised flow in a vein in the case of an arteriovenous fistula. In the immediate vicinity of the fistula, the velocity profile is very similar to arterial (Fig. 6.2a). If the flow is measured directly in the fistula or its immediate vicinity, a greatly increased velocity is found. Further along the course of the vein, the velocity profile becomes weaker with a reduced velocity during cardiac systole. If the sine-shaped velocity profile is found in the great saphenous vein, then an arteriovenous fistula or ventricular septal defect must always be suspected (Fig. 6.2b) (see also Sect. 17.6).
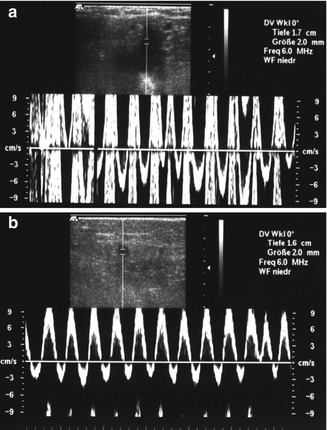
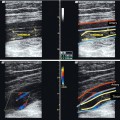
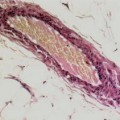
Fig. 6.2
(a) Velocity profile of the saphenofemoral region in a patient with an A-V fistula. This fistula resulted from a femoral puncture during a heart catheter examination. (b) Velocity profile in the same leg further down the great saphenous vein in the thigh region (12 s in display)
Copyright: [Author]
Cyclical flow change in synchrony with the heart rate is not always found and normally has no pathological or diagnostic value. However, in combination with increased velocities, it may indicate an A-V fistula, septal defect or right heart insufficiency (see Sect. 17.5).
This is not the case with respiration. The normal venous velocity profile during the respiration cycle in a healthy person is influenced by pressure fluctuations in the abdomen. During inhalation the intra-abdominal pressure increases which increases pressure on the vena cava. This hinders the venous return to the right atrium. As a result, towards the end of inhalation, the velocity profile flattens and may disappear almost completely (Fig. 6.3). Occasionally it may become retrograde for an instant (Fig. 6.4). If the subject exhales normally by releasing his/her breath, no pressure occurs in the abdomen and the blood returns freely. If he/she exhales forcibly, it may arrest the venous return, assuming competent valves (Fig. 6.5). If the vein is subject also to the pressure waves transmitted from the right atrium, the two sine curves will be superimposed in the PW curve to form a composite wave. The fast curve synchronised with the pulse and the slow respiration curve (Fig. 6.6). The flow modulations caused by pulse and respiration cannot generally be observed in colour duplex.
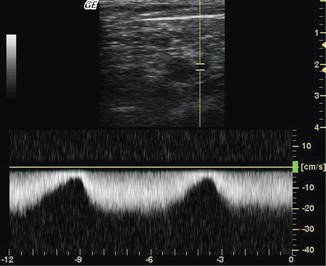
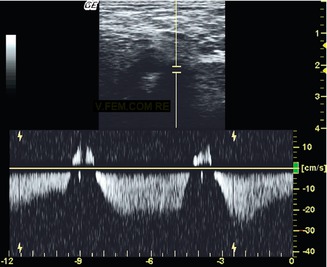
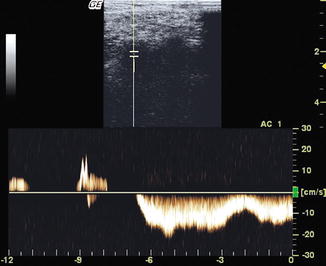
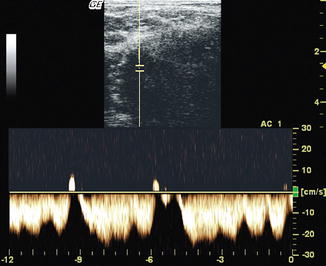
Fig. 6.3
Blood flow (BF) in the right common femoral vein in a supine subject breathing normally, 12 s in display
Copyright: [Author]
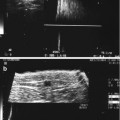
Fig. 6.4
Blood flow (PW) in the right common femoral vein in a supine subject breathing deeply. At the end of inhalation, the blood flow is briefly reversed (peaks), 12 s in display
Copyright: [Author]
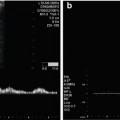
Fig. 6.5
Blood flow (BF) in the right common femoral vein in a supine subject exhaling forcibly. The blood flow stops with two retrograde flow peaks at −12 and −6 s on display. From −6 to 0 s normal respiration resumes
Copyright: [Author]
Fig. 6.6
Blood flow (BF) in the right common femoral vein in a supine subject breathing deeply. The transmitted arterial curve is superimposed on the respiration curve to form a composite wave, 12 s in display
Copyright: [Author]
The velocity profile changes when there is a hindrance to flow above the measurement point. This may be an occlusion caused by thrombosis or external compression of the vein. It may be also an obstruction defined as incomplete closure of the lumen by partial thrombosis or external compression. In the former case, no flow can be measured in the region immediately below the thrombosis. If a diversion route has formed, the flow will behave as an incomplete closure of the vein. This is characterised by a continuous flow pattern without fluctuations in velocity. In the presence of a reduced luminal calibre or a diversion route, the flow will not be influenced by deep inhalation and exhalation (Fig. 6.7).
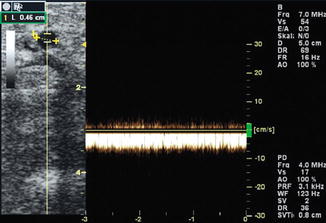
Fig. 6.7
Flow in the cephalic vein when the subclavian vein is nearly occluded. Continuous flow is demonstrated which is not influenced by respiration
Copyright: [Author]
Immediately after the subject lies down, a continuous flow starts in the deep leg veins, often not modulated by respiration, as the volume of blood collected while standing rapidly drains the leg (Fig. 6.8). A proximal constriction can therefore only be assumed after a period of lying down, which is after approximately 1 min. Raising the leg will accelerate emptying and decrease this time period. If the venous return remains unaffected by respiration, then a proximal obstruction of the iliac veins is a distinct possibility.
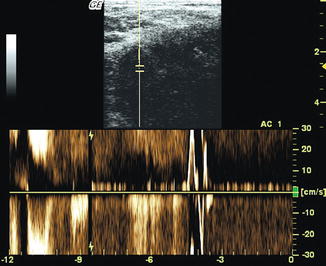
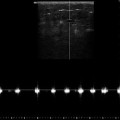
Fig. 6.8
Blood flow (BF) in the right common femoral vein in a healthy test subject who has just laid down after a long period standing; 12 s in display. The blood flows rapidly out of the leg. In the mid-right section of the image, the continuous flow is interrupted at 4 s when the subject coughed briefly
Copyright: [Author]
6.2.2 Standing Subject
Immediately after standing up, no flow is found in healthy leg veins under ultrasound. The venous system has high compliance (Sect. 3.1.2) and can adapt to the increasing volume of blood. It can accommodate a large volume of blood on standing before antegrade flow resumes. On lying down, this reserve empties. When the patient stands up, the venous capillaries and venules are the first ones to fill. When the calf muscle and deep leg veins empty after calf muscle-pump activation, there is no flow initially.
It is only after a time, which varies widely from person to person but has so far not been found to be of pathological relevance, that a slow antegrade flow (towards the heart) is found in the standing subject. This is called “vis a tergo” or “force from behind”. It arises from the pressure of arterial blood transmitted from the capillaries into the full reservoirs in the calf muscle veins (Fig. 6.9). Respiratory modulation is not observed in the standing person breathing normally, but it becomes apparent when he/she breathes deeply.
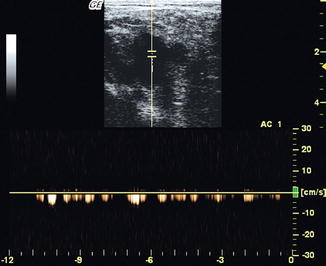
Fig. 6.9
Blood flow (BF) in the right common femoral vein in a motionless standing subject. Continuous slow flow (“vis a tergo”) 12 s on display (normal velocity with 4 s on display on online material)
Copyright: [Author]
6.2.3 Antegrade Flow and Reflux
When walking or when moving the calves and feet, the muscles squeeze the deep veins by segments. They act like a roller pump from the foot upwards pressing the blood up to the heart. In healthy veins return flow is prevented by venous valves. On duplex an antegrade flow towards the heart occurs during the muscular contraction phase (systole) (Figs. 6.10 and 6.11. See also Sect. 3.2.2).
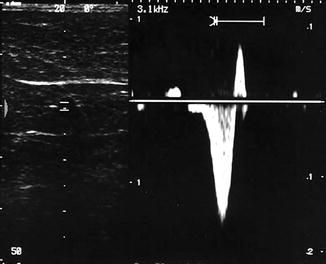
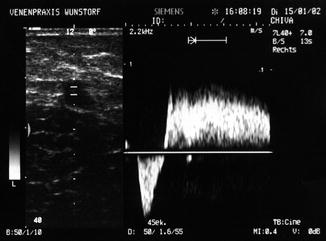
Fig. 6.10
Antegrade flow (downward peak) and a short retrograde flow (upward peak) induced by a manual compression and release manoeuvre of the calf in a competent great saphenous vein. Valve closure limits the duration of retrograde flow
Copyright: [Author]
Fig. 6.11
Antegrade flow (downward peak) and retrograde flow (reflux) induced by a manual compression and release manoeuvre of the calf in an incompetent great saphenous vein. Reflux duration is prolonged because the valves are incompetent
Copyright: [Author]
Once the muscular contraction is relaxed, the action of pressing the blood towards the heart ceases. If the blood returns down towards the feet under the effects of gravity, a flow towards the probe is recorded. An upwards flow curve or peak is seen on duplex. If the valves close, this flow stops very quickly (Fig. 6.10). If the valves do not close, “reflux” occurs when the blood flows towards the feet for a longer period (Fig. 6.11). This reflux is reported to last 0.5–1 s, depending on the research group (Coleridge-Smith et al. 2006). A duration of 1 s as a cut-off point between normal and pathological saphenous reflux will avoid a possible grey zone of false-positive findings.
6.3 Valsalva Manoeuvre
In the Valsalva manoeuvre, the patient inhales deeply, holds his/her breath and then creates pressure in the abdomen by contracting the abdominal muscles without exhaling. This increases the pressure in the inferior vena cava, which in turn has an effect on hampering the venous return. It is this effect which is measured. The venous system in the legs is a low-pressure system (see also Sect. 3.1.2). If the venous return is challenged by an outflow resistance, like a Valsalva manoeuvre, then antegrade flow ceases. If the venous valves are incompetent, then the blood would run back into the leg veins.
The Valsalva manoeuvre can therefore produce the following results:
Get Clinical Tree app for offline access
Suspension of blood flow if the valves are competent (Fig. 6.12a).
Brief reversal of flow due to the blood flowing back out of the abdomen. This reversal of flow causes the valve above of the measurement point to close. By definition, the reverse flow must last longer than 0.5–1 s, to be pathological (Fig. 6.12b).
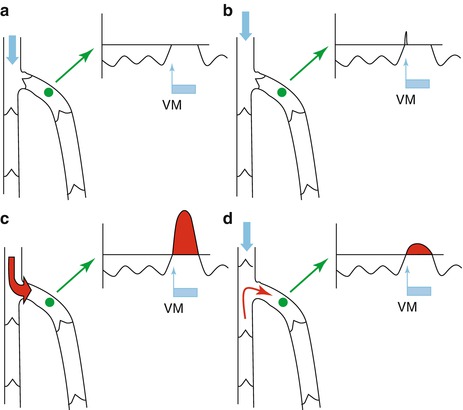
With incompetent (non-closing) valves, the reverse flow will last as long as the patient exerts pressure (Lattimer et al. 2012) (Fig. 6.12c, d). The flow reversal is clearest if there are no competent valves proximal of the measurement point. In this situation the whole volume of blood from the upper vein segments can reflux back into the segment under examination (Fig. 6.12c). If there is a competent valve proximal of the segment under evaluation, the volume of reverse flow will diminish (Fig. 6.12d). This is frequently the case when the small saphenous vein is assessed using a Valsalva manoeuvre.
Fig. 6.12
(a) Left: Diagram of the common femoral vein and its junction with the great saphenous vein. Right: Doppler curve of the blood flow in the great saphenous vein measured at the green point. The flow curve, modulated by respiration, is interrupted during the Valsalva manoeuvre. The broad blue arrow represents the increased intra-abdominal pressure transmitted to the common femoral vein. The blue rectangle represents the duration of the Valsalva manoeuvre. (b) Flow curve with a competent valve at the saphenofemoral junction. There are no competent valves above the saphenofemoral junction. The broad blue arrow represents the pressure in the deep veins. A small amount of blood enters the great saphenous vein causing the valve to close. The measurable reverse flow in the great saphenous vein lasts for less than 1 s. No flow is measured for the remaining time that the patient maintains the pressure. (c) Flow curve with an incompetent valve at the junction with the great saphenous vein. There are no incompetent valves above the saphenofemoral junction. The red arrow represents the origin and direction of the blood flow, shown in the curve as reverse flow above the zero line (red area) (see also Fig. 4.2). (d


Related posts:
Stay updated, free articles. Join our Telegram channel
Full access? Get Clinical Tree
