Fig. 1.1
(a) Important characteristics of sound waves. (b) The resolution depends also on the width of the sound wave front entering the tissues. This is determined by the depth adepth of the entering column of sound travelling along the z-axis (elevation plane, perpendicular to the surface of the transducer). The focus is normally set at a fixed depth by a rigid acoustic lens
Copyright: [Author]
The amplitude provides information about the reflective properties of tissue. The stronger the amplitude of the reflected echo, the brighter the corresponding pixel within the image point in the image. It can be likened to the contrast of the image.
Spatial resolution describes the ability to discriminate between two neighbouring points in the image. There are two types of spatial resolution. Axial resolution means the separate representation of two neighbouring points in the direction of the sound wave. It represents depth resolution. Lateral resolution means the separate representation of reflecting points at right angles to the sound wave. It represents the minimum distance between points at the same depth. Temporal resolution means discrimination of the same point between 2 time points.
The z–plane or elevation plane refers to the width of the sound wave front going into the tissues along the z-axis (Fig. 1.1b).
The transmit frequency controls the resolution of the image. With low transmit frequencies, blood appears to be echo-free and black. With increasing frequencies, aggregates of erythrocytes become visible as flowing, echogenic reflections. This is called spontaneous natural contrast.
The higher the transmission frequency, the shorter the wavelength and the better the spatial resolution. However, a higher transmit frequency is at the cost of a greater attenuation. This limits the penetration depth both for B scan ultrasound and especially for Doppler ultrasound, since the latter uses higher frequencies. Thus, the higher the frequency, the better the resolution, but the less the penetration.
When examining peripheral veins, it is advisable to use probes with different frequencies. In general, transmission frequencies between 5 and 15 MHz cover most eventualities. Frequencies between 5 and 7.5 MHz are the most popular.
Image resolution depends also on focusing of the sound waves, just like a torch. Adjusting the focus improves the brightness and clarity of the region of interest.
Sound waves are propagated by compression and expansion of the molecules in the medium through which the sound is transmitted. When the acoustic properties of the tissue change as the acoustic wave front advances, sound waves are reflected back as echoes. This process takes energy away from the advancing front (Fig. 1.2a). Consequently, the sound loses intensity exponentially as it progresses deeper into the tissues. This can be compensated to a certain degree by amplifying the receive signal strength by the machine (Fig. 1.2b).
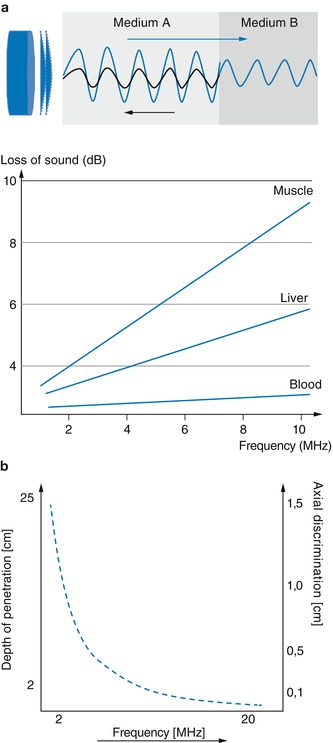
Fig. 1.2
(a) Loss of sound energy due to changes in the acoustic properties of tissue (medium A, B). The transmitted sound wave is shown in blue and its partial reflection in black. The graph shows that the loss of sound in muscle tissue is significantly higher than that of liver or blood. (b) Diagram showing the inverse relationship between the transmission frequency and the penetration depth achievable. It also shows the direct relationship between frequency and point-to-point resolution
Copyright: [Author]
B scan (B = brightness) is imaging of the acoustic boundary surfaces or interfaces. Fluids are echo-free and thus appear black. Different tissues appear in distinguishable shades of grey depending on their different acoustic properties. Bone tissue is echo-dense and therefore reflects all the sound wave. Therefore, bone contours appear as a white line behind which everything is black since no further echoes can penetrate. This is called the acoustic shadow.
Changes to echoes along a scan line over time can be shown in M mode (M = motion). Here the screen is split. Half is used for the B scan along the scan line, and the other half shows a continuous recording of the changes in echo amplitude over time. This mode is recommended for moving objects, particularly for examining the heart muscle and its valves. In the venous system it has been used for assessing the compressibility of a vein segment (Fig. 5.10).
B-Mode artifacts
The brighter the dots in the image, the greater the amplitude of the echo reflected by the tissue and the less the energy available to insonate the tissues behind. With complete reflection, there is no onward penetration. For example, no acoustic information can be seen behind calcifications (Fig. 1.3a) and weakened behind complex echogenic structures (Fig. 1.3b). As almost no energy is lost in fluids, the sound energy distal to cystic spaces is higher than in the surrounding tissues. This explains the paradox of an apparent strengthening of the signal (Fig. 1.3c, d).
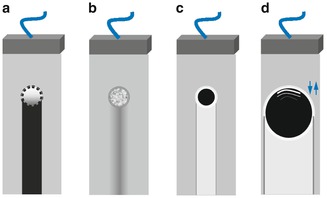
Fig. 1.3
Diagram of the important behavioural characteristics of ultrasound: (a) Acoustic shadow behind a calcified artery due to the complete lack of sound wave penetration. (b) Weakening of the sound wave behind a strongly echogenic tissue such as a lipoma. (c) Strengthening behind a small vein or cyst. (d) Strengthening behind a large vein or cyst with sound elimination at the lateral margins due to a deflection artefact (arrows). These are shown as grey vertical lines. The anterior vessel wall echo is projected into the lumen to give a false impression of intraluminal pathology. These reflections are seen as white lines in the upper part of the vein/cyst
Copyright: [Author]
In larger cysts or vessels, the signal may be eliminated deeper when the sound wave front breaks against the lateral cyst or lateral vein borders. This is known as a reflection artifact (lateral edge shadow). Repeated mirroring originating the layers of the anterior vein wall often causes a reverberation artifact. This happens when the anterior echogenic wall is projected in the lumen. This may be confused with intraluminal pathology (Fig. 1.3d).
1.1.2 Measurement of Flow Velocities
Doppler ultrasound assessments of blood flow are based on frequency and phase analysis. To reach the required signal strength, lower frequencies are used in pulsed and colour Doppler than those in B scans. For a B scan frequency of 7.5 MHz, the frequency used for colour Doppler ultrasound is usually 5 MHz.
Detection of blood flow is based on the Doppler principle. Sound waves are reflected from moving intraluminal echoes, namely, the red blood cells. Just as the frequency of the siren of an ambulance increases as it approaches, and diminishes after it has passed, the frequency of the echo from the flowing blood alters according to its velocity and direction. The faster the blood is flowing, the greater the difference between the transmitted and received frequency.
This difference is known as the Doppler shift frequency. The frequencies of the change in signal can be displayed graphically as a spectral curve against time. If the angle between the vein or more correct the vector of the moving blood cells and the axis of the sound is known, the machine can calculate the flow velocity (Fig. 1.4).
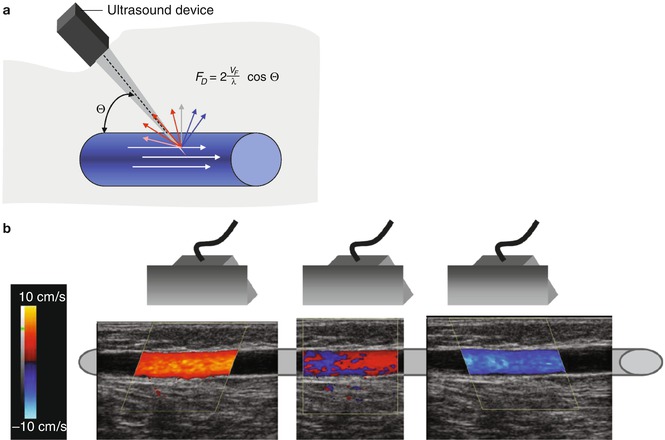
Fig. 1.4
(a) The Doppler equation of frequency shift. The Doppler angle or angle of insonation Θ is the angle between the axis of the direction of flow in a vein and the angle of incidence. The formula for the frequency shift F D is shown where λ = wavelength and V F = transmission frequency. (b) The direction of flow is represented by a colour. This depends on the position of the probe and the direction selected which is identified by the colour bar. The colour at the top of the colour bar shows the code for flow towards the probe (red). The example shows a longitudinal examination of a great saphenous vein refluxing from left to right. Blood flows towards the probe (red), past the probe (mixed) and away from the probe (blue)
Copyright: [Author]
The sensitivity for detecting blood flow depends on three factors: (1) the emitted acoustic energy; (2) the frequency where the lower the frequency, the greater the penetration but the poorer the resolution; and (3) mainly the angle of insonation and the blood vessel (Fig. 1.4a). The accuracy of the velocity measurement depends on the angle of insonation. Angles > 60° do not produce an accurate velocity measurement. If the sound waves meet the blood stream at right angles with a Doppler angle of 90°, then the machine will not be able to detect any movement because the shift frequency will in theory be zero (Fig. 1.4b). The closer the angle is to 0°, the more reliable the velocity measurement will be.
The loss of energy with depth (Fig. 1.2b) is one of the factors hampering sensitivity. This is especially important when measuring slow flow or small volume flows. The sensitivity at greater depths can be improved by increasing the gain, by changing to a lower frequency probe or by switching to power Doppler. The sensitivity can be improved greatly by administering an contrast agent.
1.1.3 Continuous, Pulsed and Power Modes
If a continuous Doppler signal is transmitted and received, the movements of blood corpuscles can be detected along the transmission axis. This is represented graphically as a frequency analysis. The depth cannot be determined in continuous mode. This continuous wave (CW) Doppler is used in pen-probes or pocket Doppler machines (Fig. 1.5).
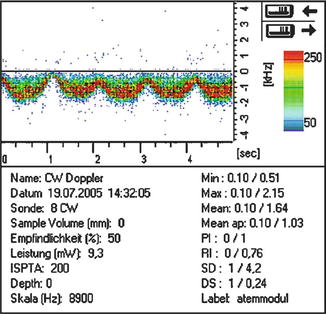
Fig. 1.5
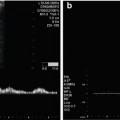
Spectral curve with CW Doppler measuring flow in the common femoral vein of a lying patient. The pen-probe is held at an angle with the head pointing upwards and therefore away from the direction of flow. The sound can be heard on the online material, together with an example of reflux and turbulence in the great saphenous vein of a standing patient (Manfred Stimal, Reinfeld; by kind permission)
Copyright: M. Stimal
Unlike CW, the pulsed wave (PW) Doppler uses intermittent transmission of sound waves. The reflected waves are received in the interval between two pulse transmissions and then compared with the transmission frequency. The signals are analyzed in a defined window of time corresponding to a specific depth. This interval is defined in advance by the examiner and corresponds to the sample volume in the vessel. In B scan this measurement area is shown between two parallel cursor lines (Fig. 1.6). The distance between these cursor lines is termed the gate.
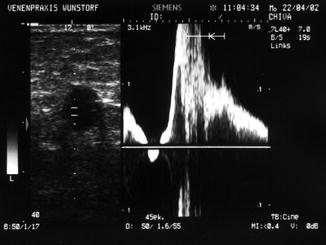
Fig. 1.6
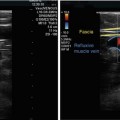
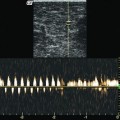
Transverse view through the left thigh demonstrating PW duplex of the great saphenous vein. The probe is held at a slight angle upwards. The left half shows the echo-free lumen in B scan with the sample volume between the parallel cursor lines. The right half shows the spectral curve consisting predominantly of reflux
Copyright: [Author]
In colour duplex ultrasound, the Doppler shift frequency is measured by PW at every point selected within the colour box. The colour coding defines the direction of flow in relation to the position of the probe. Red indicates flow towards the probe while blue indicates flow away from the probe (Figs. 1.4b and 1.7). Although the colour coding can be changed by the operator, standard convention dictates that red is flow towards the probe. The colour in the upper half of the colour bar on the screen always defines the colour of flow towards the probe. The brighter the colour, the higher the frequency shift, the greater the flow velocity.
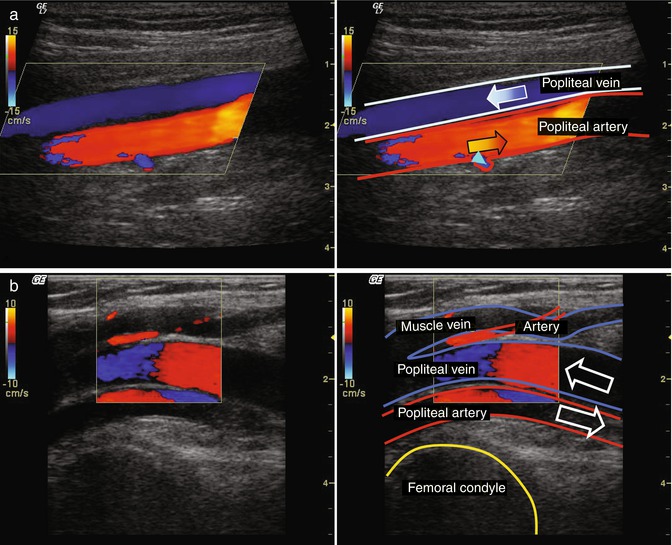
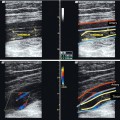
Fig. 1.7
Direction or phase. The colour bar in the top left of the screen codes the flow direction. The red (+) indicates flow towards the probe. The blue (−) indicates flow away from the probe. (a) Longitudinal view through the popliteal region with the popliteal artery and vein. The flow in the vein is going away from the probe and is therefore coloured blue. The flow in the artery is coming towards the probe and is therefore shown red. There is a minor artery branching upwards in which the flow is away from the probe and which therefore also appears blue (light blue arrow head). (b) Colour switch in an artery and vein where the vessel curves. Longitudinal view with the knee partially flexed. The popliteal artery and vein come to the surface, towards the probe, as they leave the calf, and run deeper again, away from the probe, as they enter the thigh. There is therefore a switch in the colour on ultrasound in both vessels. There is typically a thin black line between the colours where no velocity is measured because the blood runs parallel to the probe. Occasionally its dark blue or dark red indicating a slow flow in relation to the probe. Furthermore, the filter frequently excludes the perpendicular flows typical in a colour switch when the Doppler angle is about 90°. This is in contrast to the rapid flow of aliasing (Fig. 1.9b), when the colour in the area of the switch is yellow, white or light blue (see accompanying online material)
Copyright: [Author]
In power Doppler mode, neither direction nor velocity information is shown (Lamboul et al. 2009). Instead the power of the Doppler shift frequencies is shown in monochrome. The advantage is greater sensitivity in visualising slow velocities with an unfavourable angle of insonation (Fig. 1.8a). The power is derived from a greater sensitivity at recording the amplitude of the echoes. Consequently flow looks brighter and it is the best way of imaging vascularity. It is not prone to aliasing because it only indicates the presence of flow and cannot measure velocity. Some equipment suppliers combine information on the amplitude of the Doppler signal with its frequency, so as to combine the advantages of direction recognition with the high sensitivity of the power Doppler (Fig. 1.8b).
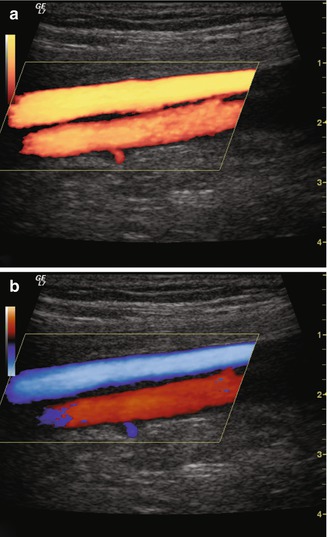
Fig. 1.8
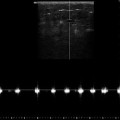
Power Doppler. (a) Power Doppler of the same popliteal region as in Fig. 1.7a without information on flow direction. Flow is visualised as a brighter image. (b) Bidirectional power Doppler. The increased sensitivity of the power Doppler is complemented by information on flow direction
Copyright: [Author]
1.1.4 Aliasing
Related posts:
 Examination of Superficial Veins in the Presence of Deep Venous Disease
 Duplex Ultrasound Examination of Superficial Leg Veins
 Flow Provocation Manoeuvres for the Diagnosis of Venous Disease Using Duplex Ultrasound
 Examination of the Small Saphenous Vein
 Examination of the Great Saphenous Vein
 Anatomy of the Superficial Veins
Stay updated, free articles. Join our Telegram channel

Full access? Get Clinical Tree


