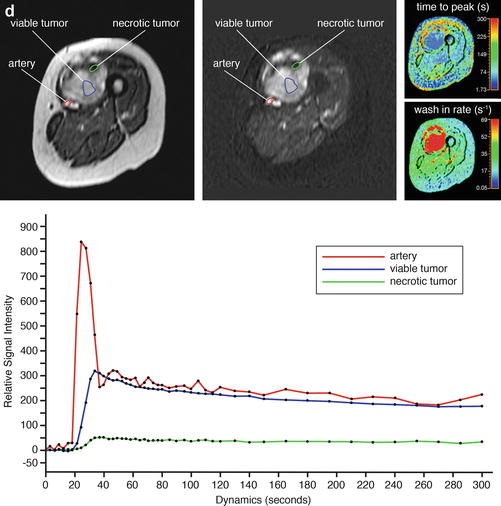
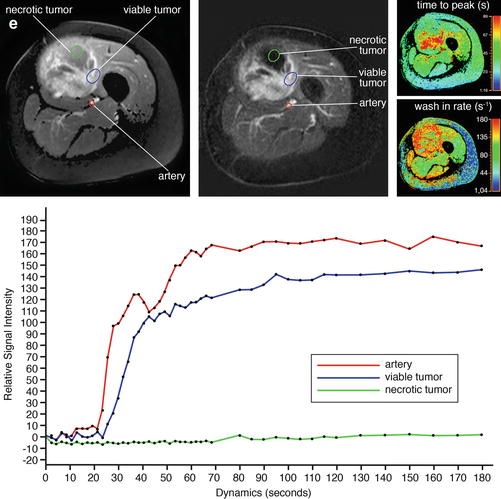
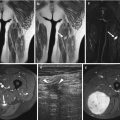
Fig. 26.1
Adult patient with synovial sarcoma medial to the femur with central necrosis diagnosed on the resected specimen. T1- (a) and T2-weighted frequency-selected fat-suppressed (b) and T1 fat-suppressed Gd-enhanced static (c) axial images show the tumor with centrally less enhancement. On this panel parametric images (d) obtained during dynamic Gd-enhanced data acquisition with a temporal resolution of 3 s and processed with ISP software package (Philips) are displayed. Upper left is one of the enhanced images, upper middle the electronically subtracted image, upper right time to peak, and lower right the wash-in rate. Below the images, a time-intensity curve is exhibited (horizontal axis time, vertical axis relative signal intensity). Artery, viable, and necrotic tumors are labeled. Following neoadjuvant chemotherapy, the same parameters are displayed (e). Note that the necrotic central area has increased (subtraction images), the time to peak has become longer, and the wash-in rate has decreased. Following resection the patient had a recurrent mass which has high signal intensity and fluid-fluid levels on the T2 fat-suppressed image (f), and on the static Gd-enhanced images (g), no central enhancement is observed. On the parametric images (h), no enhancement is observed on all parametric images nor on the time-intensity curve. A large hematoma without viable tumor was evacuated
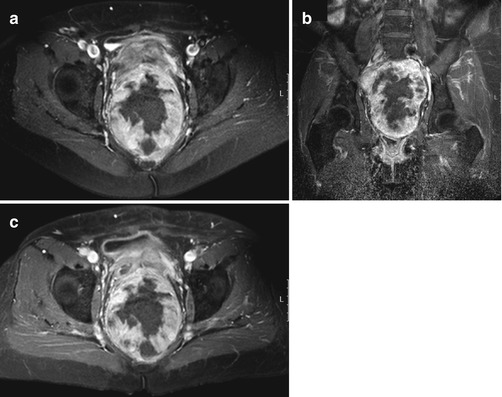
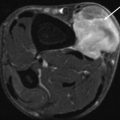
Fig. 26.2
A 64-year-old patient with solitary fibrous tumor; following presurgical radiation therapy, 50 % of the tumor was necrotic. Axial (a) and coronal (b) Gd-chelate-enhanced fat-suppressed T1-weighted images show the tumor in the pelvis. Enhancement is mainly seen in the periphery. Following radiation therapy (c), little change is seen on the axial fat-suppressed Gd-enhanced static image. On this panel parametric images (d) obtained during dynamic Gd-enhanced data acquisition with a temporal resolution of 3 s and processed with ISP software package (Philips) are displayed. Upper left is one of the enhanced images, upper middle the electronically subtracted image, upper right time to peak, and lower right the wash-in rate. Below the images is a time-intensity curve (horizontal axis time, vertical axis relative signal intensity). Artery, viable, and necrotic tumors are labeled. Following radiation therapy, the same parameters are displayed (e). Note that the time-intensity curve of the peripheral enhancing part has decreased relative to the arterial curve. Time to peak has increased, while only minor change is seen for the wash-in rate
Therapy-induced changes in capillary permeability (time-intensity curve analysis, quantification of Ktrans) and vascular density (maximal enhancement) are often observed before changes in tumor volume. Direct visual inspection of the (subtraction) images before and after chemotherapy allows easy detection of highly vascular and/or highly perfused viable tumor tissue. Alternatively parametric analysis (see Chap. 5) using dedicated software can be used [19, 20]. When more than 10 % of the total tumor volume enhances early (defined as enhancement within 6 s after arterial enhancement), a poor response with more than 10 % of tumor tissue remaining viable should be suspected. Several pitfalls have to be avoided. Young granulation tissue at the margins of necrotic tumor may enhance early. Arterioles or small physeal vessels enhance early as well. Spatial resolution is a limitation. Tumor nests smaller than 3–5 mm2 cannot be depicted.
Diffusion-weighted MR imaging with high b-values has potential in assessing the chemotherapeutic response of soft tissue sarcoma [12, 15, 21–23].
An increase in diffusion reflected by increasing apparent diffusion coefficient (ADC) values of sarcoma after chemotherapy corresponds to cell death (disintegration of cell membranes) and reduction in tumor cell density. Early response to chemotherapy may, however, result in a decrease of diffusion caused by dehydration, congestion, and decreased capillary permeability. It is still unclear which method of determining changes of ADC values over time is appropriate for soft tissue sarcoma. Increase of the minimum ADC value seems to correlate better with good response than increase of the average ADC ratios [21].
The value of color Doppler ultrasonography with spectral analysis has been demonstrated in patients with bone and soft tissue sarcomas as long as there is a soft tissue mass. Blood flow parameters that can be measured by spectral analysis include peak velocity, mean velocity, volume flow rate, pulsatility index, and resistive index ([peak systolic velocity/end-diastolic velocity]/peak systolic velocity) [18, 24, 25]. Response to neoadjuvant chemotherapy can be reliably predicted after two cycles, but not sooner. In a good respondent, a vascular tumor with low vascular resistive index in feeding arteries changes into a system with an increased or even normalized resistive index and decreased flow and shunting in the tumor. In good respondents, the resistive indices calculated in the tumor-feeding artery are almost equal to the resistive indices in the contralateral reference artery. Apparently, increase of peripheral resistance corresponds to the reduction or disappearance of intratumoral high-velocity Doppler shifts, which indicates the reduced need for attracting blood from the host’s circulation in chemotherapy-sensitive tumors [26].
Early studies demonstrate the potential of Doppler ultrasonography with microbubble-based contrast agents in evaluating tumor response to chemotherapy. A decrease of contrast uptake the day after isolated limb perfusion with high-dose chemotherapy and tumor necrosis factor has been reported to correlate with a favorable histologic response. No ultrasound parameters have been reported that can predict the response to therapy before the start of treatment.
There have been conflicting reports on the usefulness of glucose metabolism imaged by 18F-deoxyglucose positron emission tomography (18F-FDG-PET) as a parameter to assess response to chemotherapy in sarcoma [27]. Following chemotherapy, the standardized uptake value (SUV) decreases. Most studies report a larger decrease of SUVmax in responders as opposed to nonresponders [28–33]. Most studies are in heterogeneous populations of bone and soft tissue sarcoma. It seems that metabolic tumor volumes are a better target than SUVmax values. Differences in metabolic volume, defined as the number of voxels within the volume of interest that have an uptake greater than that of the chosen background threshold, have been reported to correlate better with response [29]. This tumor component correlates with the viable tumor as defined by early enhancement on DCE MRI and seems a promising venue of further research.
With the advent of insights in analyzing metabolic tumor volume or residual viable tumor using various SUV parameters and the rise of reliable commercial software packages to quantify DCE MRI, it is too early to define the clinical role of these techniques [27]. For the time being, we still rely on DCE MRI in combination with high-resolution MR to monitor response and, at the same time, to identify viable tumor nests before surgery. It is likely that with the advent of targeted predominantly cytostatic, metabolic, and angiogenesis-inhibiting cancer treatments, 18F-FDG-PET will take a prominent place together with other PET tracers requiring cyclotron, DCE MRI, and ultrasonography in monitoring and guiding treatment. The combination of several techniques, displaying various characteristics of tumor phenotype in 4D, is likely to be the future. This requires advanced automated analysis of large data sets.
26.4 Locoregional Recurrence
The benefit of early detection of local recurrence depends on the availability of therapeutic options that can prolong survival. Radical compartmental resection with or without adjuvant radiotherapy and/or chemotherapy may provide long-term salvage in patients with a local recurrence of soft tissue sarcoma [34]. The risk for local recurrence depends on tumor site, size, grade, and adequacy of surgical margins. Although about 2–20 % of all resections will have positive margins and thus increased risk for local recurrence, its impact on overall survival remains controversial [1, 4, 35].
Several guidelines have been recommended for the follow-up of soft tissue sarcoma consisting of a combination of clinical history, physical examination, blood tests, chest radiographs, CT, and MR imaging [36–42]. The ACR advises MR follow-up at least twice a year during the first 5 years after treatment of the primary tumor and once a year 5–10 years after treatment. The ESSR and ESMO advocate 3–4 MRs during the first 2–3 years in intermediate- or high-grade sarcomas and 2–3 MRs during the first 3 years in low-grade sarcomas. An MR once a year 5–10 years after primary treatment is also advocated by ESSR [34, 43–47]. Most institutions rely on consensus-based guidelines due to the absence of evidence-based guidelines. Surveillance strategies that, through early detection and treatment, improve survival and quality of life while minimizing costs have yet to be identified in randomized clinical trials. Only few studies have been reported on the efficacy of surveillance strategies for the follow-up of soft tissue sarcoma [37, 38, 48]. According to Whooley et al., clinical assessment and physical examination are the most useful tools for evaluating locoregional recurrence, whereas routine MR imaging of the primary tumor site and laboratory blood tests appear ineffective strategies. In a retrospective review of 141 patients, they detected by routine annual imaging only one asymptomatic local recurrence; all others were found on physical examination of the primary site [37, 48]. However, MR imaging has shown to be useful in patients in whom physical examination is hampered due to radiotherapy changes.
When indicated, MR imaging is the most useful technique for identifying suspected local recurrence or residual disease after incomplete resection [34, 49]. An MR using a T2-weighted sequence with frequency-selective fat saturation or short tau inversion recovery (STIR) or Dixon sequence with water reconstruction is considered to be the most useful first step for detecting recurrent tumor (Fig. 26.3). The morphology of the lesion and the signal intensity contribute to the definition of its character. Low signal intensity on T2-weighted images or diffuse high signal intensity on T2-weighted images excludes tumor recurrence in 99 % of patients. Mature scar tissue usually exhibits low signal intensity (Fig. 26.4) because of its fibrous tissue content, as described in previous studies. Diffuse high signal intensity with a feather-like appearance, without mass effect, generally represents post-therapy change or inflammation. High signal intensity mass-like lesions on T2-weighted images require further examination with intravenous Gd-chelates [50].
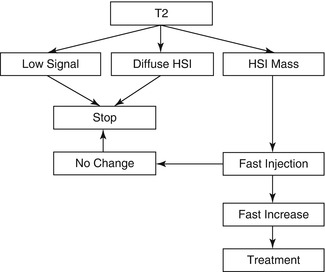
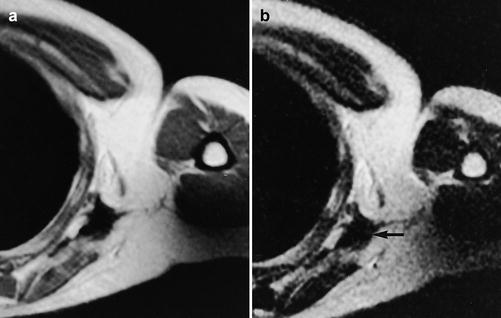
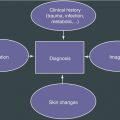
Fig. 26.3
Flowchart of MR imaging in the follow-up of aggressive soft tissue tumors
Fig. 26.4
(a, b) Malignant soft tissue tumor studied after surgery and radiotherapy in a 30-year-old male: (a) axial T2-weighted MR image shows low signal intensity (arrow) indicative of no recurrence; (b) the scar also has low signal on T1-weighted MR image
Fat-suppressed T1-weighted fast spin echo sequences after Gd-chelate injection can be used to distinguish non-enhancing post-therapy hygroma, seroma, or hematoma from enhancing tumor recurrence, post-therapy fibrosis, granulation tissue, or inflammatory masses (Fig. 26.5). The T1 fat-suppressed images obtained after administration of the contrast agent should be compared to subtraction images (for instance, obtained in the dynamic sequence, see below) or to pre-contrast T1 fat-suppressed images to correct for pseudo-enhancement caused by scaling effects. Absence of contrast enhancement excludes recurrent tumor. On these standard contrast-enhanced images, the differentiation between recurrent viable tumor and post-therapy fibrosis or inflammatory pseudomasses may remain difficult. However, in these cases dynamic contrast-enhanced MR imaging may prove helpful [34, 51]. Dynamic contrast-enhanced MR imaging allows differentiation between inflammation and recurrent or residual tumor. After a rapid bolus injection of contrast, viable tumor exhibits rapid progressive increase of signal intensity followed by washout or plateau phase, whereas the signal from inflammatory changes will also increase but later [52] (Fig. 26.6). The exception is young granulation issue and reactive changes secondary to surgery or radiation within the last 6 months.
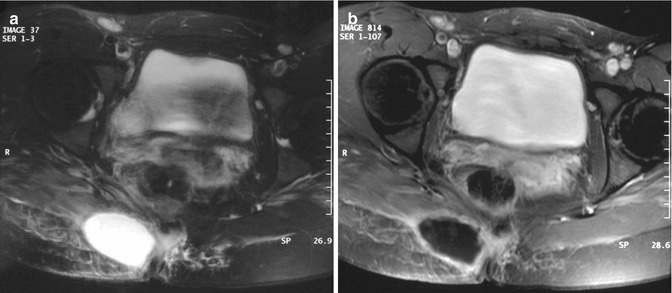
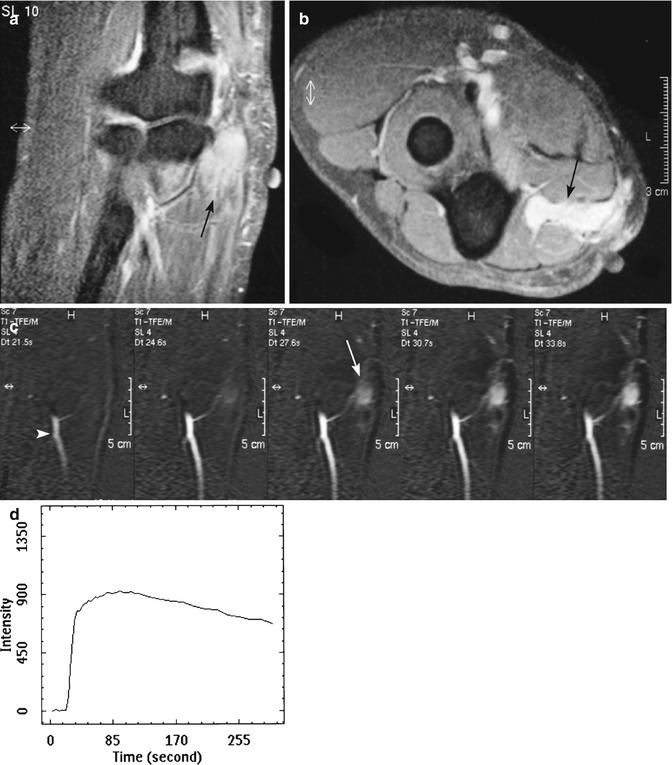
Fig. 26.5
(a, b) Three months after resection of desmoid-type fibromatosis of the pelvis in a 26-year-old female: (a) axial T2-weighted MR image shows a well-defined mass with homogeneous high signal intensity; (b) on axial fat-suppressed T1-weighted MR image after intravenous administration of gadolinium, chelate is only a small rim of enhancement seen consistent with a postoperative seroma that resolved spontaneously
Fig. 26.6
(a–d) Fifteen months after resection and radiotherapy of a liposarcoma of the elbow in a 25-year-old male: (a, b) coronal and axial fat-suppressed T1-weighted MR image after gadolinium chelate shows an ill-defined homogeneous enhancing soft tissue mass (arrow). Markers on the skin demonstrate the surgical scar; (c) coronal consecutive dynamic contrast-enhanced subtraction images of the same level obtained with a temporal resolution of 3 s. Tumor enhancement (arrow) is seen 3 s after arrival of the bolus contrast in the artery (arrowhead) suggestive of tumor recurrence; (d) time-intensity curve of a region of interest in the soft tissue mass demonstrating rapid progressive enhancement followed by a washout phase. Histologic examination after Tru-Cut biopsy showed recurrence of liposarcoma
Diffusion-weighted imaging has potential in adding specificity in the diagnosis of recurrent tumor. Preliminary studies have shown a statistical difference between recurrent tumor and nonneoplastic masses secondary to earlier treatment [34, 51].
Each case of a suspicious (recurrent) mass should be treated as if it is a new sarcoma. Confirmation should be obtained by cytological sampling or core-needle (Tru-Cut or Jamshidi) biopsy after locoregional restaging by MR imaging. Histological biopsy should always be performed after MR imaging because reactive changes, hemorrhage, and edema secondary to biopsy may hamper interpretation of MR images and therefore interfere with staging.
Preliminary studies of positron emission tomography (PET) demonstrate the potential of PET with FDG as an additional tool for detecting local recurrence of soft tissue sarcoma. Moreover, PET seems particularly useful in patients with extensive histories of surgery and radiation therapy, in the setting in which MR imaging interpretation can be difficult [53, 54]. The caveat here is that a negative PET-CT can only be used to exclude recurrence, if the initial tumor accumulates sufficient FDG.
Desmoid-type fibromatoses are benign fibroblastic proliferations that arise in the deep soft tissues and are characterized by infiltrative growth in the surrounding soft tissue structures and the absence of a pseudocapsule. Because of this growth pattern, local recurrence after surgery is virtually unavoidable. Routine follow-up MR imaging of patients with desmoid-type fibromatosis seems justified not only to detect (often asymptomatic) local recurrence but also to evaluate the natural behavior of these lesions as they change from cellular active lesions toward mature, collagenous inert lesions [55] (Fig. 26.7).
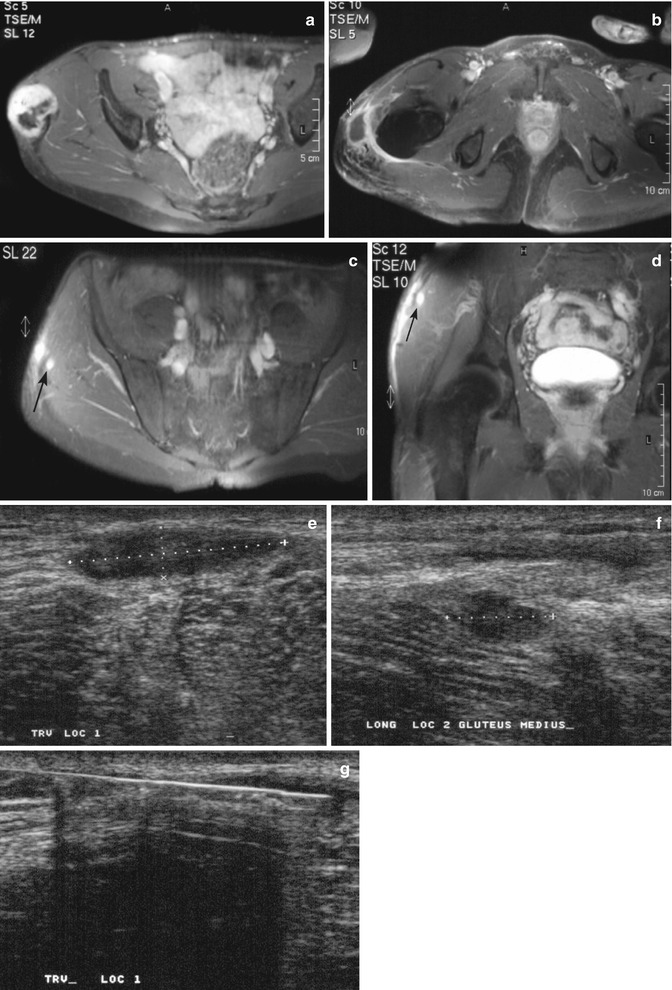
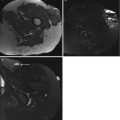
Fig. 26.7


(a–g) Desmoid-type fibromatosis in the thigh in a 47-year-old male: (a) axial fat-suppressed T1-weighted MR image after gadolinium chelate. The relatively well-defined soft tissue mass shows inhomogeneous enhancement. The non-enhancing area demonstrated low signal intensity on all pulse sequences; (b) 3 months after resection, axial fat-suppressed T1-weighted MR image after gadolinium chelate reveals a postoperative seroma; (c, d) 12 months after resection, axial and coronal fat-suppressed T1-weighted MR image after gadolinium chelate. Spontaneous regression of the postoperative seroma but appearance of new small intramuscular enhancing nodules suggestive of multifocal recurrence (arrow); (e, f) the nodules were identified on ultrasound as hypoechoic soft tissue masses; (g) ultrasound-guided histological Tru-Cut biopsy was performed and recurrence of desmoid-type fibromatosis was confirmed
Related posts:
Stay updated, free articles. Join our Telegram channel
Full access? Get Clinical Tree
