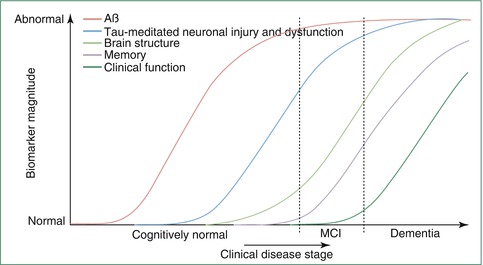
Fig. 20.1
Top panel: voxel-wise maps of gray matter volume reductions in a group of MCI subjects (N = 69) and a group of AD patients (N = 28), respectively, compared to the same group of healthy age-matched controls (N = 95); statistical threshold set at p < 0.01, false discovery rate corrected (Based on data published in Grothe et al. (2012); MRI images retrieved from publicly available database: www.oasis-brains.org). Bottom panel: drawings of the Braak staging scheme of neurofibrillary pathology in AD (Adapted from Braak et al. (1993) with permission to reprint granted by S. Karger AG, Basel). Note that voxel-wise pattern of gray matter atrophy in MCI and AD resemble the “limbic” and “neocortical” stages of neurofibrillary degeneration, respectively, as outlined by Braak et al.
20.2.1.3 Advanced Image Analysis
Based on improving hard- and software resources, increasingly sophisticated computational methods for image processing and analysis are being developed that allow the automated segmentation and detailed subfield analysis of the hippocampus and other ROIs in large imaging datasets (Van Leemput et al. 2009; Wang et al. 2009b; Leung et al. 2010; Heckemann et al. 2011). Modern computational methods demonstrate high anatomic accuracy of the segmented volumes when compared to manual volumetry techniques (Klein et al. 2009; Leung et al. 2010) and even allow for the detailed structural analysis of brain regions that are less amenable to manual delineation. The overarching principle behind the majority of these approaches is the use of high-dimensional image deformation algorithms. Different from the classic VBM analysis, these deformation-based approaches employ hundreds of thousands of nonlinear parameters to warp the individual brain images into the reference space, yielding a highly exact match to the template image and thereby eliminating spatial differences among the individual scans. The information on interindividual spatial variability then resides entirely in the deformation functions themselves, rendering the differentiation in global and regional effects obsolete. This opens the way for the high-resolution study of anatomical details by direct extraction of volumetric information from the individual deformation fields or by automated segmentation of the individual brains into structural or functional ROIs based on inverse warping of detailed atlases in the template space.
Subregional analysis of hippocampal shape revealed a selective atrophy of the CA1 and subicular subfields at preclinical and predementia stages of AD, while atrophy was found to aggravate and to spread to CA2-3 subfields as subjects progressed to clinically manifest AD (Csernansky et al. 2005; Apostolova et al. 2010; Hanseeuw et al. 2011; Achterberg et al. 2013). This selective involvement of hippocampal subregions is in good accordance with patterns of neuronal cell loss described by detailed histopathology and a similarly coherent pattern of selective atrophy could also be demonstrated for the subnuclei of the amygdala (Cavedo et al. 2011).
While MRI research on structural brain atrophy in AD generally focuses on the MTL and neocortical regions, the involvement of subcortical nuclei across disease stages is less thoroughly explored. This is surprising given the prevalent neuropathological evidence of selective involvement of specific subcortical areas, most notably the monoaminergic brainstem nuclei (Lyness et al. 2003; Grinberg et al. 2011; Braak and Del Tredici 2012) and the cholinergic neurons of the basal forebrain (Bartus et al. 1982; Mesulam et al. 2004), and may be partly explained by technical issues associated with subcortical in vivo volumetry. The complex anatomy of the basal forebrain and the indistinguishability of cholinergic cells on normal MRI scans place important constraints on the in vivo structural analysis of cholinergic degeneration in AD (Huckman 1995; Hanyu et al. 2002). However, the recent development of cytoarchitectonic maps of the cholinergic nuclei in MRI standard space, based on combined histology and postmortem MRI (Teipel et al. 2005; Zaborszky et al. 2008; Kilimann et al. 2014), now renders the cholinergic basal forebrain amenable to in vivo volumetry by the use of advanced computational methods for automated regional volume extraction. Using such an approach the selective involvement of different cholinergic nuclei across disease stages could be studied in vivo. A progressive and differential decline in volume of the cholinergic subnuclei was found across the spectrum from normal aging over MCI to AD, resulting in severe atrophy of the nucleus basalis of Meynert in patients with mild to moderate AD which was comparable in magnitude to atrophy of the hippocampus (Teipel et al. 2011a; Grothe et al. 2012, 2013) (Fig. 20.2). Interestingly, this MRI-based in vivo marker of cholinergic basal forebrain atrophy was also found to reproduce some of the major pathologic features of cholinergic degeneration in AD as reported from neuropathological autopsy studies, including correlations with specific cognitive deficits as well as distinct associations with amyloid deposition and neurodegeneration in the cortical projection sites of the cholinergic nuclei (Perry et al. 1978; Cullen et al. 1997; Grothe et al. 2010, 2014; Kilimann et al. 2014). Recently, novel MRI-based imaging techniques sensitive for subtle tissue abnormalities within the brainstem have been described (Shibata et al. 2008; Lambert et al. 2013), but these methods still await application in the study of AD-related brainstem pathology.
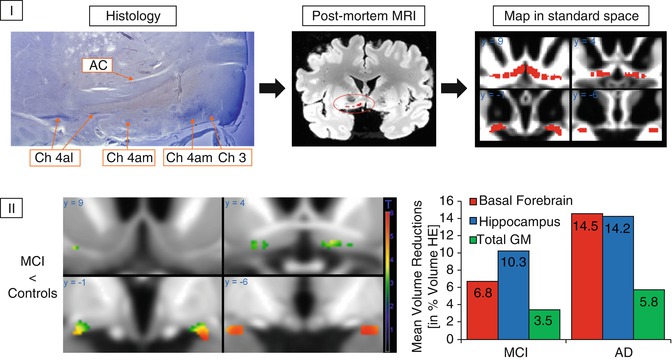
Fig. 20.2
(I) Generation of a cytoarchitectonic map of basal forebrain cholinergic nuclei in MRI standard space. Cholinergic cells are stained in histologic slices, and cholinergic nuclei are manually transferred to corresponding sections of a postmortem MRI, which is then automatically normalized into MRI standard space as defined by the Montreal Neurological Institute (MNI). AC anterior commissure, CH3 cholinergic cells corresponding to the vertical limb of the diagonal band of Broca, CH4 am, al cholinergic cells corresponding to the anterior medial and lateral parts of the nucleus basalis of Meynert (Based on data published in Teipel et al. (2005)). (II) Left: voxel-wise reductions in gray matter volume within the basal forebrain region of interest in MCI subjects compared to healthy controls. Right: group means of extracted basal forebrain, hippocampus, and total gray matter (GM) volumes in groups of MCI subjects and AD patients plotted as percent volume reduction compared to a healthy elderly (HE) reference group (Based on data published in Grothe et al. (2012))
20.2.1.4 The Cognitive Correlates of Regional Brain Atrophy
Given the progressive and regionally heterogeneous brain atrophy in AD, question arises regarding the functional significance of regional volume loss for the expression of cognitive impairments. The focal reduction of MTL volumes in predementia stages of AD with relatively isolated memory impairment suggests an important role of MTL atrophy for the emergence of memory deficits. This notion has been substantiated in early MRI studies by the demonstration of associations between manually measured MTL volumes and scores on tests of declarative memory in AD patients (Deweer et al. 1995), subjects with MCI (Killiany et al. 2002), and even within the normal variance among healthy elderly individuals (Hackert et al. 2002). Subsequent studies employed specific neuropsychological tests for different aspects of memory function in combination with fine-grained structural analysis on high-resolution MRI scans, to provide increasingly detailed evidence for functional specialization and hemispheric differentiation among MTL structures (de Toledo-Morrell et al. 2000; Rosen et al. 2003; Chen et al. 2010; Mueller et al. 2011) (Fig. 20.3).
In addition to the detailed examination of MTL atrophy in memory dysfunction, unbiased automated analyses have been used to search the whole brain for structural correlates of neuropsychological deficits in AD, including deficits in different aspects of memory, executive function, language function, and visuospatial ability (Chang et al. 2010; Grothe et al. 2010; Cardenas et al. 2011; Wolk and Dickerson 2011; Gross et al. 2012; McDonald et al. 2012). While the central role of MTL atrophy for declarative memory deficits in AD could be confirmed by these studies, the data also indicated that additional neocortical and subcortical changes were related to further neuropsychological deficits that are commonly expressed by AD patients. For example, executive function deficits were found to be more strongly associated with anterior frontal cortex atrophy, whereas deficits in naming and verbal fluency were found to be more strongly associated with atrophy of the left anterior temporal and frontotemporal lobes, respectively. The combined investigation of volumetric and neuropsychological data also showed that cognitive deficits as assessed by standard neuropsychological tests do not usually map to discrete cerebral sites but rather reflect atrophic processes in widespread and partially overlapping networks. For example, memory deficits were also found to be associated with atrophy of brain regions outside the MTL, including the lateral temporal lobe, the thalamus, the medial prefrontal cortex, and the posterior cingulate cortex (Fig. 20.3). Hence, these studies lend further experimental support to the notion that cognition depends on integrated networks of cortical and subcortical brain structures that differentially contribute to different aspects of the cognitive function, which they bring forth in concert. Associations between brain volumes and cognitive test performances are also found in other neurodegenerative diseases (Grossman et al. 2004; Luks et al. 2010) and even in the process of normal brain aging (Fjell and Walhovd 2010). Hence, age- and disease-related neurodegeneration is increasingly employed as a natural lesion model for the study of structure-cognition relationships in the human brain, thereby complementing findings from functional imaging studies of altered neuronal activity in response to cognitive tasks (see Sect. 20.4).
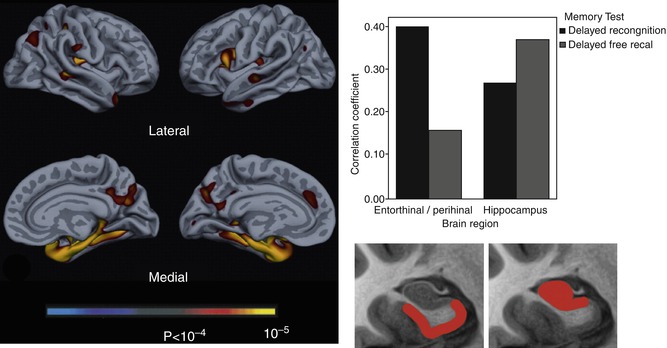
Fig. 20.3
Left: exploratory analysis of reductions in cortical thickness associated with impaired delayed recognition memory in AD patients. Right: Pearson correlations for hippocampus and perirhinal/entorhinal cortex (rostral MTL) volumes with delayed recall and recognition discrimination performance, controlled for age, education, and gender. Hippocampal atrophy is more strongly related to impaired delayed recall while perirhinal/entorhinal cortex atrophy is more strongly associated with impaired recognition memory performance. The bottom section of the figure represents the “idealized” anatomic localization of the two regions being compared (Adapted from Wolk and Dickerson (2011) with permission to reprint granted by Elsevier)
20.2.2 Risk and Resilience
Over the last years, large epidemiological studies have identified several factors that increase an individual’s risk for late-life cognitive decline and AD dementia (McDowell 2001). Among these risk factors are disadvantageous or predisposing combinations of specific genes (St George-Hyslop 2000), molecular signs of AD pathology (Rabinovici and Jagust 2009; Blennow et al. 2010), and lifestyle factors (Daviglus et al. 2011) that are mainly related to cardiovascular risk and obesity. On the other hand, higher education and socioeconomic status, specific diets, as well as maintained physical, social, and cognitive activity through old age have been found to reduce the risk of cognitive decline. Investigation of the effects that these genetic, molecular, and lifestyle factors exert on brain structure and function will further our understanding of the pathogenesis of AD.
20.2.2.1 Genetic Risk and Predisposition
Genetic mutations that affect the cellular processing of the amyloid precursor protein (APP) lead to increased production of neurotoxic amyloid-β proteins and cause the relatively rare autosomal dominantly inherited form of AD (familial AD). Mutation carriers are essentially certain to develop the disease and thus provide an opportunity to study brain changes that predate symptoms or clinical diagnosis. Consistently, mutation carriers were found to show accelerated atrophy of the hippocampus as well as of the posterior cingulate cortex and the precuneus already several years prior to diagnosis (Ridha et al. 2006; Knight et al. 2011). Similar to the genetic mutations in familial AD, the triplication of the APP gene on chromosome 21 in Down’s syndrome (trisomy 21) also leads inevitably to an increased amyloid-β deposition as well as AD-like neurodegenerative changes and cognitive impairments as subjects age (Mann 1988). Thus, MRI-derived volumes of the MTL were found to be significantly reduced in demented subjects with Down’s syndrome, but increased age-related reductions in AD-typical allo- and neocortical areas could also be demonstrated in nondemented individuals, providing another interesting model for presymptomatic brain changes in AD (Teipel et al. 2003b).
Apart from genetic mutations that inevitably lead to familial AD, a familial history of sporadic AD significantly increases the risk of AD in the offspring, pointing to disadvantageous and predisposing genotypes. The best investigated genetic risk factor for sporadic AD is the ε4 allele of the apolipoprotein E (APOE4) (Corder et al. 1993). Apolipoprotein E is believed to be an important promoter of axonal growth and synaptogenesis during neuronal growth, repair, and regeneration (Mahley and Rall 2000). It was also found to promote the proteolytic degradation of amyloid deposits (Jiang et al. 2008; Castellano et al. 2011) which may be dysfunctional in the APOE4 isoform, possibly explaining the increased amyloid deposition with age in APOE4 carriers (Reiman et al. 2009; Morris et al. 2010). In accordance with the increased risk for developing AD, healthy elderly individuals that posses the ε4 allele have higher rates of cognitive decline than noncarriers (Caselli et al. 2007) which is accompanied by increased rates of temporal lobe atrophy, mapping mainly to the MTL and to the entorhinal cortex and subiculum in particular (Honea et al. 2009; Donix et al. 2010) (Fig. 20.4). Structural MRI studies further showed that the dose-dependent and region-specific effect of the ε4 allele on brain structure leads to distinguishable AD phenotypes (Wolk and Dickerson 2010; Morgen et al. 2013). Thus, among AD patients, ε4 carriers exhibit greater atrophy of the temporal lobes, whereas noncarriers have greater frontoparietal atrophy. In line with the differential patterns of atrophy, carriers were found to be more impaired on episodic memory tests, whereas noncarriers performed worse on tests of working memory and executive function.
In contrast to the ε4 allele, the APOE ε2 allele is associated with a reduced risk of AD and lower amyloid deposition compared to the most common ε3 allele (Corder et al. 1994; Morris et al. 2010). Consistent with the supposed protective effect against AD pathology, healthy elderly carriers of the ε2 allele were found to exhibit increased thickness of the temporal cortex (Fan et al. 2010) as well as bigger hippocampus volumes (Hostage et al. 2013) and slower rates of hippocampal atrophy compared to ε3 carriers (Chiang et al. 2010).
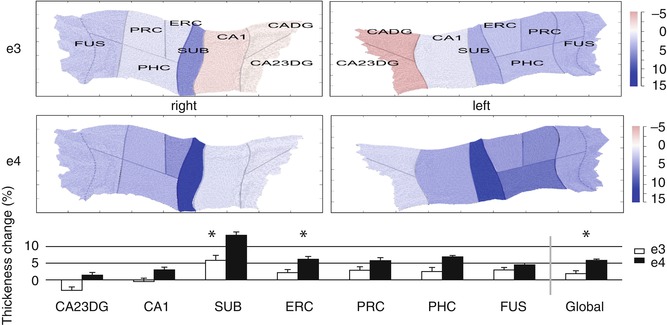
Fig. 20.4
Increased atrophy rates of hippocampal subfields in cognitively normal APOE4 carriers compared to noncarriers revealed by a cortical unfolding technique. The color–coded flat maps visualize cortical thickness change over a 2-year follow-up period in APOE4 carriers and noncarriers for both hemispheres separately. The graph below provides average (across both hemispheres) cortical thickness change for all subregions over time (mean ± SE). Significant between-group differences are indicated (*, p < 0.05, two tailed). APOE4 carriers compared to noncarriers showed significantly greater cortical thinning in SUB, ERC, and Global. CADG anterior CA fields and dentate gyrus, CA23DG CA fields 2, 3, and dentate gyrus, CA1 CA field 1, SUB subiculum, ERC entorhinal cortex, PRC perirhinal cortex, PHC parahippocampal cortex, FUS fusiform cortex, Global average thickness across all subregions, e3 non-APOE 4 carriers, e4 APOE 4 subjects (From Donix et al. (2010) with permission to reprint granted by Elsevier)
20.2.2.2 Increased Biomarker Levels of Molecular AD Pathology
Postmortem autopsy studies indicate that a considerable proportion of cognitively normal subjects of advanced age harbor AD pathology in the form of amyloid plaques and neurofibrillary tangles (Knopman et al. 2003). These findings could be reproduced using in vivo CSF-based and novel positron emission tomography (PET)-based biomarkers of molecular AD pathology. According to these studies, approximately 20–30 % of the normal elderly population aged 70 years and above harbor clinically silent amyloid pathology, which is associated with an increased risk of future cognitive decline and conversion to AD dementia (Rabinovici and Jagust 2009; Blennow et al. 2010).
In vivo MRI studies are now beginning to map the effects of abnormal levels of molecular AD pathology to structural brain changes. Thus, cross-sectional MRI studies found that an increased cerebral amyloid load in cognitively normal elderly, as assessed by CSF biomarkers (Tosun et al. 2010; Sabuncu et al. 2011) or amyloid imaging (Dickerson et al. 2009; Storandt et al. 2009; Becker et al. 2011), is associated with lower regional brain volumes in sites of early AD-related neurodegeneration, particularly the hippocampus, the temporoparietal neocortex, and the posterior cingulate/precuneus (Fig. 20.5). These findings could be further substantiated using serial MRI data, where those individuals with abnormally elevated levels of amyloid deposition were found to exhibit an accelerated decline of MTL and posteromedial parietal volumes compared to amyloid-negative controls (Scheinin et al. 2009; Chetelat et al. 2012; Ewers et al. 2012; Knopman et al. 2013). Moreover, subtle cognitive deficits in nondemented subjects with elevated amyloid burden were shown to be mediated by these structural brain changes (Ewers et al. 2012).
However, the relationship between amyloid pathology and changes in brain volume appears to be complex and disease stage specific. Hence, other studies did not find accelerated brain atrophy in cognitively normal amyloid-positive individuals during a 10-year interval preceding the amyloid scan (Driscoll et al. 2011), or did only find associations between amyloid load and reduced brain volume when limiting the sample to individuals with subjective cognitive impairment or to those with a high amyloid burden (Chetelat et al. 2010; Fjell et al. 2010; Grothe et al. 2014). Furthermore, in patients with clinically manifest AD, global amyloid burden is not or only weakly related to regional brain volume (Chetelat et al. 2010) or rates of longitudinal volume decline (Scheinin et al. 2009), possibly reflecting saturated cerebral amyloid deposition in the face of ongoing neuronal degeneration at the clinical stage of AD (Jack et al. 2009; Buchhave et al. 2012). On the other hand, elevated CSF markers of tau protein, indicative of neurofibrillary pathology, were found to be more robustly associated with in vivo measures of brain atrophy across MCI and AD groups, especially regarding MTL atrophy (Tosun et al. 2010; Desikan et al. 2011; de Souza et al. 2012). Together, these data agree with a proposed sequence of pathological events in AD that begins with cerebral amyloid deposition several years to decades before the first symptoms appear. Over the years, the primary amyloid-related molecular pathology would lead to structural brain changes, probably mediated by amyloid-induced neurofibrillary pathology, which finally trigger and parallel cognitive decline. In this respect, the combination of molecular and structural imaging can be used to test hypotheses on the pathogenetic sequence of AD development in vivo (see Box 20.1: The Amyloid-Cascade Model of AD).
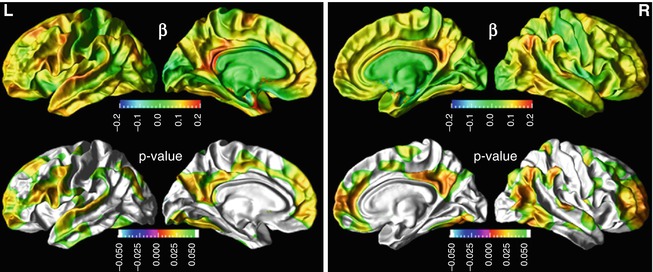
Fig. 20.5
Association between cerebrospinal fluid (CSF) beta amyloid (Aβ)1–42 concentrations and cortical thickness in a group of cognitively normal elderly subjects. Top row: cortical maps of regression coefficients for Aβ1–42. Bottom row: false discovery rate corrected p-value maps (From Tosun et al. (2010) with permission to reprint granted by Elsevier)
Box 20.1: The Amyloid-Cascade Hypothesis
The amyloid-cascade hypothesis of AD states that cerebral amyloid deposition, as caused by altered processing of the membrane-bound amyloid precursor protein (APP), is the primary etiologic event in AD pathogenesis. Over the years, clinically silent amyloid deposition would initiate downstream pathologic events, such as the formation of intracellular neurofibrillary tangles, that ultimately lead to neuronal dysfunction, cell loss, and cognitive decline (Hardy and Selkoe 2002).
This model is based on substantial evidence from genetic, pathological, and biochemical studies:
All AD patients have amyloid plaques
Aβ induces hyperphosphorylation of tau protein, neurodegeneration, and inflammatory processes in vitro
All known genetic predispositions for AD involve proteins in amyloid processing
Triplication of APP in Down’s syndrome leads to life-long Aβ deposition that inevitably results in AD
Transgenic mouse models expressing mutant human APP gene reproduces major features of AD
More recently, in vivo imaging- and CSF biomarkers could lend further support to the proposed sequence of pathologic events in the course of AD:
Amyloid biomarkers are the first to become abnormal but are relatively decoupled from atrophy and cognitive decline at the time clinical symptoms become manifest
Tau biomarkers are more consistently associated with imaging markers of neuronal dysfunction and atrophy
Atrophy on MRI both precedes and parallels cognitive decline
Although the initial biomarker evidence in favor of the amyloid-cascade hypothesis is compelling, this generic model of AD pathogenesis will certainly have to be modified and refined in the future, to account for inter-individual variability in the dynamics of pathologic changes and their relation to the expression of clinical symptoms (Jack et al. 2013; Chetelat 2013).
20.2.2.3 Cardiovascular Risk and Lifestyle
Several cardiovascular risk factors have been associated with an increased risk for cognitive decline and AD (Daviglus et al. 2011). This increased risk is suggested to be mediated by the negative effects that these factors exert on brain structure and function, which is now being increasingly investigated by in vivo imaging studies. Thus, several MRI studies could confirm that risk conditions such as smoking (Almeida et al. 2011), insulin resistance (Rasgon et al. 2011), diabetes mellitus (Chen et al. 2012), obesity (Jagust et al. 2005), as well as abnormal plasma levels of cholesterol (Ward et al. 2010) and homocysteine (den Heijer et al. 2003) are associated with atrophic brain changes in otherwise healthy and cognitively normal individuals. However, conditions appear to be differentially related to regional brain changes and do not necessarily map to regions that are most vulnerable in AD. For example, although smoking was found to be associated with lower brain volume in the posteromedial parietal cortex, significant effects were also found in regions less affected in AD, including the cerebellum and the frontal lobes, and no negative effects on hippocampal volume were found. In contrast, specific effects on hippocampal volume could be demonstrated for obesity as well as high levels of plasma homocysteine in nondemented older adults. Importantly, much of these risk conditions can be targeted by a change in lifestyle, dietary supplementation, or medical intervention, providing the possibility to actively reduce an individual’s risk for brain atrophy and cognitive decline. Thus, in vivo imaging studies have provided first evidence that successful smoking cessation, physical exercise training, as well as homocysteine lowering by B-vitamin intake may reduce or delay brain atrophy and cognitive decline in the elderly (Smith et al. 2010; Almeida et al. 2011; Erickson et al. 2011).
Already in the 1990s, epidemiological studies suggested that the incidence of AD is decreased in subjects with higher education. Interestingly, higher education did not reduce the risk for neurodegenerative AD pathology, but rather appeared to mitigate the impact of pathology on the clinical expression of dementia (Brayne et al. 2010). In accordance with that, MRI studies in AD showed that at a given level of cognitive impairment, patients with a higher education had more severe brain atrophy, suggesting that these subjects exhibit some kind of cognitive reserve which allows them to compensate more severe cerebral pathology (Perneczky et al. 2009). A similar resilience against AD pathology was also observed in patients with larger head circumference, which may be related to bigger brain size and thus higher brain reserve (Perneczky et al. 2010; Guo et al. 2013). In addition, healthy elderly subjects with higher education were found to have regionally increased cortical gray matter compared to less educated healthy subjects (Liu et al. 2012; Arenaza-Urquijo et al. 2013). Together, these data suggest that the increased resilience to AD pathology, or cognitive reserve, in higher educated individuals may be partly mediated by education-related increases in brain size, that is, by a higher brain reserve.
20.2.3 Imaging-Based Diagnosis
As a direct clinical application, atrophy patterns on MRI can be employed as positive markers of AD for diagnostic purposes as well as for the tracking of disease progression. In clinical trials on potential disease-modifying or preventive drugs, imaging-derived markers of early AD pathology may serve to enrich and stratify at-risk populations and may at the same time be used as surrogate markers of disease-modifying treatment effects. The progressive character of AD pathology that exhibits a long initial phase of asymptomatic brain changes may provide a possibility to detect the disease before the onset of manifest dementia and thus at a time when potential preventive therapies will be most effective. To improve early diagnosis of AD at predementia stages, there is an ongoing search for sensitive and specific imaging markers that best discriminate between healthy elderly, MCI subjects, and AD patients and that may predict a future conversion to AD in asymptomatic elderly subjects or subjects with MCI.
Given the severe atrophy of the MTL in AD, even simple visual rating scales of MTL atrophy can distinguish AD patients from healthy controls with high diagnostic accuracies of approximately 85 % (Scheltens et al. 1992). However, the visual ratings are not sensitive enough to detect subtle changes in MTL volume over time, suggesting that this approach may not be usefully employed as a secondary endpoint in clinical trials (Ridha et al. 2007). In contrast, manually measured volumes of the MTL allow for a more sensitive detection of longitudinal atrophy, demonstrating hippocampus atrophy rates of 3–8 % in AD, with an acceleration of rates from MCI to clinically manifest AD, while healthy controls exhibit atrophy rates around 1 % in later life (Raz et al. 2004; Barnes et al. 2009). In cross-sectional settings, volumes of the hippocampus and the entorhinal cortex can separate AD patients and MCI subjects from healthy controls with accuracies ranging from 70 % for early stages of MCI to complete group separation for advanced stages of AD dementia (Seab et al. 1988; Du et al. 2001; Teipel et al. 2006). Furthermore, both hippocampus and entorhinal cortex volume predict future conversion to AD in individuals with MCI at accuracies around 80–85 %, whereas the predictive value of entorhinal cortex volume seems to be slightly superior over hippocampus volume (Jack et al. 1999; Killiany et al. 2002; deToledo-Morrell et al. 2004).
Due to the laborious nature of manual volumetry methods, most of these studies have only assessed the diagnostic accuracy of select MTL structures in relatively small samples of monocentric data, limiting the heuristic value of the findings and their generalizability to clinical multicenter settings. Novel automated volumetry techniques now enable the automated segmentation of the hippocampus and other ROIs in large datasets in a rater-independent and timely manner. Automated segmentations of the hippocampus exhibit high anatomic accuracy when compared to manual delineations (Klein et al. 2009; Leung et al. 2010) and provide comparable diagnostic power (Colliot et al. 2008; Mak et al. 2011). They further demonstrate high sensitivity to change over 1-year intervals and may even be more reliable than manual volumetry approaches for the assessment of longitudinal atrophy rates (van de Pol et al. 2007). When tested for their diagnostic potential in large multicenter data sets, such as provided by the Alzheimer’s Disease Neuroimaging Initiative (ADNI), automatically segmented volumes of the hippocampus achieve accuracies of around 70 and 80 % for separating MCI subjects and AD patients, respectively, from healthy controls (Calvini et al. 2009; Chupin et al. 2009).
Based on the increasing awareness of early cholinergic degeneration in the course of AD, which also appears to be related to the severity of cortical amyloid pathology (Mesulam et al. 2004; Potter et al. 2011; Grothe et al. 2014), MRI-based volumetry of the cholinergic basal forebrain has emerged as a promising diagnostic marker for AD. Thus, the diagnostic accuracy of in vivo basal forebrain volumetry for the detection of early and predementia stages of AD was found to be comparable to the accuracy of hippocampus volume (Kilimann et al. 2014), but basal forebrain atrophy was also a significant predictor of amyloid pathology among predemented subjects, whereas hippocampus atrophy was not (Teipel et al. 2014a).
Diagnostic models based on single regional markers do not account for the AD-typical pattern of progressive atrophy that spreads from the MTL/basal forebrain to the temporoparietal neocortex early in the course of the disease. Modern image-processing software enables the automated parcellation of the brain into several neuroanatomic ROIs that can then be tested separately and in combination for their diagnostic potential using logistic regression or discriminant analysis. Using such an approach, it could be shown that a combined structural marker of the hippocampus, the entorhinal cortex, and the temporoparietal junction could increase diagnostic accuracy for the separation of MCI from controls in a multicenter setting to 90 % (Desikan et al. 2009). Optimal combinations of automatically extracted regional markers for distinguishing between AD patients and controls could even yield complete group separations (Lerch et al. 2008; Desikan et al. 2009). Accordingly, composite markers that combined AD-typical regional measures, including the MTL, temporoparietal association areas, and medial parietal regions, showed promising accuracies of around 75 % for the prediction of imminent conversion to AD in multicenter data of subjects with MCI (Bakkour et al. 2009; Querbes et al. 2009). Atrophy across several a priori cortical predilection sites for AD-related neurodegeneration was even found to be a significant predictor of subsequent memory decline and the development of AD dementia in cognitively normal elderly subjects (Dickerson et al. 2011). An extension of logistic regression and discriminant analysis approaches for the construction of diagnostic models is given by multivariate pattern classification techniques, including principal component analysis and machine learning algorithms such as support vector machine (Teipel et al. 2007a; Davatzikos et al. 2008; Plant et al. 2010). These techniques make optimal use of the data by extracting and recognizing diagnosis-specific regional patterns of atrophy from preprocessed imaging data in an unsupervised manner and can distinguish between AD patients, MCI subjects, and controls with high diagnostic accuracy. When trained to recognize spatial patterns of brain atrophy which best distinguish between AD patients and controls, pattern classifiers can predict an imminent conversion to AD dementia in MCI subjects with accuracies around 80 % (Misra et al. 2009) and may even be used to assess an individual’s risk for future cognitive decline in asymptomatic elderly subjects (Davatzikos et al. 2009). Machine learning algorithms are already now being developed for the software of scanner consoles as radiological expert systems based on anatomical MRI data. In the future, these algorithms may be expanded to integrate diverse information from a multitude of image and biomarker modalities to improve the automated detection of prodromal AD stages based on high-dimensional pattern recognition (Davatzikos et al. 2011; Liu et al. 2013).
20.3 Diffusion Tensor Imaging
20.3.1 White Matter Pathology in AD
Although AD is primarily considered a brain gray matter disease, histopathological studies have also detected pathologic alterations of the subcortical white matter. The origin of these white matter lesions is a matter of ongoing debate. While secondary (Wallerian) degeneration due to cortical atrophy is the most likely cause, other origins such as direct amyloid-myelin interactions, inflammatory processes, and hypoperfusional/hypoxic events are also discussed (Englund et al. 1988; Xu et al. 2001; Roher et al. 2002). In the “retrogenesis” model of white matter degeneration, myelin breakdown is hypothesized to specifically affect the late-myelinating neurons of higher-order association cortices due to their smaller axonal diameter and lower oligodendrocyte-to-axon ratio, rendering them more vulnerable to age- and disease-related insults. Thus, the theory posits a progressive demyelination pattern that recapitulates the developmental process of myelination in reverse (Bartzokis 2004). Viewed from the point of axonal degeneration, the functional deficits in AD may also be described in terms of a cortical disconnection syndrome that is characterized by impaired neuronal communication between widely distributed neural networks that subserve higher cognitive function (Delbeuck et al. 2003). Diffusion tensor imaging (DTI) now allows studying the individual anatomy and microstructural integrity of white matter fiber tracts in vivo and provides the opportunity to investigate the role of white matter pathology and cortical disconnection in the pathogenesis of AD in unprecedented detail.
20.3.1.1 Regional Pattern of White Matter Changes in the Course of Progressing AD Pathology
By examining diffusion indices of microstructural integrity within ROIs placed in normal appearing lobar white matter, it could be shown that AD patients exhibit increased mean diffusivity (MD) and decreased fractional anisotropy (FA) in the corpus callosum (CC) as well as in the frontal, temporal, and parietal lobes when compared to controls. In contrast, microstructural integrity of the occipital lobe and the internal capsule was found to be widely preserved (Bozzali et al. 2002). In the prodromal MCI stage, similar alterations of white matter integrity were found in proximity to cortical regions that are typically affected early in the course of AD, particularly the temporal and parietal white matter, but not in frontal regions or the CC (Fellgiebel et al. 2004; Huang and Auchus 2007). However, the increased contrast for white matter compartments in diffusion-weighted data also allows the structural identification and quantification of specific fiber tracts of interest as opposed to relatively unspecific lobar white matter ROIs. Accordingly, reduced fiber integrity in AD was found for widespread intracortical projecting fibers, including the splenium of the CC, the superior longitudinal fasciculus, and the cingulum bundle, but not for the pyramidal tract (Rose et al. 2000). In MCI subjects tract-specific analysis revealed disruptions of white matter integrity mainly in (limbic) fiber tracts with direct connections to MTL structures, including the posterior and parahippocampal cingulum, the perforant path, the fornix, and the uncinate fasciculus (Fellgiebel et al. 2005; Kalus et al. 2006; Zhang et al. 2007; Sexton et al. 2010). Especially the disruption of the cingulum bundle due to MTL atrophy is believed to contribute to early functional deficits in the course of AD pathogenesis by disconnecting the posterior cingulate cortex from the MTL (Villain et al. 2010; Bozzali et al. 2012).
Similar to the study of gray matter changes, automated voxel-based as well as atlas-based parcellation methods for the analysis of DTI data have been developed that greatly facilitate the comprehensive assessment of microstructural white matter changes throughout the whole brain in AD (Medina et al. 2006; Teipel et al. 2007b; Zhuang et al. 2010; Huang et al. 2012). Despite considerable methodical heterogeneity, leading to partly discrepant findings, results from automated and manual studies converge on a pattern of microstructural white matter changes in AD that begin and are most severe in limbic tracts, including the fornix and posterior and parahippocampal fibers of the cingulum, and sequentially extend to include more lateral temporoparietal association fibers, commissural fibers of the splenium, and finally long-ranging association tracts involving the frontal white matter (Fig. 20.6). Importantly, first microstructural alterations of the limbic tracts were already detectable in presymptomatic subjects approximately 2 years before they developed cognitive deficits and received a diagnosis of MCI (Zhuang et al. 2012). On the other hand, diffusivity increases in frontal and parietal white matter, but not in temporal white matter, distinguish between MCI subjects that imminently convert to AD dementia and those that remain stable (Scola et al. 2010). Extracortical projecting fiber tracts, in contrast, are relatively preserved until advanced stages of the disease (Teipel et al. 2014c). The functional consequences of these microstructural white matter changes appear to be widely consistent with a priori models of the representation of cognitive function across neuronal networks in the human brain. Thus, fiber tract disruptions of the fornix and the parahippocampal white matter, including the cingulum and the perforant path, have been shown to be associated with impaired episodic memory function in AD patients as well as in individuals with MCI (Huang and Auchus 2007; Fellgiebel et al. 2008; Sexton et al. 2010). Executive function deficits, on the other hand, were found to map to white matter disruptions in frontal and anterior cingulate regions (Huang and Auchus 2007; Chen et al. 2009; Grambaite et al. 2011b). Although disruptions of most fiber tracts are highly correlated to gray matter atrophy in the respective cortical projection sites (Sydykova et al. 2007; Avants et al. 2010) (Fig. 20.7), microstructural fiber alterations have been found to contribute independently to cognitive impairments, highlighting the functional significance of cortical disconnection in addition to local cortical lesions (Delbeuck et al. 2003; Grambaite et al. 2011a; Bozzali et al. 2012).
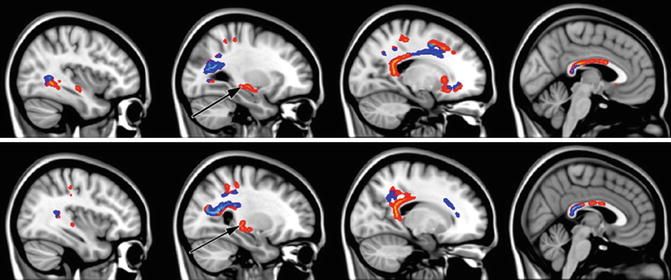
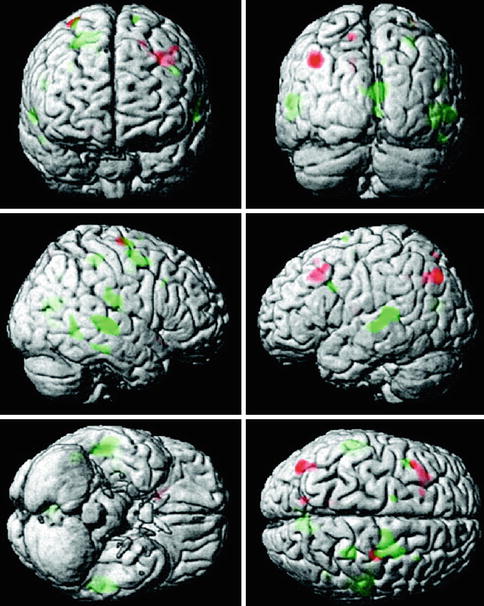
Fig. 20.6
Sagittal sections illustrating significant fractional anisotropy (FA) reduction in MCI subjects compared with controls as revealed by tract-based spatial statistics (TBSS) analysis (p < 0.05, corrected for multiple comparisons). Light blue represents white matter regions with significant FA reduction overlapping with white matter (WM) lesions. Areas of significant FA decrease without the involvement of WM lesions are marked in red–yellow. Black arrows show the location of the crus of fornix (From Zhuang et al. (2010) with permission to reprint granted by Elsevier)
Fig. 20.7
Voxel-wise correlation between cortical gray matter volume and fractional anisotropy (FA) value in the anterior (red) and posterior (green) corpus callosum in patients with AD. Cluster extension set at ≥50 contiguous voxels passing the significance threshold of p < 0.001 (From Sydykova et al. (2007) with permission to reprint granted by Oxford University Press)
Although the current model of progressive white matter changes and associated cognitive impairments in the course of AD is mainly derived from cross-sectional studies on at-risk populations, first results from longitudinal follow-up studies largely confirm the extrapolated pattern of white matter degeneration spreading from limbic tracts over temporoparietal association fibers to the frontal white matter (Scola et al. 2010; Teipel et al. 2010b; Mielke et al. 2012; Zhuang et al. 2012; Douaud et al. 2013).
20.3.1.2 Comprehensive Analysis of the Diffusion Tensor
While the majority of studies so far concentrated on FA or MD as markers of microstructural tissue alteration, more recent studies suggest that simultaneous assessment of the full range of tensor-derived diffusion indices, including FA, MD, as well as axial (AxD) and radial diffusivity (RaD), may provide more detailed information about the specifics of white matter damage in AD. Thus, increases in RaD have been specifically associated with myelin degeneration, whereas changes in AxD are suspected to reflect direct axonal damage (Song et al. 2003). In general, absolute diffusivities (i.e., MD, AxD, and RaD) have been found to be more sensitive markers of AD-related white matter pathology than FA, particularly in early and prodromal stages of the disease (Acosta-Cabronero et al. 2010; Bosch et al. 2012) (Fig. 20.8). More specifically, AD-related microstructural changes in limbic tracts were found to be characterized by increased RaD but relatively preserved AxD, whereas an opposite pattern was found for projection tracts. Degeneration of commissural and association tracts, on the other hand, was characterized by increases in RaD as well as in AxD, thus indicating differing processes of tissue disruption among fiber populations in AD (Huang et al. 2012). A differential contribution of axial and radial diffusivities was also found for AD-related tissue disruption in CC subregions (Di Paola et al. 2010). An increase in AxD in combination with unchanged FA values within the splenium was interpreted by the authors as indicative of Wallerian degeneration secondary to temporoparietal cortex atrophy, whereas a specific increase in RaD in combination with preserved AxD was suggested to reflect demyelination of frontal fibers in the course of retrogenesis. When compared with young adults, both healthy elderly subjects and AD patients demonstrated widespread FA reductions and increases in RaD that were characterized by a gradient of decreasing lesion severity from late-myelinating frontal to early-myelinating posterior fibers (Head et al. 2004; Damoiseaux et al. 2009; Gao et al. 2011). Together these data suggest that retrogenesis may account to a large extent for age-related white matter disruptions, most prominently affecting frontal regions, whereas AD pathology may accelerate this process slightly and additionally affects posterior fibers through Wallerian degeneration secondary to severe temporoparietal atrophy.
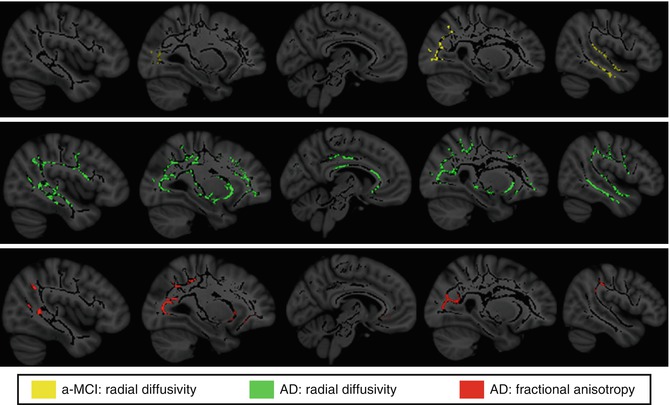
Fig. 20.8
White matter areas showing significant radial diffusivity increases in amnestic MCI (a-MCI) and AD patients compared to healthy elderly controls as assessed by tract-based spatial statistics (TBSS) analysis (p < 0.05, corrected for multiple comparisons). Note that regions displaying significant radial diffusivity increases among a-MCI show anatomical overlap with those of reduced FA among demented patients (From Bosch et al. (2012) with permission to reprint granted by Elsevier)
20.3.1.3 Fiber Tractography
Apart from deriving scalar indices of fiber integrity from the diffusion tensor, diffusion-weighted data can also be used to automatically reconstruct individual fiber tracts from selected seed points based on the inter-voxel continuation of the principal diffusion direction. This tractography approach can be used to derive indices of structural connectivity between cortical regions, such as the number of streamlines that reached a cortical target region from a distant seed region or the average microstructural integrity of the reconstructed fiber connection. Thus, by sending fiber tracking streamlines from hippocampus and posterior cingulate seeds to the rest of the cortex, it could be shown that the number of reconstructed fiber tracts was significantly reduced for both seeds in AD and for the hippocampus seed in MCI. Moreover, reduced numbers of hippocampal fibers were also shown to correlate with episodic memory performance, indicating that global structural disconnection of the hippocampus already occurs in prodromal stages of AD and contributes to early memory deficits (Zhou et al. 2008). An intriguing new approach to the study of cortical disconnection is given by the reconstruction of individual whole-brain connectivity networks and subsequent analysis of their topological organization using graph-theoretical analysis (He and Evans 2010). Using white matter tractography-derived connectivity information to build cortical connectivity networks, it could be shown that presence of AD alters discrete topological network metrics, mostly related to increased shortest path lengths and less efficient network wiring (Lo et al. 2010; Shao et al. 2012). Analysis of abnormal systematic brain integrity in AD may be an interesting alternative to regional lesion analysis as it inherently accounts for the structural and functional network architecture of the human brain. A major shortcoming of current DTI-based fiber tracking algorithms is that they cannot reliably resolve crossing and touching fiber bundles due to their indirect reconstruction of the principal fiber direction through the Gaussian parameterization of diffusion in the diffusion tensor. Recently developed model-free generalizations of DTI, such as diffusion spectrum imaging, allow a more accurate reconstruction of crossing fiber tracts (Wedeen et al. 2008) and may be used in the future to study age- and AD-related structural connectivity changes in greater detail (Teipel et al. 2014b).
20.3.2 Genes, Molecular Pathology, and Lifestyle Factors
Compared with the study of cortical gray matter, the effects that the various genetic, molecular, cardiovascular, and lifestyle factors of risk and resilience exert on the brain’s white matter integrity are less thoroughly explored.
20.3.2.1 Influence of Susceptibility Genes
Studies that investigated white matter integrity in relation to carrier status of familial AD mutations found decreased FA values in preclinical carriers compared to noncarriers in the fornix as well as in the parahippocampal and orbitofrontal white matter. FA reductions of the fornix were already marked in completely presymptomatic mutation carriers with preserved hippocampal volume and may thus represent a very early pathologic event in AD (Ringman et al. 2007; Ryan et al. 2013). Similarly, a family history of sporadic AD and possession of the APOE4 allele have been shown to be associated with reduced white matter integrity even in asymptomatic healthy elderly subjects without signs of cortical atrophy (Gold et al. 2010). Interestingly, the effects of family history and APOE status were found to be partly independent, indicating that further unknown genetic risk factors may affect brain structure independent from, and in addition to, APOE status (Bendlin et al. 2010; Xiong et al. 2011). In group comparisons with healthy elderly controls homozygous for the APOE ε3 allele, APOE4 effects mainly mapped to posterior AD-susceptible fiber tracts, including the parahippocampal white matter and the splenium of the CC (Persson et al. 2006; Honea et al. 2009; Kljajevic et al. 2013). However, possession of the APOE4 allele was also shown to dose dependently increase the negative effects of advanced age on white matter microstructure in frontal and posterior regions (Ryan et al. 2011). Accordingly, asymptomatic APOE4 carriers also demonstrated an accelerated age-related loss of graph-theoretical measures of local cortical interconnectivity, mainly affecting posteromedial and lateral parietal as well as orbitofrontal cortices (Brown et al. 2011). Based on the observation that reduced fiber integrity can also be observed in young adult carriers compared to noncarriers (Heise et al. 2011) and that the physiological role of the apolipoprotein E is associated with both white matter development and repair (Mahley and Rall 2000), it is currently not clear whether APOE4 effects on white matter microstructure are primarily of neurodegenerative or developmental nature.
20.3.2.2 Markers of Molecular Pathology
Although AD-related changes in DTI indices of white matter integrity are still little explored in relation to molecular biomarkers of amyloid pathology, there is now initial evidence that increased levels of tau protein in the CSF are related to microstructural fiber disruption. The microtubuli associated tau protein is essential for the maintenance of axonal integrity. Increased levels of CSF tau protein have been found in several conditions with severe axonal damage such as head trauma, AD, or large cerebral infarcts. In accordance with the pathophysiological significance of increased CSF tau levels, MCI subjects with increased levels of CSF tau had significantly lower FA and increased RaD in the posterior cingulum fibers compared to those with normal levels (Stenset et al. 2011) (Fig. 20.9). Increased CSF tau was also found to be associated with microstructural tissue disruption in a group of asymptomatic middle-aged adults with a family history of AD (Bendlin et al. 2012). Surprisingly, no association could be found between tau levels and AxD, which had been proposed as a marker of direct axonal damage as opposed to damage to the myelin sheath in previous studies. There is, however, evidence for a stage-specific alteration of AxD in the pathogenesis of AD, where AxD is decreased in early stages of disease, suggesting functional alterations of intra-axonal transport, but increased with loss of gross axonal integrity in more advanced stages. These initial findings lend substantial support to the utility of CSF tau as a molecular marker of axonal degeneration induced by neurofibrillary pathology and warrant further exploration of the relationship between biomarkers of molecular AD pathology and diffusion indices of microstructural fiber integrity.
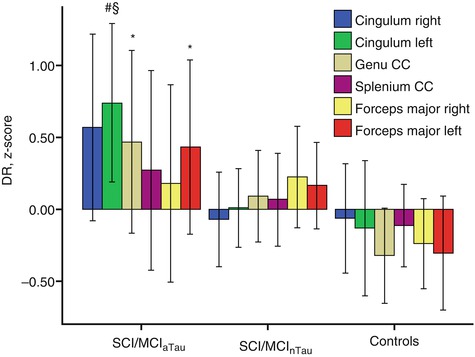
Fig. 20.9
Standardized residuals (z-scores) of radial diffusivity after correcting for age, sex, volume of white matter hyperintensities, and different MRI scanner. Subjects with subjective cognitive impairment (SCI) or MCI and abnormal CSF tau protein levels (SCI/MCI aTau ) had significantly higher radial diffusivity (DR) in genu corpus callosum, left forceps major, and left posterior cingulum compared to controls and higher DR in the left posterior cingulum compared to subjects with SCI or MCI and normal CSF tau protein levels SCI/MCInTau (Mann-Whitney U-test). *Statistically significant vs. controls (p < 0.05, uncorrected). #Statistically significant vs. controls (p < 0.01, uncorrected). §Statistically significant vs. SCI/MCInTau (p < 0.05, uncorrected). DR radial diffusivity (Adapted from Stenset et al. (2011) with permission to reprint granted by Elsevier)
20.3.2.3 Cardiovascular Risk and Lifestyle
Vascular risk was found to worsen age-related white matter changes by exacerbating frontal fiber disruptions and further driving the expansion of white matter damage from anterior to posterior regions (Kennedy and Raz 2009). When compared to the region-specific effects of AD, vascular risk factors were found to contribute independently to reductions in white matter integrity and with a different region-specific injury pattern (Lee et al. 2009). This has been demonstrated in detail for CC fiber disruptions, where vascular risk was associated with reduced FA in most parts of the CC, but FA reductions in the genu and especially the splenium were predominantly driven by AD diagnosis (Lee et al. 2010). Interestingly, white matter disruptions in obese but otherwise healthy adults were found to map more selectively to AD-susceptible regions, especially the fornix and the splenium of the CC (Stanek et al. 2011; Xu et al. 2013).
Although possible positive effects on white matter integrity through changes in lifestyle have not yet been demonstrated in longitudinal trials, there is initial evidence from cross-sectional studies that smoking cessation and aerobic fitness may partly reverse the negative effects on white matter integrity of cardiovascular risk factors (Gons et al. 2011, 2013; Tseng et al. 2013). In addition, cognitive training programs in older adults have been shown to benefit white matter integrity, where increases in FA correlated with memory improvement in the training group (Engvig et al. 2012). DTI can also contribute to further our understanding of cognitive reserve in high-educated individuals (Teipel et al. 2009; Arenaza-Urquijo et al. 2011). Thus, it could be shown that AD patients with higher education showed reduced fiber integrity in limbic and association fibers when compared to similarly impaired patients with less education, indicating that in high-educated subjects more fiber disruptions are necessary to induce the same level of cognitive impairment. In healthy elderly subjects on the other hand, higher education was associated with greater white matter integrity in similar fiber systems. Thus, the cognitive reserve capacity of high-educated individuals may be mediated not only by bigger brain sizes or selectively increased gray matter volumes but also by education-induced increases in cortical network wiring which is probably associated with facilitated intracortical communication.
20.3.3 DTI as a Diagnostic Marker
The group differences in microstructural integrity of select white matter tracts may also be used to aid early diagnosis of AD at the individual level. Several studies have examined the diagnostic potential of averaged measures of microstructural integrity from ROIs in lobar white matter as well as in delineated tracts of interest, most notably the fornix, cingulum, or CC. In line with the findings from intergroup comparisons, reduced microstructural integrity of the parahippocampal and posterior cingulum, the fornix, and the splenium of the CC were the most reliable predictors of AD and MCI. However, the reported diagnostic accuracies differed widely between studies, particularly for separating MCI subjects from healthy controls, and ranged from hardly significant group separations (Johnson et al. 2010) to accuracies between 70 and 80 % (Chua et al. 2009; Wang et al. 2009a; Zhuang et al. 2010). These discrepancies may be related to small and heterogeneous study samples but also to differences in image processing strategies and the employed diffusion metrics. In a meta-analytic study, diffusion changes in limbic regions yielded effects sizes at predementia stages of AD that were in the range of effect sizes for MTL volumes (Clerx et al. 2012). However, given that microstructural fiber tract alterations and regional gray matter atrophy carry complementary information of the disease process, highest diagnostic accuracies were generally found when diffusivity markers and macroscopic atrophy markers were combined (Zhang et al. 2007; Wang et al. 2009a).
Recent longitudinal studies suggest that especially diffusivity changes of the fornix appear to be good predictors of imminent memory decline, both at the preclinical (Zhuang et al. 2013) and predementia stages of AD (Mielke et al. 2012). White matter abnormalities further appear to track cognitive deterioration at the dementia stage of AD (Acosta-Cabronero et al. 2012), and mean diffusivity of the posterior cingulum was found to be a more sensitive indicator of dementia severity than hippocampal volume (Nakata et al. 2009). Moreover, in one study diffusion indices of microstructural tissue integrity were found to be better predictors of conversion to AD in MCI subjects when compared to volumetric measures across several white and gray matter ROIs (Scola et al. 2010).
A promising application of DTI as early marker of AD pathology is also given by the assessment of diffusion abnormalities in gray matter regions, most notably the hippocampus, as they may detect microstructural tissue disruption before volumetric loss occurs. Accordingly, at the predementia stage of AD, mean diffusivity of the hippocampus was found to yield higher diagnostic accuracies than hippocampal volume (Fellgiebel and Yakushev 2011; Clerx et al. 2012).
Recently, multivariate approaches which take into consideration the covariance structure of the DTI measures across the whole brain are being explored for their potential to improve diagnosis of AD. Thus, mean diffusivity maps of the whole brain derived from principal component analysis showed equally high diagnostic accuracy as maps of structural volumetric changes for separating AD patients from controls (Friese et al. 2010). When feeding various tract-based measures of diffusion abnormalities in a classifier based on a machine learning algorithm (support vector machine), optimal classification accuracies above 90 % were achieved for separating MCI subjects from controls as well as for separating stable MCI subjects from those that imminently progressed to AD (Haller et al. 2010). Similarly high accuracies for the imaging-based diagnosis of MCI were achieved when feeding a support vector machine classifier with network metrics derived from DTI-based cortical connectivity networks (Shao et al. 2012) (Fig. 20.10).
It has to be noted, however, that all of these studies used monocentric data to estimate diagnostic accuracies, and DTI-derived measures of tissue integrity have only recently entered the state of multicenter trials. Within the framework of the European DTI Study in Dementia (EDSD), a clinical and physical phantom study suggested an about 50 % higher variability of multicenter acquired DTI data compared to classical anatomical MRI scans, significantly limiting its applicability in the wider clinical setting (Teipel et al. 2011b). The variability was further found to differ between diffusion indices and fiber tracts which should be taken into account for the design of DTI-based diagnostic markers which, in the end, are being developed for application in clinical settings. Based on a subsample of the EDSD multicenter data, posterior cingulate fiber tracking yielded a diagnostic accuracy of about 70 % for markers of fiber tract integrity with a considerable variation across centers (Fischer et al. 2012). Voxel-based analysis of FA and MD in the extended EDSD cohort with 137 AD patients and 143 controls yielded about 82 % accuracy in group separation across nine different sites (Teipel et al. 2012). Currently, multivariate machine learning algorithms are being developed for classification of multicenter DTI data (Dyrba et al. 2013). Prospective protocols for acquisition of multicenter DTI data for the study of neurodegenerative disorders have been suggested (Turner et al. 2011) and will be evaluated in future studies.
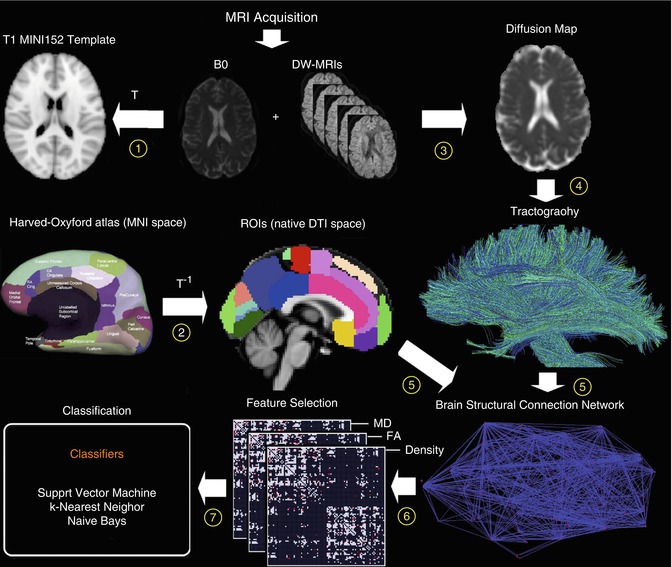
Fig. 20.10
Flowchart of diffusion-weighted image analysis for automated classification based on structural connectivity networks. Individual diffusion-weighted images are normalized to the MRI standard space (1) and automatically parcellated based on inverse transformation of an anatomical atlas in standard space (2). A voxel-wise diffusion tensor model is used to derive maps of local properties of water diffusion (e.g., fractional anisotropy (FA) or mean diffusivity (MD)) (3). Whole-brain tractography is performed providing an estimate of axonal trajectories across the entire white matter (4). Individual structural connectivity networks (ISCNs) are constructed by combining the output of both cortical parcellation and diffusion tractography for each individual subject (5). The most distinctive connections of ISCNs among groups are identified by a feature selection criterion for different attributes of fiber density, FA, and MD (6). ISCNs of patients with MCI and mild AD, respectively, and healthy control subjects are classified by three different pattern recognition algorithms (7) (From Shao et al. (2012) with permission to reprint granted by Elsevier)
20.4 Functional MRI
20.4.1 Progression of Brain Dysfunction in AD
Based on the saliency of memory deficits in AD as well as evidence from neuropathological and structural imaging studies pointing to the MTL as the site of earliest and most pronounced AD pathology, functional neuroimaging studies in AD have focused on the neural correlates of memory deficits with particular emphasis on the function of the hippocampus and the extended memory network. However, neural changes in response to other cognitive and perceptual challenges are also being studied. Of particular interest have been the functional compensatory mechanisms that evolve in the face of increasing pathology within particular neuronal systems to maintain the function of initially spared cognitive domains. More recently, the discovery of intrinsic brain activity during resting baseline conditions has shifted the focus of functional imaging studies from task-related activity changes in perceptual or cognitive networks to the study of dysfunctional suppression of baseline activity and disrupted network connectivity at rest.
20.4.1.1 Task-Based fMRI
Memory Function
In order to examine the earliest cognitive impairments related to AD, a significant number of functional imaging studies have focused on memory paradigms and hippocampal function. Thus, studies have utilized a paradigm where participants have to encode a single stimulus at a time, be it an image or word. The activation pattern in the hippocampus were found to change along a linear continuum, where the activation level in the hippocampus decreased from healthy subjects to MCI subjects to patients with clinical AD. Thus, when investigating the activation differences in the medial temporal lobe between an AD patient group and a healthy control group during encoding of images, it was found that AD patients showed reduced activation of the left hippocampus and the bilateral parahippocampal gyri (Rombouts et al. 2000). Another memory encoding study with images as stimuli reported lower hippocampal activation in both an AD group and an MCI group when compared to a control group of age-matched healthy subjects (Machulda et al. 2003). Similarly, compared to age-matched healthy controls, MCI subjects were found to show decreased activation in the right hippocampus during encoding of line drawings (Johnson et al. 2006a).
Another approach to investigating memory function is given by associative encoding tasks, which involve the pairing of two non-semantically related stimuli such as a face with a name. In one associative memory study investigating changes with normal aging and in early-stage AD, there was significant activation of the hippocampus in both young and older healthy subjects when encoding novel face-name pairs compared to a well-learned face-name pair, whereas patients with mild AD failed to show such activation (Sperling et al. 2003) (Fig. 20.11). However, in contrast to previous findings of a linear decrease of hippocampal activation from healthy aging over MCI to AD, several studies reported increased MTL activation in MCI subjects during associative memory tasks compared to both healthy elderly controls and AD patients (Dickerson et al. 2005; Hamalainen et al. 2007). This hyperactivity was suggested to represent a compensatory mechanism for beginning MTL atrophy, as hippocampal volume and parahippocampal activity were negatively correlated in MCI subjects, but not in controls or patients with AD (Hamalainen et al. 2007) (Fig. 20.11). In line with the notion of a nonlinear continuum of hippocampal activity changes due to early compensatory processes, another study found hyperactivation in the hippocampus only in early-stage MCI subjects, whereas more impaired MCI subjects and AD patients demonstrated significantly reduced levels of activity compared to healthy controls (Celone et al. 2006). In addition, a longitudinal follow-up study found that healthy subjects with more rapid cognitive decline over a 2-year period had both the highest hippocampal activation at baseline and the greatest loss of hippocampal activation over follow-up, where the rate of activation loss correlated with the rate of cognitive decline (O’Brien et al. 2010).
Another cognitive domain that has received significant interest is working memory (see review (Bokde et al. 2009)). Thus, an altered verbal working memory process in AD patients was reported using an n-back verbal working memory task, which revealed a decreased prefrontal activation in the AD patient group but also an increased parietal activation compared to healthy controls, suggestive of a compensatory mechanism (Lim et al. 2008). In another working memory paradigm with letters as stimuli, it was reported that AD patients showed increased activation during the recognition phase in several brain areas, including the left hippocampal formation (Peters et al. 2009). Hence, AD patients may rely on the recruitment of alternative recognition mechanisms when performing short-term memory tasks. Similar alternative processing mechanisms during working memory performance have also been observed in MCI subjects (Bokde et al. 2010a). It was found that response time in the healthy control group was correlated to the left hippocampus during the encoding phase and to parietal and frontal areas during the recognition phase of the employed working memory paradigm. Contrary to the healthy control group, response time in the MCI group was strongly correlated to the inferior and middle temporal gyri during encoding, the middle frontal gyrus during the maintenance phase, and the hippocampus during the recognition phase.
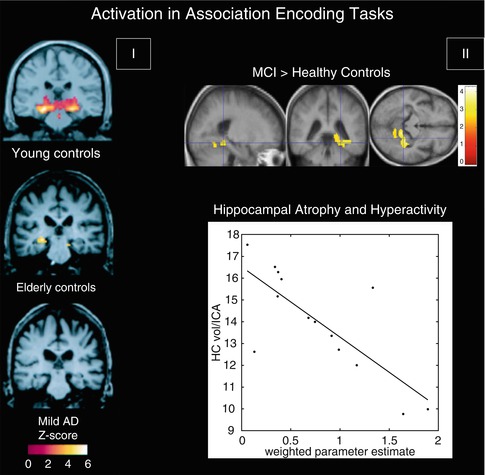
Fig. 20.11
(I) Within-group, random effects average activation maps for the encoding of novel face-name pairs compared to repeated (familiar) face-name pairs for young controls, elderly controls, and patients with mild AD, shown on a representative structural image from each group in the coronal plane at the level of the hippocampal formation (Adapted from Sperling et al. (2003) with permission to reprint granted by BMJ Publishing Group Ltd). (II) Top: between-group statistical activation map showing the increased left parahippocampal and fusiform activation (p < 0.05, corrected; crosshair position −36, −40, −12) in MCI when compared to controls during associative encoding of novel picture-word pairs (contrasted to resting baseline). Color bar presents T values. Bottom: scatter plot illustrating the inverse relationship between hippocampal volume and parahippocampal activation in MCI. The hippocampal volumes (HC vol.; mm3) on the Y-axis were normalized by the intracranial area (ICA; mm2). The weighted parameter estimate on the X-axis is an estimate of the magnitude of parahippocampal activation in the encoding-baseline comparison (Adapted from Hamalainen et al. (2007) with permission to reprint granted by Elsevier)
Perception
Another area of investigation has been visual perception, where one study investigated the alterations in functional activation along the ventral and dorsal visual pathways using two different cognitive paradigms that were matched for performance (Bokde et al. 2008). The healthy control group selectively activated the ventral and dorsal pathways during the face and location matching tasks, respectively, while the MCI group did not show this functional separation. In addition, the MCI group had greater activation than the HC group in the left frontal lobe during the location matching task – a task that recruits the dorsal visual pathway. Similarly, in a cohort of AD patients and using the same tasks, it was reported that during the location-matching task the AD group recruited additional regions along the dorsal visual pathway, primarily in the parietal and frontal lobes (Bokde et al. 2010b). In the same paradigm, examination of the functional connectivity of the fusiform gyrus (a key area for processing of faces) in MCI subjects and healthy controls revealed that healthy controls showed higher positive linear correlation between the right middle fusiform gyrus and the visual cortex, the parietal lobes, and the right dorsolateral prefrontal cortex compared to the MCI group (Fig. 20.12), whereas the latter showed higher positive linear correlation with the left cuneus (Bokde et al. 2006). Hence, the putative presence of AD neuropathology in MCI affects the functional connectivity of the fusiform gyrus during processing of faces despite normal task performance. In addition, higher linear correlation in the MCI group in the parietal lobe may indicate the initial appearance of compensatory processes. Another study utilized an angle discrimination task to investigate changes in AD patients along the visual pathways and found the most pronounced differences compared to healthy controls in the superior parietal lobule (more activity in controls) and the occipital-temporal cortex (more activity in patients) (Prvulovic et al. 2002). Given that the differences in functional activation between the AD patients and controls were partly explained by the differences in superior parietal lobe atrophy, these results indicate that atrophy-related parietal dysfunction in mild to moderate AD may be compensated by recruitment of the ventral visual pathway.
Fig. 20.12
Map of the regions showing statistically significant differences in functional connectivity of the fusiform gyrus during the visual discrimination task between healthy control and MCI groups (From Bokde et al. (2006) with permission to reprint granted by Oxford University Press)
Task-Related Deactivation
While cognitive tasks generally induce a significant increase of activity in brain areas subserving various aspects of the specific task at hand, there is also a network of brain regions that consistently reduces its activity from a baseline resting condition during performance of a wide range of cognitively demanding tasks. These task-related deactivations (TRDs) are suggestive of intrinsic brain activity attributable to a baseline state or “default mode” and led to the definition of the default mode network (DMN) (Raichle et al. 2001). The DMN includes the posterior cingulate cortex/precuneus, the dorsal and ventral medial prefrontal cortex, the lateral inferior parietal cortices, and the medial temporal lobes. It has been suggested to have a role in intrinsic thought processing, including autobiographical memory, prospection, and mind-wandering, all of which represent typically self-focused cognitive processes in the absence of tasks demanding external attentional focus and effort (Buckner et al. 2008). Thus, under normal conditions activity in the DMN is highly anticorrelated with activity in cortical areas associated with executive function and visuospatial attention which are involved in several forms of active task processing and are commonly referred to as “task-positive network” (Fox et al. 2005). The graded deactivation of the DMN with increasing attentional task demand is consistent with the hypothesis that there is a reallocation of cognitive resources from self-focused processes towards externally directed tasks (Harrison et al. 2011) and failure to deactivate the DMN has been linked to momentary lapses in attention and impaired cognitive control (Weissman et al. 2006; Persson et al. 2007). Consistent with the notion that memory tasks require attentional focus during stimulus presentation in the encoding phase as well as introspective processes during memory retrieval and recognition, dissociation of activity patterns among DMN components has been observed in functional studies with memory paradigms. Thus, while the hippocampus shows positive activation during both encoding and retrieval of successfully encoded novel items, the posteromedial node of the DMN deactivates during successful encoding and activates during retrieval (Vannini et al. 2011). Accordingly, reduced posteromedial deactivation during encoding has been found to predict subsequent retrieval errors (Daselaar et al. 2009), and normal age-related memory impairments are believed to be primarily related to a loss of medial parietal deactivation during encoding rather than hippocampal dysfunction (Miller et al. 2008a).
Several studies have used cognitively demanding tasks, such as semantic classification, verb generation, and working memory paradigms, to study dysfunctional TRD in the continuum from healthy aging to clinical AD (Lustig et al. 2003; Rombouts et al. 2005; Persson et al. 2007). Thus, it could be shown that compared to young adults, older healthy subjects had a smaller magnitude of TRD in the DMN, the differences being especially striking in tasks with higher cognitive demand. Moreover, task-related deactivations of the DMN were further reduced in AD patients of the same age, particularly within the posteromedial node, whereas TRDs in MCI subjects were found to be lower than in healthy controls but still higher than in AD. This continuum of reduced TRD from healthy aging to clinically manifest AD was also noted in a clinical follow-up study, where the magnitude of encoding-related deactivation in the posteromedial cortex was found to be highest in healthy elderly subjects, intermediate in longitudinally stable MCI subjects, and lowest in clinically declining MCI subjects and AD patients (Petrella et al. 2007, 2011) (Fig. 20.13). In the progressive MCI subjects and patients with AD, the sign of the posteromedial activation magnitude parameter estimates was even reversed to positive values, resulting in a paradoxical activation pattern. In the light of these findings and the respective roles for the posteromedial cortex and the hippocampus in memory function, the frequently observed hippocampal hyperactivity in prodromal AD stages (see above as well as in Sect. 20.4.2) may reflect a compensatory mechanism to achieve successful encoding despite reduced parietal deactivation (Miller et al. 2008a). In later stages of accumulating AD neuropathology, increasing hippocampal atrophy and dysfunction may hinder these early compensatory processes, leading to breakdown of the neuronal network subserving memory function.
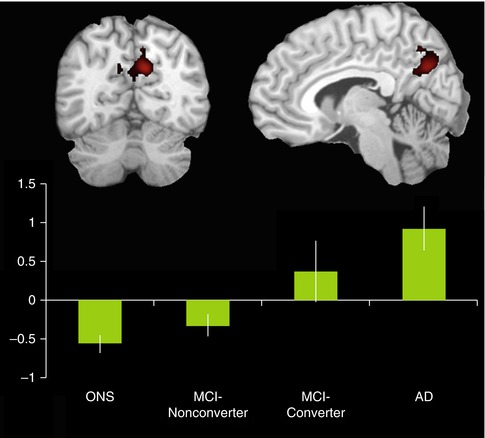
Fig. 20.13
Bar graph shows activation magnitude parameter estimates in a posteromedial region of interest during encoding of novel compared to familiar face-name pairs, demonstrating a continuum from control to MCI-nonconverter, to MCI-converter, and to AD. Differences between groups are statistically significant (p < 0.05) with the exception of the control vs MCI-nonconverter comparison and the AD vs MCI-converter comparison. Note the overall pattern of negative activation magnitude in the control and MCI-nonconverter groups and positive activation magnitude in the AD and MCI-converter groups (Adapted from Petrella et al. (2007); open-access license, no further permission required)
20.4.1.2 Resting-State fMRI
Activations in task-based fMRI studies are usually performance dependent, which limits their applicability for the study of demented subjects. Resting-state fMRI provides a performance level-independent method to studying functional deficits in AD, thereby greatly facilitating data acquisition and minimizing performance-related variability of the functional data. Based on the coherence of spontaneous low-frequency signal fluctuations within functional brain systems, resting-state fMRI data can be used to extract functional estimates of so-called intrinsic connectivity networks (ICNs), which largely overlap with the various functional networks observed in task-based activation studies across multiple sensory and cognitive domains (Smith et al. 2009). Among the most widely used analysis techniques are functional connectivity analysis, a measure of interregional time-course correlation between regions of interest (Biswal et al. 1995), and independent component analysis (ICA), which automatically isolates networks of synchronized coactivation from the fMRI data in a purely data-driven approach (Beckmann et al. 2005). While the ICA approach has the advantage over functional connectivity analyses that the multiple resting-state networks can be detected without necessity for defining (arbitrary) a priori reference points in the data, it is also computationally more demanding and is limited to the study of coherent intra-network coactivation, disregarding potentially important interactions between functional networks.
Given the substantial overlap of the DMN with the predilection sites of AD neuropathology in the MTL, the posterior cingulate, and the temporoparietal neocortex, it is the earliest and most extensively studied functional network in AD (see also the section on TRD in the previous chapter). Thus, using ICA to extract individual representations of the DMN, it could be shown that AD patients exhibit decreased resting-state coactivation of the posterior cingulate and the hippocampus (Greicius et al. 2004). Subsequent ICA-based resting-state studies that investigated AD-related changes across several cognitive ICNs, in addition to the DMN, could confirm these initial findings and further highlighted the relative specificity of DMN disconnection in AD pathology (Agosta et al. 2012; Binnewijzend et al. 2012). While disrupted DMN coactivation in AD was the most consistent finding among these studies, increased resting-state coactivation in frontal networks was also observed, which was interpreted as a possible compensatory mechanism in an attempt to maintain cognitive efficiency. In addition, subtle DMN disruptions, particularly affecting coactivation of the posterior cingulate and the hippocampus, were already detectable in MCI subjects. This is in line with a previous ICA-based investigation of resting network disruption in MCI, which found reduced network-related activity in the DMN and also within its anticorrelated independent component representing the executive-attention network (Sorg et al. 2007). However, other ICA studies focusing on DMN disruption in the predementia phase of AD found that although the MCI subjects exhibited decreased coactivation in the posterior parietal and medial temporal lobes, other regions of the DMN, including the superior prefrontal cortex and the middle temporal lobe, showed increased resting activity compared to healthy controls (Qi et al. 2010; Damoiseaux et al. 2012). Similarly, in a longitudinal study on functional DMN disruption in MCI that rigorously controlled for regional gray matter atrophy, MCI subjects showed even increased posteromedial DMN coactivation at baseline. However, over clinical follow-up the MCI subjects showed strongly decreasing coactivation of the posterior and anterior-ventral midline nodes and increasing activity in superior frontal regions compared to age-matched controls. Furthermore, the longitudinal decline in resting posteromedial coactivation correlated strongly with declining episodic memory function as assessed by neuropsychological tests outside the scanner (Bai et al. 2011a). These findings indicate that during the preclinical phase of AD, both disruptive and compensative processes coexist within the DMN resting activity.
Complementary to the ICA-based studies on intrinsic network changes, functional connectivity analysis has been widely used to study functional disconnection in the course of AD. Reference points for voxel-based functional connectivity analyses have been typically chosen among prominent nodes of the DMN, including the posterior cingulate, hippocampus, and medial prefrontal cortex (Wang et al. 2006; Zhang et al. 2010; Bai et al. 2011b; Gili et al. 2011), but also within other ROIs, such as the dorsolateral prefrontal cortex (Liang et al. 2011), temporoparietal junction (Liang et al. 2012), insula (Xie et al. 2012), or the thalamus (Wang et al. 2012). Despite some heterogeneity, which may be attributable to differing sample characteristics, image processing strategies, and seed point specification, the findings from these functional connectivity analyses clearly confirm a progressive disconnection among the DMN components in the course of AD (Fig. 20.14). The functional isolation of the posterior cingulate from its main interaction sites in the MTL and the medial prefrontal cortex appears to emerge particularly early in the disease process and was found to be related to worsening episodic memory function in MCI subjects (Bai et al. 2011b; Gili et al. 2011). However, while disconnection between DMN components is the most consistent finding across seed-based functional connectivity studies, there is also preliminary evidence of impaired connectivity among components of the executive-attention network, which deserve further investigation (Liang et al. 2011, 2012; Brier et al. 2012).
An alternative approach that was used to study connectivity changes over the entire brain, independent of a specific seed point, consisted in subdividing the brain into 116 anatomically defined regions and examining the functional connectivity across all pairs of ROIs (Wang et al. 2007). It was found that AD patients had decreased positive correlations between the prefrontal and parietal lobes but also increased positive correlations within the prefrontal lobe, parietal lobe, and occipital lobe. Hence, the results are consistent with previous reports of a large-scale anterior-posterior disconnection across the brain and increased within-lobe functional connectivity in AD. Interestingly, it was also found that AD patients showed significantly lower negative correlations between components corresponding to the DMN and components of its intrinsically anticorrelated “task-positive network,” which may be related to the decreased downregulation of DMN baseline activity in attentionally demanding tasks (Lustig et al. 2003; Kelly et al. 2008). Other studies used similar parcellations of the brain into anatomically defined ROIs (nodes) to reconstruct whole-brain functional networks based on appropriate thresholding of the functional connectivity matrix of pair-wise correlation coefficients (paths) (Supekar et al. 2008; Sanz-Arigita et al. 2010). Application of graph-theoretical analysis revealed that the so constructed functional brain networks in healthy controls showed small-world organization of brain activity, characterized by a high clustering coefficient and a low characteristic path length, indicative of strong local connectivity and an optimal network structure through efficient long-range information transfer. In contrast, the functional brain networks in AD showed loss of small-world properties, characterized by a significantly lower clustering coefficient or an increased characteristic path length, rendering the network metrics closer to the theoretical values of random networks and supporting the hypothesis of disrupted global information integration in AD (Fig. 20.15).
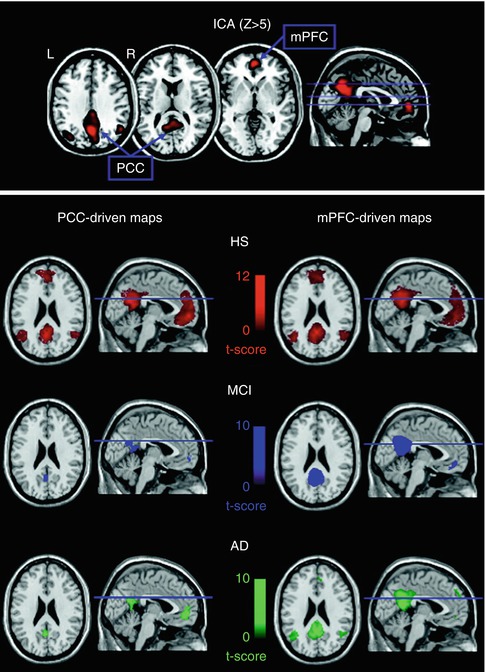
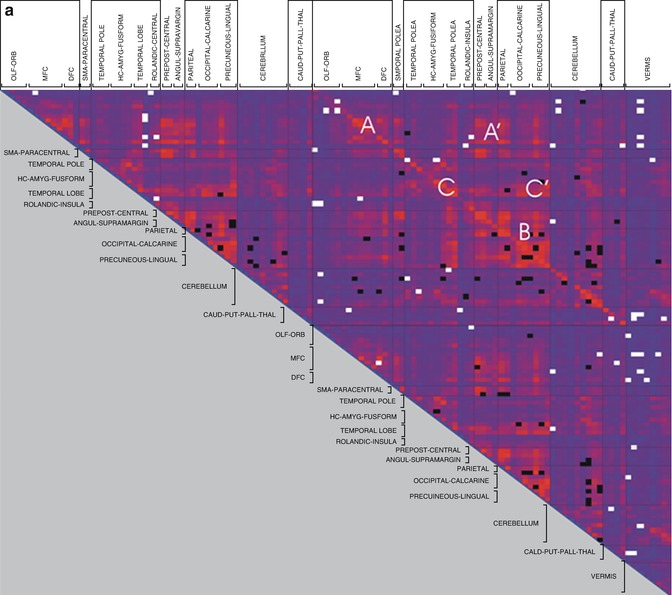
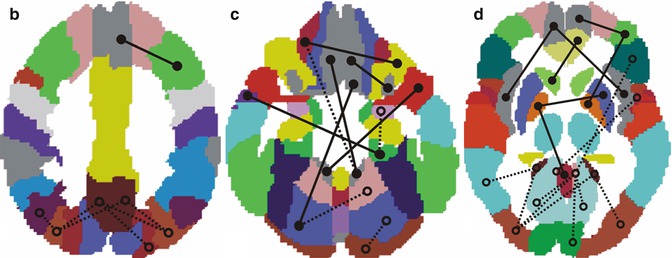
Fig. 20.14
Top panel illustrates the mean spatial independent component representing the default mode network. Blue arrows indicate the two regions (posterior cingulate (PCC) and medial prefrontal cortex (mPFC)) with the highest Z peak, which were selected as regions of interest for subsequent correlation analysis. Bottom panel shows, for each studied group (healthy subjects (HS), amnesic mild cognitive impairment (a–MCI), and Alzheimer’s disease (AD) patients), results of correlation analysis obtained using the PCC (left) and the mPFC ROI (right) to produce connectivity maps. All functional results are superimposed on a high-resolution single subject T1-weighted volume template (From Gili et al. (2011) with permission to reprint granted by BMJ Publishing Group Ltd.)
Fig. 20.15
Matrix of significant differences in functional connectivity between AD and controls (two-tail t-test, p < 0.05 uncorrected). The white and black dots represent pairs of brain areas with increased and decreased synchronization in AD, respectively. (b–d) A subset of connectional differences corresponding to the matrix (a) are plotted at three superior to inferior levels through the brain template of the structural atlas: (b) = z53; (c) = z73; (d) = z111. Lines depict synchronization between pairs of regions: solid lines = enhanced synchronization; dashed lines = reduced synchronization. Note the pattern of generalized posterior (parietal and occipital) synchronization reductions and increased frontal synchronization (From Sanz-Arigita et al. (2010); open-access license, no further permission required)
20.4.2 Genes, Molecular Pathology and Lifestyle Factors
20.4.2.1 Genetic Risk and Familial AD
In addition to the changes in brain activity seen in AD patients and neuropsychologically defined risk models of AD, such as MCI, there is also evidence of genotypic effects contributing to abnormal brain function. These effects can be exerted by fully penetrant mutations of familial AD, APOE genotype, or yet to be identified risk genes associated with a positive family history of sporadic AD.
One study in cognitively normal older healthy subjects found that carriers of the APOE4 allele showed higher activation in task-relevant areas during the encoding and recall of semantically unrelated words when compared to healthy noncarriers (Bookheimer et al. 2000). Again, the higher levels of brain activation in the APOE4 carriers were interpreted as being due to compensatory mechanisms. Other studies also reported results that are consistent with the hypothesis of increased activation due to compensatory mechanisms in APOE4 carriers, for example, during encoding of pictures (Bondi et al. 2005), during encoding of word pairs (Fleisher et al. 2005), and during working memory with an n-back task (Wishart et al. 2006); in these studies there were no regions with decreased activation in the APOE4 carriers compared to the noncarriers. However, this pattern of activation has not been a consistent finding. Thus, another study reported decreased hippocampal activation in APOE4 carriers compared to noncarriers during performance of an encoding task (Trivedi et al. 2006). Similarly, during a semantic categorization task, healthy subjects with the APOE4 allele had lower activation in the parietal cortex compared to noncarriers (Lind et al. 2006). The differences in activation between APOE4 carriers among the studies may be explained, in part, due to differences in the cognitive paradigms utilized and the age of the participants in the studies (ranging from mid-40s to 80s) but also due to the presence of other risk factors such as a positive family history of sporadic AD. Thus, in a task comparing new items to previously learned items, persons with a first-degree family history of AD had lower functional activation to novel items in the medial temporal lobe and fusiform gyrus bilaterally compared to controls without a family history of sporadic AD (Johnson et al. 2006b). In hippocampal areas, the group composed of subjects without family history but with APOE4 genotype exhibited the greatest activation, and the group composed of subjects with positive family history and APOE4 genotype had the smallest level of activation. Furthermore, in another study it was found that family history and age exerted independent effects on brain activation patterns during episodic encoding, whereas APOE interacted with age such that APOE4 carriers exhibited age-related increases in activity in the hippocampus (Trivedi et al. 2008).
One study compared the brain activation patterns during an encoding task between cognitively healthy subjects with APOE4 genetic risk and subjects with fully penetrant familial Alzheimer’s disease mutations, providing evidence that APOE4-associated effects on brain activity may be partially independent of those exerted by familial Alzheimer’s disease mutations (Ringman et al. 2011). They found that the presymptomatic mutation carriers had lower activation in the anterior cingulate gyrus bilaterally and the left frontal pole compared to non-mutation carriers, whereas the APOE4 carriers had greater activation during the task compared to noncarriers of the APOE ε4 allele. These findings suggest that the increased activation seen in the APOE4 carriers may not be due solely to compensatory mechanisms but may indicate, in part, an independent physiological mechanism.
The changes in regional task-related activation seen in healthy subjects at genetic risk for sporadic AD also extend to a dysfunctional regulation of default mode activity. Thus, when performing a semantic categorization task known to suppress DMN activity, healthy elderly APOE4 carriers showed less TRD compared to age-matched noncarriers (Persson et al. 2008). This finding was later reproduced using a memory encoding task and it was shown that greater failure of posteromedial deactivation during encoding was related to worse delayed recall performance as assessed by neuropsychological tests (Pihlajamaki et al. 2010). Using an ICA approach to investigate DMN activity at rest, it could be demonstrated that healthy APOE4 carriers showed increased hippocampal DMN synchronization compared to noncarriers, which was supposed to reflect ε4-related failure in hippocampal decoupling, possibly resulting in an elevated hippocampal metabolic burden and increased risk of cognitive decline and AD (Westlye et al. 2011). However, functional connectivity analysis of resting-state data demonstrated decreased connectivity between a posteromedial seed and other DMN nodes in healthy APOE4 carriers compared to noncarriers (Machulda et al. 2011


Related posts:

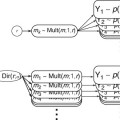
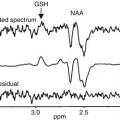
Stay updated, free articles. Join our Telegram channel
Full access? Get Clinical Tree
