Fig. 2.1
General technical setup and information flow during real-time fMRI experiments used for neurofeedback and other brain-computer interface (BCI) applications (Adapted from Goebel et al. 2010). Following acquisition of functional data (1), the images are reconstructed (2) and sent to the scanner console’s hard disk (3). The real-time fMRI analysis PC (4) accesses the reconstructed images as soon as possible. Calculated feedback signals (or visualizations) are transferred to the stimulation PC (5), which sends the final feedback visualization (here a simple thermometer display) via a projector (6) onto the screen (7) and is then visible to the participant
There are, in principle, at least two ways in which self-regulation of brain activity through fMRI-NF may be beneficial in neurological and psychiatric disorders. It may help rectify pathological hyper- or hypoactivation of specific brain areas or network, and/or it may boost the recruitment of compensatory circuits for particular tasks (e.g., motor control) or cognitive processes (e.g., emotion regulation). The latter possibility is particularly attractive in cases where brain tissue may have been damaged by the disease, for example, in stroke, or where no clear abnormalities have been established, as in most psychiatric disorders (Linden 2012b). Here, the knowledge about the canonical neural circuits underlying emotion and cognition derived from 20 years of fMRI can provide the basis for neurofeedback protocols that help patients recruit the functional systems needed to overcome their symptoms (Linden 2013).
fMRI-NF has been boosted by developments in MR physics, allowing for fast acquisition of high-quality data sets, and data analysis, allowing for online calculation of univariate and multivariate statistics. While improvements in hard- and software are still being made, fMRI-NF is now a mature experimental technique, and the exciting question for the next decade will be whether it can make a true translational contribution in medicine. The central challenges are identifying the symptoms and disorders that will respond to fMRI-NF, adapting the treatment protocols to the neural networks involved in each of them, evaluating the underlying neuroplastic mechanisms, and devising training strategies that enable sustainable long-term effects (Sulzer et al. 2013).
2.2 Principles and Methods
2.2.1 Learning Theory
Attempts to train humans and animals to regulate their own brain activity, feeding back signals from noninvasive (electroencephalography [EEG]) or invasive recordings, go back to the 1960s (reviewed by Birbaumer and Cohen 2007). The theoretical principles were largely derived from operant conditioning, whereby the participant learns the optimal strategy through the contingencies between their actions and a reward. In an animal, the reward would have to be a primary reward. For example, the desired neural response would be reinforced by the delivery of food or drink. In humans, the information about the achievement of a particular neural target (e.g., increasing the ratio between theta and alpha power of the EEG by 20 %) could itself be the reward. Whether this reward reinforces a particular mental strategy that leads to the desired physiological response or the physiological response itself is a futile question because the two cannot be separated in any meaningful way under the assumptions of psychophysical unity. It has been reported that humans can achieve reliable self-control over parameters of their EEG, for example, the topography of slow cortical potentials, the alpha-theta ratio, or the ratio between sensorimotor rhythm and theta activity, through such operant conditioning.
FMRI-based neurofeedback (fMRI-NF) can be conducted in a similar fashion, where participants are blind to the functional relevance of the targeted activation and essentially aim to achieve self-regulation by trial and error (Weiskopf et al. 2004b; Birbaumer et al. 2013). However, fMRI-NF can also harness the considerable knowledge about the neural basis of particular mental and cognitive processes that the last 20 years of functional brain mapping have achieved and introduce a cognitive component into the learning strategy. For example, in our study on upregulation of the supplementary motor area in Parkinson’s disease (Subramanian et al. 2011), patients were told about the motor planning functions of the target area and informed that motor imagery might be one viable strategy to upregulate it. Giving patients initial hints about potential strategies for the upregulation training, which they can then refine through an operant conditioning protocol with fMRI-NF, can considerably reduce scanning time and provide patients with tangible results within one scanning session (Subramanian et al. 2011). Using this cognitive hypothesis testing strategy for neurofeedback training, the temporal relationship between mental actions and reward (information about achievement) may be delayed for several seconds without problems since participants use cognitive systems such as working memory to evaluate performed mental tasks with respect to feedback information obtained with a few seconds of delay.
2.2.2 Real-Time Processing and Analysis of fMRI Data
In order to enable neurofeedback applications, the measured fMRI data needs to be processed online, that is, during functional scanning; data analysis should preferentially operate in real time, that is, analysis for a newly measured functional volume should be completed before the next functional volume becomes available. Real-time processing (as opposed to near real-time fMRI), thus, restricts processing time to a maximum duration (volume time to repeat (TR)) that is defined by the temporal interval between successive functional volumes, which typically assumes values between 1 and 3 s. The requirement for incremental analysis in limited time windows is in contrast to conventional fMRI analyses processing data offline, that is, data analysis only starts after the fMRI scanning session has actually ended without specific restrictions in calculation time.
A basic prerequisite of real-time fMRI (rt-fMRI) analysis is that images are reconstructed from k-space to image space as fast as possible. Incremental image reconstruction is usually performed directly on the scanner using fast image reconstruction computers, that is, data is stored to disk volume by volume (or slice by slice) in image space, usually in DICOM format. Besides image reconstruction, most scanner manufacturers also provide basic real-time analysis tools, which are sufficient for simple applications such as quality assurance. For advanced real-time applications such as neurofeedback, specialized software packages are usually employed that provide comprehensive preprocessing options, advanced (statistical) analysis tools, ROI extraction, and specialized visualization routines. Data acquisition techniques and analysis software have been considerably improved since the introduction of real-time fMRI (Cox et al. 1995). The first real-time fMRI setups provided limited processing capabilities, lacking, for example, motion correction, or moment-to-moment statistical analysis. Recent real-time fMRI studies employ analysis pipelines that include almost all preprocessing and analysis steps used in conventional offline analysis (see chapter fMRI analysis). Here we provide a short overview of typical analysis workflows; more detailed reviews are provided, among others, by Weiskopf et al. (Weiskopf et al. 2004b), deCharms (2007, 2008), LaConte (2011), and Caria et al. (2012).
Most real-time processing pipelines include rigid-body 3D motion correction that detects head movements in the same way as used in offline analysis; in order to allow motion correction from the second time point onwards, the first functional volume (instead of, e.g., the middle one) is used as the reference to which subsequent functional volumes are aligned. In order to reduce calculation time, realignment of images to the reference volume is usually performed using trilinear interpolation, but since interpolation is nowadays also possible in real time when using parallel implementations that exploit the power of general purpose graphics processing units (GP-GPUs). To enhance signal contrast, spatial Gaussian smoothing may be optionally performed. Removal of linear and nonlinear trends is typically not performed as a preprocessing step, but it is incorporated in the statistical analysis using low-frequency drift predictors.
In order to guarantee constant (and fast) processing time, univariate statistical data analysis is usually performed recursively, that is, estimated statistical parameters are updated by the information arriving with the next available functional volume instead of estimating them using the whole available time course from the first volume up to the volume of the current time point (Bagarinao et al. 2006). If the whole time course is used, calculation time of conventional algorithms (e.g., correlation analysis) increases with growing data sets bearing the risk of lagging behind the incoming data at some point. Instead, incremental algorithms provide constant calculation time per data point (volume) and enable real-time processing even for very long functional scans.
While correlation analysis was used in early real-time fMRI studies, full (incremental) general linear model (GLM) analyses are now usually performed (Goebel 2001; Smyser et al. 2001; Bagarinao et al. 2003; Weiskopf et al. 2004b; Hinds et al. 2011). While the design matrix for main experimental conditions may be built in advance for a planned experiment, sophisticated implementations allow building the design matrix incrementally allowing to incorporate real-time imaging and behavioral data as it becomes available. This allows, for example, that trials are assigned “on the fly” to specific experimental conditions with respect to trial-by-trial performance of the participant in the scanner. Incrementally built design matrices also allow incorporation of parameters obtained volume by volume from a 3D motion correction routine that may help to reduce residual motion artifacts. The real-time GLM design matrix may also contain confound predictors to model drifts in voxel time courses. Basic low-frequency drift removal can be achieved by adding a linear trend predictor; for nonlinear trends, discrete cosine transform (DCT) confound predictors may be incrementally added to the design matrix. Removing drifts is especially important for neurofeedback experiments in order to ensure that visualized increases or decreases of activity are caused by mental tasks and are not the result of unrelated signal drifts.
Note that the described (incremental) statistical analyses are usually operating at the single voxel level providing dynamic whole-brain statistical maps that integrate information of the whole voxel time course data from the beginning of the functional scan up to the currently processed volume. It is also possible to restrict the calculation of whole-brain voxel-wise statistical maps to a sliding window; depending on the specified size of the sliding window, obtained maps reflect more dynamic changes (short sliding window) or more stable effects (large sliding window). While these whole-brain voxel-wise maps are not strictly necessary to calculate region-specific neurofeedback signals (see below), whole-brain maps are also very useful during neurofeedback runs serving as a quality assurance tool; whole-brain maps allow, for example, to inspect activity in emotion, attention, and control networks indicating whether the participant is engaging in mental tasks.
2.2.3 Feedback and Stimulus Delivery
Neurofeedback signals are often calculated from restricted temporal windows that start with a rest period from which an up-to-date baseline signal level is calculated for a subsequent active mental task period. The windowed analysis approach with a rest and mental task period of 15–30 s has the advantage that slow drifts have minimal impact on the neurofeedback signal since all relevant time points are in close temporal proximity. Given a baseline level ybl, the feedback value yfb for subsequent time points can then be calculated simply as
The value yfb expresses activity changes with respect to the baseline level as a percent signal change value. In order to remove local drifts within a single neurofeedback window, they can be estimated in the baseline period and removed from subsequent time points, for example, by using a GLM with a linear confound predictor.
Calculation of (window-based) neurofeedback signals does usually not operate at the single voxel level but uses the mean signal time course from selected neurofeedback target regions or networks. The regions of interest (ROIs) serving as target regions are defined anatomically or by running functional localizer scans prior to the actual neurofeedback session. The averaged signal time course from a functionally defined ROI usually provides higher signal modulation values and lower noise fluctuations than when using anatomical ROIs.
The calculated neurofeedback signal can be visualized in various ways to the participant in the scanner, for example, as the level in a thermometer display (see Fig. 2.1). In order to convert the calculated percent signal change value into a corresponding level of a thermometer display, the percent value is usually related to a maximum percent signal value; the maximum modulation value is either specified based on general experience with BOLD signal amplitudes in various regions, or it is derived from measured responses in the same individual using prior localizer or neurofeedback runs. If, for example, the calculated feedback value is 1.5 % and the maximum percent value has been set to 3 %, the thermometer will be shown as half filled to the participant. This visualization approach assumes that only increases of activity relative to the baseline are considered. In case one wants to also visualize deactivations, the (thermometer) display needs to be extended for negative values accordingly. Besides simple activation displays (thermometer, continuous scrolling time course, numerical value), more expressive visualizations have been used in the past such as images of a virtual fire that increased in size with increasing activation levels (deCharms et al. 2005), level of a racket in a “brain pong” computer game (Goebel et al. 2004), and virtual reality (Sitaram et al. 2005). Furthermore, feedback may also be provided via haptic or auditory stimuli, but not much experience is currently available. While simple feedback representations may be generated directly from the used real-time analysis software, more complex visualizations usually require custom-made software accessing feedback signals calculated by the real-time analysis software. Note that it is also possible to present feedback from multiple areas simultaneously. In a recent study (Zilverstand et al. 2014), two thermometer displays have been used where one thermometer represented activity in the control network, while the other thermometer represented the activity level of areas related to fear responses.
Since neurofeedback studies often span over multiple sessions, it is important to transfer defined ROIs from one session to the next. This can be done by aligning 3D anatomical data sets across sessions and projecting voxel coordinates marked on anatomical data sets to the aligned functional data measured in subsequent sessions. While not strictly necessary, across-session alignment may be facilitated by normalizing the brain of a participant to a standard (e.g., ACPC or Talairach) space that keeps generic representation of the location of ROIs and allows to project them in any scan-specific space using spatial transformations obtained from alignment procedures. If brain normalization is performed prior to functional runs, real-time (statistical) data can be projected on standard orthogonal brain slices as opposed to visualizations on arbitrarily positioned slices in the native scanning space in a particular session. If a high-quality anatomical data set is available prior to functional scanning, it is even possible to visualize results, for example, dynamic statistical maps, on reconstructed, inflated, or flattened cortex representations using fast automated 3D segmentation and cortex reconstruction tools (Goebel 2001).
2.2.4 Neurofeedback Based on Real-Time Pattern Analysis
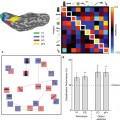
As for offline analysis, multi-voxel pattern analysis (MVPA, see chapter fMRI analysis) is gaining increasing interest also for real-time fMRI neurofeedback studies (e.g., LaConte et al. 2007; Sorger et al. 2010). One reason of the popularity of MVPA is based on its potential to detect differences between neural correlates of mental states with higher sensitivity as conventional univariate statistical analysis. The higher sensitivity may also be beneficial for neurofeedback studies since distributed activity patterns may reflect activity modulations better than ROI-based approaches. In a recent application, volunteers achieved successful control of emotion-related activation patterns using a real-time support vector machine (SVM) classifier (Sitaram et al. 2011).
MVPA may also serve as a method to localize brain systems for subsequent neurofeedback as an alternative to using univariate GLM statistical analysis; as opposed to focal ROIs, MVPA may be especially useful to identify complex and interacting activity patterns over the whole brain as targets for neurofeedback (LaConte 2011; LaConte et al. 2007).
In the context of fMRI neurofeedback patient studies, MVPA may also be used in a novel way, namely, to let patients learn to “mimic desired brain states, or mimicking the brain states of others” (deCharms 2008). In this scenario, the feedback signal provided to a patient would not reflect activity levels in regions or networks, but it would reflect how much the currently evoked activity pattern resembles a desired target pattern. This approach requires more fundamental research in cognitive and affective neuroscience in order to explore whether it will be possible to define desirable brain states for specific patients. Since this would likely involve a transfer of desirable neural activation states to other participants, further research and application of advanced brain normalization schemes, such as cortex-based alignment (Fischl et al. 1999; Goebel et al. 2006), is important in order to relate corresponding brain regions across participants’ brains as precisely as possible.
2.2.5 Real-Time Network Analysis and Feedback of Functional Connectivity
Besides univariate statistics and distributed pattern analyses, data-driven multivariate analysis tools may provide important complementary real-time information. As an example, windowed independent component analysis (ICA) has been introduced for real-time fMRI analysis (Esposito et al. 2003) allowing to detect and visualize dynamic activity changes in functional brain networks that occur at unpredictable moments during a real-time fMRI experiment.
It is also possible to use gradual values from multi-voxel pattern classification (or better regression) directly as a feedback signal with the rationale that optimally weighted voxel activity in distributed networks leads to integrated values that may differentiate fine-grained aspects of mental representations better than region-based methods. It has been, for example, shown that sparse regression-based online feedback leads to orientation-specific visual perceptual learning without presentation of an actual stimulus or subjects’ awareness of what was to be learned (Shibata et al. 2011).
Another interesting avenue is to use functional or effective connectivity measures as a feedback signal instead of mean activation levels. Increasing or decreasing a visualized feedback signal would then reflect a stronger (upregulation) or weaker (downregulation) coupling between brain areas instead of (only) the mean activation level of the involved areas. This approach seems especially important since current research from clinical neuroscience on brain correlates of psychiatric and neurological disorders indicates that fMRI-based functional connectivity measures may belong to the most robust indicators of pathological brain processes. The online estimation of functional or effective connectivity between two or more brain areas requires, however, that a sufficiently long sliding window is used in order to calculate robust “instantaneous” coupling strength values. In a recent offline study, it has been shown that time windows of about 20 time points are sufficient to calculate robust (partial) correlation coefficients (Zilverstand et al. 2014). This study showed (in the context of various uni- and bimanual motor tasks) that instantaneous functional correlations may indeed provide relevant and unique information regarding ongoing brain processes, which is not captured equally well by standard activation level-based neurofeedback measures. Functional connectivity feedback will also benefit from recent technical advances such as newly developed “multiband” accelerated imaging sequences allowing a substantial increase in the number of collected data points per time unit (Feinberg and Yacoub 2012).
2.3 fMRI-NF Studies of Neural Circuits in the Healthy Brain
2.3.1 Motor Areas
Because a large body of functional imaging literature had shown activation of primary and higher motor cortices during motor imagery, motor areas were a natural target for some of the early studies of self-regulation training. In these early reports, feedback during both actual hand movements and imagined movements allowed participants to regulate activity in primary motor cortex to a desired level (Yoo and Jolesz 2002; deCharms et al. 2004; Yoo et al. 2008) and led to long-term plastic changes in motor networks that were specific to participants receiving neurofeedback (Yoo et al. 2008; Horovitz et al. 2010). However, a recent study, applying careful electromyography (EMG) monitoring for actual hand movements, has questioned whether upregulation of the primary motor cortex is possible by imagery alone (Berman et al. 2012). Higher motor areas, such as the ventral premotor cortex (Sitaram et al. 2012


Related posts:

Stay updated, free articles. Join our Telegram channel
Full access? Get Clinical Tree
