Fig. 9.1
fMRI of the thalamic lateral geniculate nucleus. (a) Localization of LGN. The left and right LGN respond to stimuli in the contralateral visual field and were localized by comparing the response to flickering checkerboards presented in either the left or right field. (b) Eye-biased signals in voxels of a single participant’s right LGN (white box in (a)). The LGN is a six-layered structure with each layer responding to stimuli from either the left or right eye only. Although the individual layers are not easily resolved with fMRI, individual voxels showed a stronger response to stimulation from the right or left eye (color scale shows t-values for the direct comparison). The histograms show the raw fMRI signal distribution for two sample voxels with stimulation of each eye separately, one voxel with a left eye bias and one with a right eye bias (Adapted with permission from Haynes et al. (2005)
9.2.3 Primary Sensory Cortices
The cortical areas receiving the major input from the sensory surfaces, predominantly through the thalamus, are often referred to as the primary sensory cortices (Fig. 9.2). We first describe the location and major characteristics of these cortices before discussing in detail their output pathways (Sect. 9.2.4) and functional properties (Sect. 9.3).
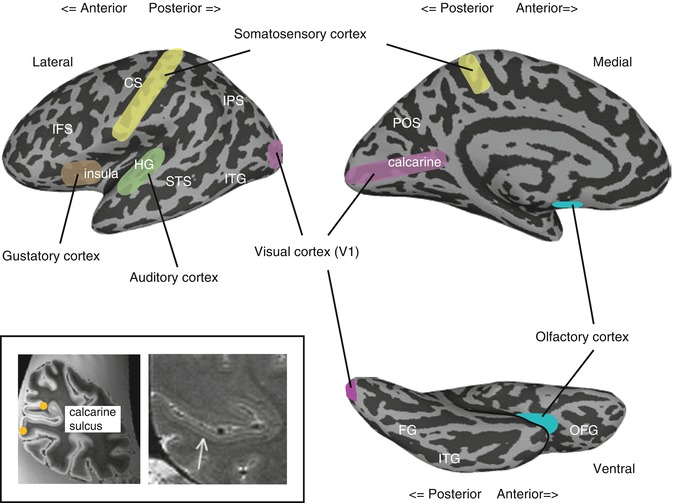
Fig. 9.2
Primary sensory cortices. Inflated views of the cortex showing the location of the primary sensory cortices. The inset shows post-mortem (left) and in vivo (right) images of the calcarine sulcus showing the stria of Gennari – the band of dense myelination corresponding to layer IV in primary visual cortex. The orange circles denote the V1/V2 boundary estimated from the location of the stria (Adapted with permission from Hinds et al. (2008) and Trampel et al. (2011)), respectively. CS central sulcus, FG fusiform gyrus, HG Heschl’s gyrus, IFS inferior frontal sulcus, IPS intraparietal sulcus, ITG inferior temporal gyrus, OFG orbitofrontal gyrus, POS parieto-occipital sulcus, STS superior temporal sulcus
The primary sensory cortices can be distinguished based on cytoarchitectonic (e.g., dense cellular structure and myelination in layer IV reflecting strong input), connectivity (e.g., direct projections from thalamic nuclei), and functional criteria (see Sect. 9.2.4 below). The primary visual cortex (V1), often referred to as the Brodmann area (BA) 17, is located within the banks of the calcarine sulcus on the medial wall of each hemisphere. Using MRI, V1 can be identified in vivo both by detecting the strong layer IV myelination (stria of Gennari, Turner et al. 2008; Sanchez-Panchuelo et al. 2012) and by using the cortical folding patterns (Hinds et al. 2008). The primary auditory cortex is located on Heschl’s gyrus, close to the lateral sulcus (BA 41), and appears to follow very closely the shape of Heschl’s gyrus, which has high morphological variability (Da Costa et al. 2011). The somatosensory cortices are in the anterior parietal lobe comprising four cytoarchitectonic areas (BA 1, 2, 3a, 3b) parallel to the central sulcus. Collectively, these areas are often referred to as the primary somatosensory cortex or S1, with BA3a and 3b contained within the posterior bank of the central sulcus, immediately posterior to the primary motor cortex, and BA 1 and 2 extending onto the postcentral gyrus (Keysers et al. 2010). While these areas are often considered collectively, somatosensory activation can be separately localized to them using fMRI (Moore et al. 2000). The determination of the primary gustatory cortex is complicated by the presence of two gustatory-related projections from the thalamus in nonhuman primates, but in humans it is typically localized to the middorsal insula and overlying operculum (for a competing view, see Ogawa et al. 2005; Small 2010; Veldhuizen et al. 2011b). Similarly, in the absence of direct thalamic projections, the precise location of the primary olfactory cortex is also debated. However, the area receiving most projections from the epithelium is the posterior piriform cortex, and the term primary olfactory cortex is often applied collectively to the piriform cortex and associated structures including the olfactory nucleus and rostral entorhinal cortex (Gottfried 2010).
Together, these primary sensory cortices provide the major source of sensory input for the rest of the cortex – they are the starting point of all modality-specific cortical circuits, each with their own unique pathways (Mesulam 1998).
9.2.4 Parallel and Hierarchical Processing
One of the prominent features of primate sensory systems is parallel processing in which independent circuits or pathways extract distinct types of information simultaneously. The separate sensory systems are themselves an example of parallel processing, but parallel processing is also common within individual sensory systems (somatosensation, Johnson and Hsiao 1992; audition, Kaas and Hackett 2000; olfaction, Savic et al. 2000; vision, Nassi and Callaway 2009). This sometimes even is evident early in the processing stream (e.g., multiple populations of retinal ganglion cells each processing input from the same part of the visual field) and extends into the cortex.
In vision, cortical processing beyond V1 thought to proceed along two major pathways (Ungerleider and Mishkin 1982; Milner and Goodale 2006; Kravitz et al. 2011b): a dorsal pathway (often termed “where” or “how” pathway) projecting into the parietal cortex, primarily involved in processing spatial information, and a ventral pathway (often termed “what” pathway) projecting into the inferior temporal cortex, primarily involved in processing stimulus quality or object information (Fig. 9.3a). These two pathways are readily observed with fMRI (Fig. 9.3b). A similar division of is also well established for auditory processing with a ventral auditory pathway projecting into the anterior temporal cortex involved in processing spectrally complex sounds (e.g., speech, Rauschecker and Scott 2009) and a dorsal auditory pathway projecting into the posterior parietal cortex involved in processing spatial and motion information as well as sensorimotor integration (Rauschecker 2011) (Fig. 9.3a). Finally, in the somatosensory system, there is also some evidence for a separation of spatial processing from stimulus quality processing in both human fMRI (Reed et al. 2005; Van Boven et al. 2005) and nonhuman primate studies (e.g., Murray and Mishkin 1984), but the pathways have not been well characterized (for review, see Dijkerman and de Haan 2007).
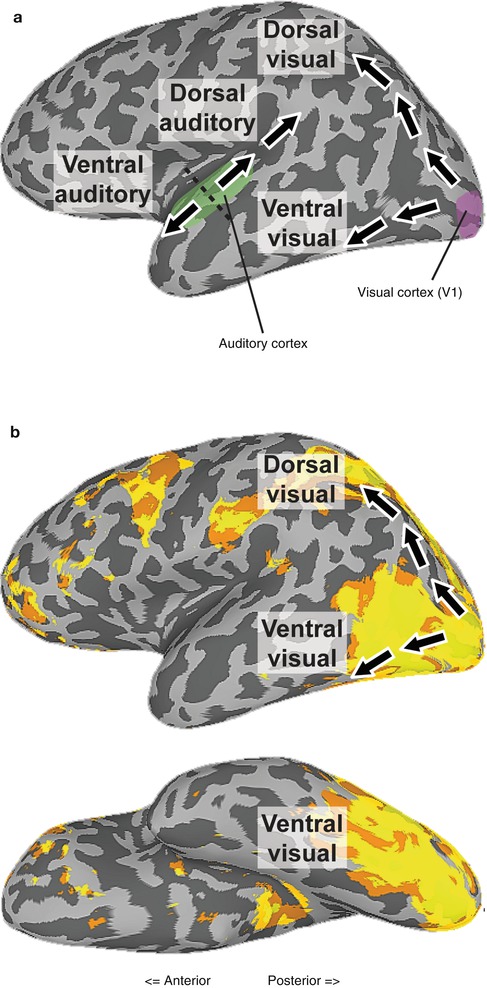
Fig. 9.3
Dorsal and ventral visual and auditory cortical pathways. (a) Illustration of the dorsal and ventral visual and auditory cortical pathways. Black dotted line shows the distinction between anterior and posterior parts of the auditory cortex. (b) Positive activation elicited by viewing movies of body parts relative to a fixation baseline (unthresholded) with the schematic pathways overlaid. Two streams of activation are clearly visible, one extending into the superior parietal cortex and other onto the lateral and ventral surfaces of occipitotemporal cortex (With thanks to A. Chan)
A second prominent feature of cortical sensory systems is their hierarchical nature. Responses in the primary sensory cortices represent simple modality-specific features, while regions further removed from direct sensory input represent complex stimulus features. For example, in audition, human fMRI studies show that the primary auditory cortex responds strongly to simple tones (Wessinger et al. 2001). Selective activation for speech sounds and words, however, is found further along the ventral auditory pathway (Binder et al. 2000; Chevillet et al. 2011; for review and meta-analysis, see DeWitt and Rauschecker 2012). Similarly in vision, V1 can be driven by simple visual features such as oriented lines or contrast, but more complex stimuli (such as faces and objects) are required to drive higher-level visual regions along the ventral pathway (Grill-Spector and Malach 2004). Further, the impact of image scrambling (cutting an image into smaller components) on the magnitude of the observed response increases along the ventral pathway suggesting a growing reliance on global rather than local form (Lerner et al. 2001).
One of the challenges of perception is to enable identification of the same entity despite vast changes in the physical information that may be impinging on the sensory surfaces.
For example, in audition, the spectral frequency of a spoken word may vary substantially depending on the gender, accent, and size of the speaker, yet can still be recognized as the same word even though the early levels of auditory processing are extremely sensitive to changes in physical properties such as frequency (DeWitt and Rauschecker 2012). Similarly, in vision, an object appearing at different locations in the visual field or from different viewing angles can be perceived as the same object even though these variations produce very different patterns of activity on the retina (DiCarlo et al. 2012). It is often assumed that these challenges are overcome through hierarchical processing by progressively abstracting away from the specifics of the input at the sensory surface to produce “invariant” representations (DeWitt and Rauschecker 2012; DiCarlo et al. 2012). For example, the increase in the size of receptive fields (area of space a neuron is responsive to) along the ventral visual pathway in macaque was taken as evidence that the problem of position invariance was somehow solved by the time the signals reached the highest levels of processing (Kravitz et al. 2008). However, even in the anterior temporal cortex, the receptive fields of the neurons only cover a small portion of the visual field (Op De Beeck and Vogels 2000), and position information is present throughout the visual processing hierarchy (Schwarzlose et al. 2008). Further, at least in the case of stimulus position, the behavioral invariance may have been overestimated (Kravitz et al. 2008), and fMRI studies comparing the response elicited by the same object in different locations show a strong effect of position even in anterior regions of the ventral pathway (e.g., Kravitz et al. 2010). Thus, while invariance does increase along the ventral visual pathway, the hierarchy may never produce fully abstract visual object representations. Instead, our ability to identify objects despite changes in the precise nature of the input may reflect the learning of associations between the neural activations elicited by separate occurrences of the same object over time (Cox et al. 2005; Wallis et al. 2009).
9.3 Cortical Organization
So far in this chapter, we have focused on the general structure, principles, and pathways in perceptual systems. In the next section, we will focus in more detail on the functional properties of different regions (see Box 9.2) within these pathways and highlight two aspects of cortical organization: topographic maps and higher-order organization, such as by category.
9.3.1 Maps
The organization of the sensory surfaces is reflected even at the level of the cerebral cortex (Fig. 9.4). For example, in vision, separate representations of the two eyes are maintained through the LGN and into V1, forming ocular dominance columns that can be visualized in humans using fMRI (Cheng et al. 2001; Yacoub et al. 2007). Further, many regions in the visual cortex exhibit retinotopic organization with adjacent neurons responding to stimuli presented at adjacent locations in the visual field and thus stimulating adjacent points on the retina. Finally, the spatial sampling at the retina is much greater at the fovea than in the periphery, and this is reflected in a disproportionately large area of the cortex devoted to foveal vision compared to peripheral vision (Sereno et al. 1995).
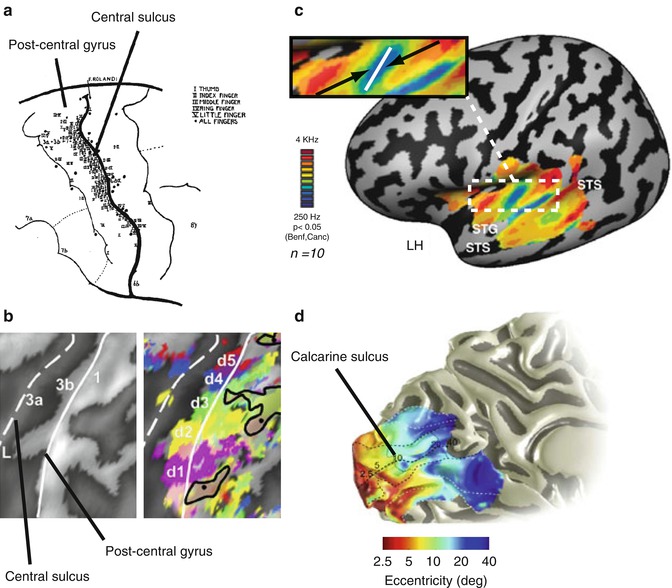
Fig. 9.4
Topographic maps in primary sensory cortices. (a) Stimulation sites eliciting sensations in the fingers. Sites were largely confined to the posterior bank of the central sulcus and postcentral gyrus (Adapted with permission from (Penfield and Boldrey 1937)). (b) Inflated cortical representation of the central sulcus and postcentral gyrus showing fingertip activations elicited by each of the digits. There is an orderly progression from the thumb (d1) to the little finger (d5) (Adapted with permission from (Schweisfurth et al. 2011)). (c) Tonotopic maps in the auditory cortex. Average relative frequency preference map on the left hemisphere revealing multiple frequency bands within and outside Heschl’s gyrus. The enlarged inset shows the mirror-symmetric frequency gradients from high to low to high running across Heschl’s gyrus (Adapted from (Striem-Amit et al. 2011)). (d) Retinotopic eccentricity maps in the visual cortex. Medial view of the left hemisphere showing the increase in eccentricity preference from the fovea to the periphery, moving more anteriorly along the calcarine sulcus (Adapted with permission from Wandell and Winawer (2011)
Prior to fMRI, most of the knowledge of retinotopic maps in the brain was based on studies of human patients with lesions to the visual cortex (Holmes 1931; Horton and Hoyt 1991) and invasive studies in nonhuman primates (Tootell et al. 1982). However, fMRI has enabled the identification of a multitude of such retinotopic maps both in subcortical structures (LGN, Schneider et al. 2004; e.g., superior colliculus, Katyal et al. 2010) and throughout visual cortex from V1 onwards (e.g., Sereno et al. 1995). The presence of a complete map of visual space is one of the criteria used to define a distinct cortical area (for review, see Wandell et al. 2007).
Topographic maps can be identified by systematically varying specific stimulus dimensions and measuring the corresponding changes in the BOLD (blood oxygenation level dependent) response (Engel 2012). Typically, the dimensions manipulated reflect the dimensions mapped by the sensory surface. For example, visual field maps can be identified by systematically varying either the eccentricity (distance from the center of gaze) or polar angle (angular distance from the horizontal or vertical meridian) of a flickering checkerboard and estimating each voxel’s preferred visual field position along both dimensions (Engel et al. 1994; for review, see Wandell and Winawer 2011). An alternative model-based approach estimates the population receptive field for each voxel (Dumoulin and Wandell 2008). Using these methods, field maps have been identified not only in the occipital lobe (corresponding to V1, V2, and V3) (e.g., Sereno et al. 1995) but also more anteriorly along both the dorsal (e.g., Swisher et al. 2007) and ventral pathways (e.g., Larsson and Heeger 2006; Arcaro et al. 2009).
In audition, mapping studies have systematically varied the frequency of tones revealing tonotopic (or “cochleotopic”) maps, reflecting the organization of hair cells in the cochlea (Vonbekesy 1949). Such mappings reveal a mirror-symmetric tonotopic organization (high-low-low-high) in the human primary auditory cortex (Woods et al. 2009; Da Costa et al. 2011; Langers and van Dijk 2012) that runs across or perpendicular to Heschl’s gyrus (but see Formisano et al. 2003; Da Costa et al. 2011). Additional frequency gradients have been found in multiple sites in the auditory cortex (Talavage et al. 2000, 2004; Humphries et al. 2010), extending to higher-order auditory regions in the temporal lobe (Striem-Amit et al. 2011).
Perhaps the most renowned cortical maps are the somatotopic maps forming a somatosensory homunculus in the cortex. Consistent with Penfield’s groundbreaking electrical stimulation studies (Penfield and Boldrey 1937), human fMRI has revealed a highly detailed systematic representation of body surface along the postcentral gyrus and posterior bank of the central sulcus (Medina and Coslett 2010). The homunculus shows an upside-down medial-to-lateral organization in the primary somatosensory cortex: the feet, legs, and genitals are represented medially, whereas the face and hands are represented along the lateral aspects of the postcentral gyrus (Huang and Sereno 2007). The resolution of current fMRI methods is sufficient to distinguish between representations of the individual digits on the hand (Nelson and Chen 2008; Schweizer et al. 2008; Sanchez-Panchuelo et al. 2010; Stringer et al. 2011), with an ordered mapping from the thumb (lateral) to the little finger (medial) and identify distinct intradigit representations (Overduin and Servos 2004; Schweisfurth et al. 2011).
The overall medial-lateral topographic organization extends to the secondary somatosensory cortex (SII) in the parietal operculum, although the representation is less fine grained than in S1 (Disbrow et al. 2000; Ruben et al. 2001; Eickhoff et al. 2007).
The properties of these topographic maps are directly reflected in behavior. For example, in both somatosensory and visual processing, the size of the cortical representation in V1 or S1 for that location in visual space or for a given finger correlates with behavioral acuity (Duncan and Boynton 2003, 2007) and with the change in psychophysical thresholds following learning (Pleger et al. 2003). In turn, these cortical representations likely reflect both the density of receptors on the sensory surfaces and the density of connections between the thalamus and cortex.
In contrast to vision, audition, and somatosensation, the evidence for cortical topographic maps in the chemical senses (olfaction and gustation) is less clear. In olfaction, studies in rodents suggest a rough spatial organization at the level of the olfactory epithelium, with different olfactory receptors representing perceptually similar odorants clustered together that is also reflected in the organization of the olfactory bulb (for review, see Murthy 2011). This organization is not, however, retained in the cortex with olfactory bulb neurons projecting to very broad regions of the piriform cortex (Illig and Haberly 2003). Correspondingly, chemotopic organization has not been reported in human fMRI studies of the piriform cortex (Arzi and Sobel 2011). Nevertheless, fMRI has been used to uncover other forms of functional organization in the piriform cortex. For example, different parts of the piriform cortex are sensitive to different odorant attributes: the anterior piriform cortex is sensitive to the chemical structure of odorants, while the posterior piriform cortex is sensitive to the perceptual quality of odorants (Gottfried et al. 2006).
Finally, the human gustatory cortex has also not been found to contain systematic sensory maps. One major factor contributing to the lack of such an observation may be the large extent to which the gustatory cortex is multimodal and integrative (Small and Prescott 2005; Rolls 2006). fMRI studies suggest that besides encoding the basic tastes (bitter, sweet, salt, sour, umami: de Araujo et al. 2003), the gustatory cortex also responds preferentially to odors (Small et al. 2005), to the combination of odor and taste (Small et al. 2004), to somatosensory oral textures (e.g., viscosity and lubricity), and to their combination with particular tastes as well as other chemical properties, such as fat concentration (Eldeghaidy et al. 2011).
9.3.2 Higher-Order Representations
Beyond maps, which may reflect the organization of the sensory surfaces, neural representations in the cortex may cluster according to the properties or features of the stimuli themselves. This has been most extensively investigated in vision with specific visual areas or patches of cortex that are primarily responsive to features such as motion (Huk et al. 2002) or color (Conway et al. 2007; Wade et al. 2008).
Further, by contrasting the magnitude of response elicited during presentation of different categories of objects, fMRI has revealed a number of visual category-selective regions in the human occipitotemporal cortex (OTC) (Fig. 9.5, for review, see Kanwisher and Dilks 2013) that respond more strongly to one category (e.g., faces) than others (e.g., scenes). These include regions selective for faces (Puce et al. 1996; Kanwisher et al. 1997), objects (Malach et al. 1995; Kourtzi and Kanwisher 2000), letter strings or words (Puce et al. 1996; Cohen and Dehaene 2004; Baker et al. 2007), body parts (Downing et al. 2001), scenes (Aguirre et al. 1998; Epstein and Kanwisher 1998), animals (Chao et al. 1999), and tools (Chao et al. 1999). In many cases, there are at least two regions selective for a given category, one on lateral OTC and one on ventral OTC (Hasson et al. 2003; Taylor and Downing 2011). Support for a fundamental role of these regions in behavior comes from neuropsychological studies of patients with focal lesions in OTC producing specific impairments in the recognition of particular categories (faces, Barton and Cherkasova 2003; bodies, Moro et al. 2008; objects, Behrmann et al. 1992; scenes, Aguirre and D’Esposito 1999; words, Mycroft et al. 2009). Thus, while defining an object is a complex philosophical question, the striking clustering and functional specialization of neurons in OTC by object categories highlight the centrality of objects to our everyday experience (Martin 2009).
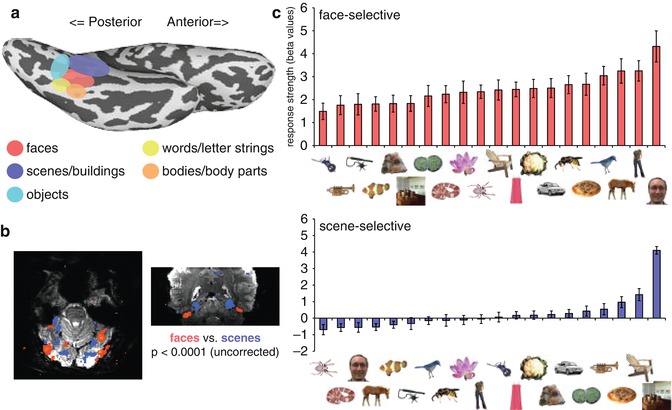
Fig. 9.5
Category selectivity in the visual cortex. (a) Ventral view of the inflated left hemisphere showing the relative locations of category-selective regions. (b) Axial (left) and coronal (right) slices from a single subject at 7 T showing the contrast between viewing faces and houses overlaid on the original functional data. Regions showing greater activation to scenes relative to faces are more medial than those showing the opposite preference. (c) Average response profile of face-selective and scene-selective regions on the ventral surface of the right hemisphere across 20 different categories (Adapted with permission from Downing et al. 2006 with thanks to A. Chan)
Strikingly, these different category-selective regions show a remarkable consistency in their topographical organization across individuals suggesting they may reflect some underlying principle of brain organization. For example, supported by the finding of category selective in the occipitotemporal cortex in the blind (Mahon et al. 2009), their locations may be indicative of cortical connectivity patterns between functionally related regions (Martin 2006; Mahon and Caramazza 2011). Similarly, their location may reflect retinotopic biases in high-level visual cortex. Specifically, the ventral surface of the temporal lobe shows an eccentricity bias with foveal stimuli biased to lateral regions and peripheral stimuli biased to more medial regions (Levy et al. 2001; Hasson et al. 2002). Since different categories and different tasks are associated with different goals requiring different types of visual information (Harel and Bentin 2009), such underlying principles of organization may constrain the location of category-selective regions. For example, given the necessity of foveating faces and words compared with scenes, the observed eccentricity biases may account for the lateral and medial locations of face-selective and scene-selective regions, respectively (Hasson et al. 2002). Consistent with this eccentricity bias, in which larger objects would stimulate more peripheral vision, a large-scale organization of visual representations according to real-world object size across the lateral and ventral surfaces has been reported (Konkle and Oliva 2012). Importantly, these principles are not mutually exclusive, and there may be multiple organizational principles underlying the observed pattern of responses (Op de Beeck et al. 2008).
While category appears to be a dominant organizing feature of high-level visual processing, it does not appear to be as dominant in the other modalities. In addition, many studies have emphasized distributed rather than localized representations of auditory categories (Formisano et al. 2008; Staeren et al. 2009).
There is some evidence for stronger responses to vocalizations, especially those of conspecifics, than other complex natural sounds in the auditory ventral pathway (Belin and Zatorre 2000; Lewis et al. 2005; Doehrmann et al. 2008; Talkington et al. 2012) with subregions selective for musical instrument sounds, human speech, and acoustic phonetic content (Leaver and Rauschecker 2010). However, the extent to which such distinctions simply reflect the spectrotemporal properties of the stimuli is unclear (Samson et al. 2011).
Most of the studies on higher-order representations discussed so far have focused on regional differences in the magnitude of response. While such an approach can readily provide evidence for gross distinctions in the cortex (e.g., face selectivity), it does not necessarily provide insight into the functional role of regions or the specific information being processed and may miss distinctions at a finer spatial scale.
The nature of representations within regions can be investigated by focusing on aspects of the fMRI response other than simple magnitude (see Boxes 9.2 and 9.3). For example, the scene-selective parahippocampal place area (PPA) on the ventral OTC responds more strongly to scenes than to other categories such as objects and faces (Fig. 9.5). Studies focusing on the specific pattern of response across this region using either hypothesis-driven or data-driven approaches have demonstrated that PPA contains information about both spatial layout (Fig. 9.6, Kravitz et al. 2011a; Park et al. 2011) and object identity (Harel et al. 2013), consistent with the inputs it receives from both the ventral and dorsal pathways (Kravitz et al. 2011b) and suggesting a key role in navigation.
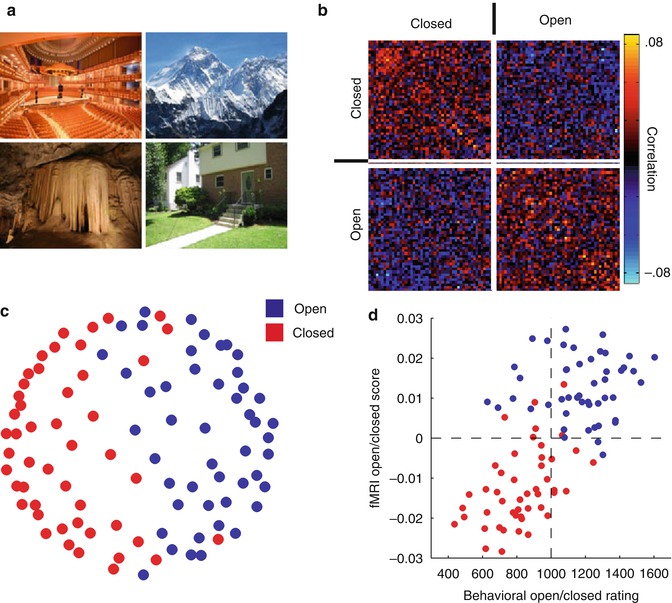
Fig. 9.6
Determining the structure of perceptual representations. To investigate the nature of representations in the scene-selective region on the ventral surface, participants were presented with 96 individual scenes, varying widely in semantic category (e.g., church, beach) and properties (e.g., open, closed, natural man-made). The multi-voxel response patterns within this region were used to determine which properties of the scenes are encoded (see Box 9.2). (a) Four sample scene images. (b) Similarity matrix showing the correlation in the multi-voxel pattern of response for all 96 scenes. Each individual point in the matrix shows the correlation in the pattern of response for two scenes. Correlations between any two open scenes and between any two closed scenes were on average higher than between open and closed scenes, suggesting that the distinction between open and closed scenes is critical in this region. (c) Multidimensional scaling of the correlation data. Each point corresponds to a single scene, and the distance between points reflects the similarity between their patterns of response. The grouping of the points clearly reflects whether they were open or closed. (d) There was a significant correlation between behavioral ratings of openness for individual scenes and the fMRI measures (With thanks to D. Kravitz)
In olfaction, while there is no evidence for distinct patches coding odor categories, the pattern of response in the posterior piriform cortex does reflect odor category, correlating with perceptual judgments of odor quality and similarity (Howard et al. 2009). The more similar odorants were perceived, the more similar the patterns of response elicited (Fig. 9.7).
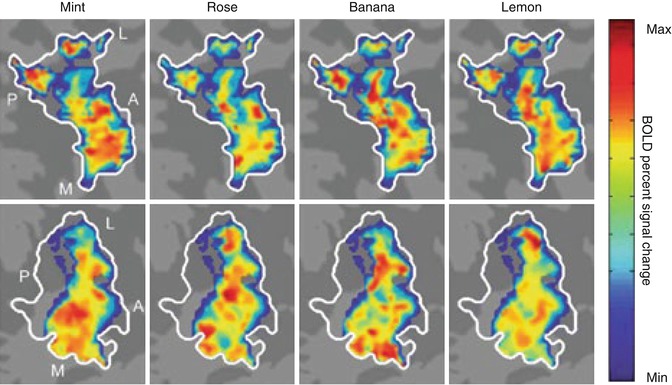
Fig. 9.7
Distributed patterns of response to different odorants in the piriform cortex. Distributed response patterns of activation in the left posterior piriform cortex (outlined in white) projected onto flattened cortical maps of two representative participants (top and bottom rows) in response to four odorants (mint, rose, banana, lemon). Note the distinct, yet spatially overlapping activation patterns evoked by the different odorants as well as the lack of consistency in patterns of response across the two subjects. These distinctive patterns can be detected using multi-voxel pattern analysis (see Box 9.2). Color scale represents the range of BOLD percent signal change from minimum (blue) to maximum (red). A anterior, L lateral, M medial, P posterior (Adapted with permission from Howard et al. 2009)
Insights into cortical organization can also be revealed by searching the entire brain for the information contained within patterns of response, rather than just simply differences in response magnitude (Kriegeskorte et al. 2006). For example, studies searching for regions distinguishing between the faces of different individuals have highlighted the importance of anterior temporal lobe regions (Kriegeskorte et al. 2007; Nestor et al. 2011), even though face selectivity tends to be weak in this region. Similarly, a study searching for areas containing head-view-invariant representation of gaze direction identified regions in both the anterior and posterior superior temporal sulcus, although the posterior region was more dependent on the physical properties of the stimuli (Carlin et al. 2011, see Fig. 9.8).
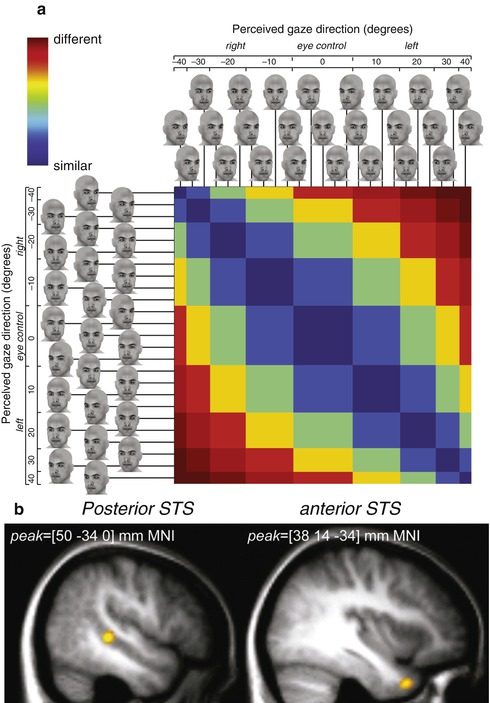
Fig. 9.8
View-invariant gaze direction coding in the anterior superior temporal sulcus (STS). To identify regions encoding gaze direction independent of head direction, a whole-brain search was conducted based on predicted similarities in the pattern of response across a range of head stimuli. (a) Predicted similarity matrix. For 25 computer-generated face images varying in head and gaze direction, the predicted similarity of response was estimated for a region encoding gaze direction. Color scale represents the predicted similarity from minimum (“different,” red) to maximum (“similar,” blue). (b) A whole-brain search identified two distinct regions that show the predicted view-invariant gaze direction response patterns: posterior STS and anterior STS (Adapted with permission from Carlin et al. 2011)
Overall, there is a pronounced organization in high visual cortex (i.e., categories) that is not clearly evident in the other modalities. However, there are clearly high-order representations in other modalities, and any such organizational principles may occur at a spatial scale below the resolution of current fMRI.
Box 9.2. Probing Perceptual Representations
The responses observed with fMRI provide several different means of evaluating the neural representations of sensory stimuli. First, traditional fMRI studies focus on the magnitude of the BOLD response. Differences in response magnitude across different stimuli, different categories of stimuli, or along particular stimulus dimensions are taken to reflect differences in the neural representation and thus coding of those stimulus differences. However, given the large population of neurons contributing to the response in each individual voxel, the sensitivity of this measure may be limited, particularly when a voxel contains heterogeneous populations of neurons.
Second, fMRI adaptation has been developed as a method to evaluate sub-voxel neural populations (Grill-Spector and Malach 2001). Based on the observation that the BOLD response reduces upon repetition of a given stimulus (Grill-Spector et al. 2006), consistent with the reduction in firing rate observed in electrophysiological studies (e.g., Li et al. 1993; Sobotka and Ringo 1994), the extent of adaptation can be used as a measure of neural similarity (see also Sect. 9.5.2). Adaptation is often measured during the presentation of blocks (e.g., Grill-Spector et al. 1999; Belin and Zatorre 2003) or pairs of stimuli (e.g., Kourtzi and Kanwisher 2001; Gottfried et al. 2006; Doehrmann et al. 2008) that are either the same or vary along a particular dimension with the extent of reduction for different stimuli relative to the presentation of the same stimulus indicating the degree to which the neural representations are similar.
Finally, analyses can focus on the distributed pattern of response across voxels (multi-voxel pattern analysis or MVPA) (Norman et al. 2006). In this approach, the similarity in the pattern of response is used as a measure of neural similarity and can be evaluated using a variety of measures (Cox and Savoy 2003; Pereira et al. 2009) including correlation (e.g., Haxby et al. 2001; Howard et al. 2009), linear discriminant analysis (Carlson et al. 2003), or support vector machines (SVM) (Kamitani and Tong 2005; De Martino et al. 2008; Beauchamp et al. 2009), which are all forms of linear classifiers. In MVPA, the similarity of neural representations is commonly expressed in terms of the ability to predict novel stimuli based on activity patterns and is often referred to as decoding (Haynes and Rees 2006, see also Box 9.3). Importantly, measures of neural similarity across large sets of stimuli can be directly contrasted with other measures of similarity (e.g., behavioral, physical properties) allowing quantitative comparisons across modalities, methodologies, and even species (Kriegeskorte et al. 2008a, b). While it has been suggested that MVPA assesses sub-voxel information by relying on subtle biases in individual voxels (Kamitani and Tong 2005), it seems more likely that MVPA relies on larger-scale information (Op de Beeck 2010; Freeman et al. 2011).
These three different approaches (magnitude, adaptation, and MVPA) are often applied separately, but they provide complementary information and can be measured simultaneously (Aguirre 2007).
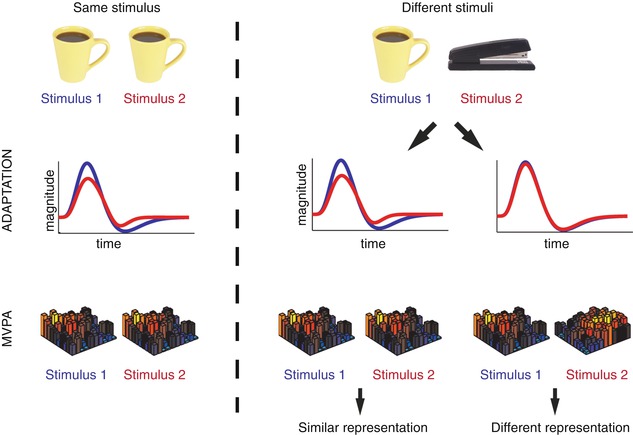
Using adaptation and MVPA to probe perceptual representations. Both adaptation and MVPA have been used as tools to assess the degree of similarity between the neural representations of pairs of stimuli. A repeated presentation of the same stimulus (left column) can produce: (i) a decrease in the BOLD response, known as adaptation (middle row) and (ii) a high correlation between the patterns of response elicited (bottom row). These relations are used as a benchmark to assess the representation of two different stimuli (middle and right columns). If the two stimuli have similar representations (middle column), adaptation or similar patterns of response would be observed. In contrast, if the two stimuli have different representations (right column), no adaptation or distinct patterns of response would be observed
Box 9.3. Decoding, Encoding, and Reconstructing Perception
The use of linear classifiers to probe perceptual representations (see Box 9.2) can be thought of as building a decoding model: using voxel patterns to predict perceptual stimuli. If voxel patterns differ between particular types of stimuli, then the pattern of response for a novel stimulus can be used to predict or decode its identity.
An alternative approach is to build an encoding or forward model: predict activity that will be evoked in voxels by different perceptual stimuli (Naselaris et al. 2011). For example, by presenting a wide range of natural images, Kay and colleagues built a quantitative model for each individual voxel in early visual areas (V1, V2, and V3) that characterized the stimulus information eliciting a response in terms of spatial position, orientation, and spatial frequency (Kay et al. 2008). Using these voxel models, predicted activity for a candidate set of novel images was compared with actual activity elicited by one of those images to identify which specific image was presented. Similarly, Schönwiesner and Zatorre presented auditory stimuli varying in spectral and temporal modulation rates and adapted a quantitative model developed from electrophysiology of auditory cortex to characterize the stimulus information eliciting a response in individual voxels in the primary and secondary auditory cortex (Schonwiesner and Zatorre 2009). One advantage of encoding models over decoding models is that they allow prediction of voxel activity patterns from stimuli outside the set used to build the model, even stimuli from a completely different stimulus space (Naselaris et al. 2011).
Such decoding and encoding models can be used to try and reconstruct presented stimuli from voxel activity patterns, to produce a literal representation of the specific stimulus presented. For example, using simple black-and-white geometric patterns to develop encoding and decoding models, it has been possible to reconstruct novel patterns (Thirion et al. 2006) or letters (Miyawaki et al. 2008). Similarly, an encoding of color space was used to reconstruct novel colors using voxels in multiple visual areas (Brouwer and Heeger 2009). Finally, the encoding model of Kay and colleagues has been extended, incorporating semantic features, to enable reconstruction of natural images (Naselaris et al. 2009) and a similar approach with dynamic stimuli allows reconstruction of movie clips (Nishimoto et al. 2011).
9.4 Top-Down Processing in Perception
Most of this chapter so far has treated perception as primarily a bottom-up stimulus-driven process, whereby neural representations of increasing complexity are hierarchically assembled, resulting in a coherent percept. One extreme version of this hierarchical view is that the underlying perceptual representations are independent from or “impenetrable” to top-down factors such as attention, knowledge, memory, or expectations (Pylyshyn 1999). However, most connections between regions are bidirectional, and even the primary sensory cortices receive large amounts of input from higher-level areas. These feedback projections allow the operation of recurrent modulatory mechanisms on sensory representations (Lamme and Roelfsema 2000) throughout the sensory processing hierarchies. This interaction between top-down and bottom-up factors makes the distinction between “perception” and “cognition” less obvious than it may at first seem. For example, retinotopic activity in V1 – which is almost by definition bound to the stimulus physical properties – has been shown to vary based on the perceived size of the stimulus presented for physically identical stimuli (Murray et al. 2006; Sperandio et al. 2012). In the following section, we will focus on two different forms of top-down influences on perceptual representations: attention and imagery.
9.4.1 Attention
Top-down attention involves enhancement (or prioritization) of particular aspects of incoming sensory information based on the specific goals of the observer. Attention can be directed to spatial locations (space-based attention) or features of the sensory input (e.g., object-based attention in vision). At a neural level, attention manifests in several different forms including lowering of firing thresholds, scaling of response magnitude, and enhanc synchronization (Reynolds and Chelazzi 2004; Lee and Maunsell 2009; Reynolds and Heeger 2009).
Effects of top-down attention have been reported with fMRI even as early as the subcortical structures. For example, the visual response in LGN is modulated by spatial attention with enhanced responses to attended visual stimuli and suppressed responses to ignored stimuli (O’Connor et al. 2002). Attention has also been shown to modulate visual responses in the pulvinar (Kastner et al. 2004) and superior colliculus (Schneider and Kastner 2005; Katyal et al. 2010). These effects of top-down input highlight that the subcortical structures are more than just passive relay structures, as has often been assumed (for review and further examples, see Saalmann and Kastner 2011).
Similar effects of attention have been reported in the early visual cortex including V1. Thus, directing attention to a particular spatial location results in superior task performance for stimuli appearing in that location, concomitant with an enhancement of the BOLD response in the corresponding retinotopic regions of the cortex (Tootell et al. 1998; Brefczynski and DeYoe 1999). Further, the attentional effects on the BOLD response are constrained by the receptive size of the regions along ventral visual pathway (Kastner et al. 1999; Muller et al. 2003).
How attention is allocated can be influenced by features of the visual stimuli and not just by space. For example, following a spatial cue on an object, retinotopic activity in early visual areas is enhanced for other locations on that same object, but not equally distant locations outside the object (Muller and Kleinschmidt 2003), a phenomenon known as object-based attention (see also Martinez et al. 2006; Ciaramitaro et al. 2011). Effects of attention to objects and features have also been demonstrated in higher-order category-selective regions. For example, attending to a particular object category (faces or houses) enhances activity in the respective face- or scene-selective regions (O’Craven et al. 1999). The top-down modulatory effect on category-selective regions has been suggested to originate in the prefrontal cortex and can be seen even before stimulus presentation in the form of increased activity with the expectation of incoming stimuli (for review, see Gazzaley and Nobre 2012). Such object-based attentional effects are thought to reflect increased neural firing rate for the attended stimulus, as well as increased selectivity for features of the attended stimulus (Murray and Wojciulik 2004).
Top-down modulations of the sensory cortex by attention, expectations, and task have also been observed with fMRI in modalities other than vision. For example, activity in the olfactory cortex (Fig. 9.9) was found to increase when participants sniffed non-odorant air but were expecting an odor (“attended sniff” condition) relative to when they sniffed the same non-odorant air but were not expecting an odor (“unattended sniff“ condition) (Zelano et al. 2005). Further, activity in part of the piriform cortex in the “attended sniff” condition was enhanced in response to auditory task instructions, before the stimulus was even presented, indicating a strong effect of expectation. Higher-order olfactory regions, such as the orbitofrontal cortex, are also modulated by odor content expectations (de Araujo et al. 2005), and attention to odors appears to modulate functional connectivity between the piriform and orbitofrontal cortex through the mediodorsal nucleus of the thalamus (Plailly et al. 2008).
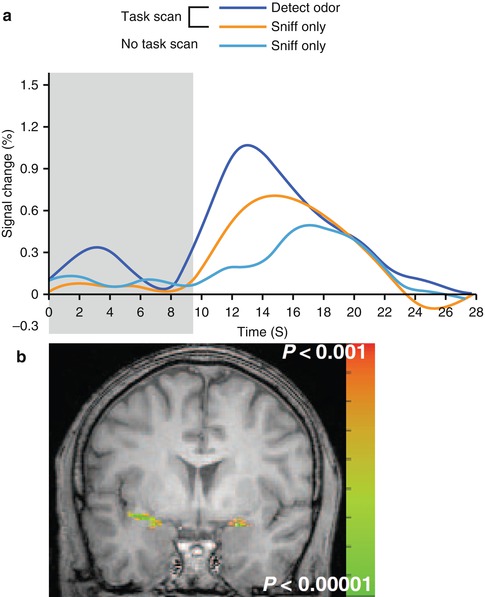
Fig. 9.9
Top–down attentional effects in olfaction. (a) Average response in the anatomically defined piriform cortex as a function of three conditions varying in their attentional demands. In the task scan, participants were required either to detect the presence of an odor (“detect odor” condition) or to simply inhale (“sniff only”). In a separate scan (no task scan), participants were only required to inhale. Critically, only non-odorant air was presented in all conditions, and so differences in response can only be attributed to the top-down attentional factors. Note the stronger responses during detection than during simply sniffing. Further, an anticipatory effect is also apparent in the period before the stimulus was delivered (gray area) in the “detect odor” relative to the other two conditions. (b) Group analysis from the same study showing functional activation in the piriform cortex during the odorant condition (Images adapted with permission from Zelano et al. 2005)
Similar to the effects observed for olfaction, trying to detect taste in a tasteless solution results in enhanced activation in the middorsal insula and frontal operculum, corresponding to the primary gustatory cortex (Veldhuizen et al. 2007). Further, manipulation of expectation also modulates fMRI responses in the gustatory cortex (Nitschke et al. 2006; Small et al. 2008; Veldhuizen et al. 2011a). Importantly, these attentional effects in olfaction and gustation are modality specific (Veldhuizen and Small 2011).
In sum, top-down attentional effects can be seen across modalities and are one mechanism underlying the active, constructive process of perception, which utilizes our prior knowledge and experience of environmental regularities to form hypotheses and expectations about the external world.
9.4.2 Imagery
Even in the absence of external sensory stimulation, it is still possible to generate internal representations using top-down signals, a process that is often referred to as mental imagery (Kosslyn et al. 2006). Such mental imagery can provide important insights into the nature of the top-down signals and their potential effect on perceptual processing along the sensory hierarchies. A general finding across modalities is that mental imagery elicits activity in similar cortical regions to those involved in perception (e.g., olfaction, Levy et al. 1999; somatosensory, Yoo et al. 2003; vision, Ganis et al. 2004; gustation, Kobayashi et al. 2004; audition, Bunzeck et al. 2005), and it is often suggested that perception and imagery share the same neural substrate. However, simply showing activation in the same regions is not sufficient to show that imagery and perception share similar mechanisms. Such activation could simply reflect a nonspecific engagement of a region. For example, in the case of olfaction, odor imagery is associated with sniffing, which is known to elicit activation on its own (Sobel et al. 1998). To demonstrate that activation of the olfactory cortex during imagery is odor specific rather than a general modulation, activations elicited by pleasant and unpleasant odors during both perception and imagery were compared, revealing similar hedonic specificity in both cases (Bensafi et al. 2007). In vision, studies have revealed category specificity in high-level visual areas during imagery (O’Craven and Kanwisher 2000; Reddy et al. 2010) and even decoding of individual objects (Lee et al. 2012). Furthermore, the specific representations elicited are similar during perception and imagery suggesting extensive overlap in the neural substrate of each (Stokes et al. 2009; Lee et al. 2012). Thus, imagery not only does engage the same regions as perception but can evoke highly specific representations (Fig. 9.10).
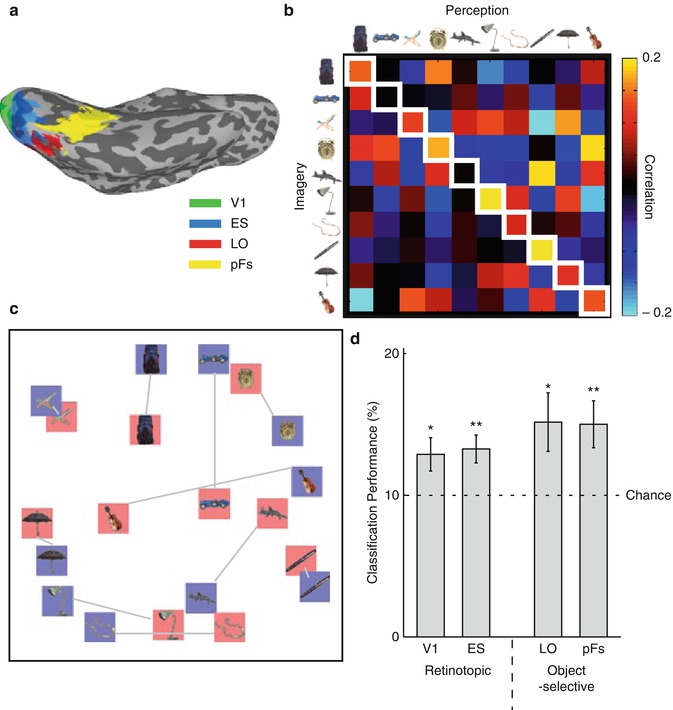
Fig. 9.10
Visual imagery and perception of real-world objects. Participants were familiarized with photographs of ten objects and during the fMRI scan were either presented with those same images or asked to imagine them. The results demonstrate the similarity between representations elicited during perception and imagery. (a) fMRI responses were analyzed in V1, extrastriate retinotopic cortex (ES), and two object-selective regions (LO in lateral OTC and pFS on ventral OTC). (b) Example data from one participant showing the correlation in the pattern of response across pFS between imagery and perception. In most cases, the strongest correlation is for the same object in the two conditions (cells along the main diagonal, highlighted in white squares). (c) Multidimensional scaling of the average data across participants. The perception (blue) and imagery (red) conditions for the same object are close to each other. (d) Classification of object identity between imagery and perception using a linear classifier (support vector machine – see Box 9.2) (With thanks to SH Lee)
One area of contention is whether imagery-elicited activation extends all the way back to the primary sensory cortices. This debate has been entwined with the discussion of whether imagery is symbolic or depictive (Pylyshyn 2002; Kosslyn et al. 2006). In addition, it has been reported that only the secondary auditory cortices and not the primary auditory cortex is involved in auditory imagery (Bunzeck et al. 2005). However, in vision, retinotopically specific activity has been reported in the primary visual cortex (Slotnick et al. 2005; Thirion et al. 2006) and the activity in early visual cortex correlates with the vividness of imagery (Lee et al. 2012). In olfaction, the extent to which the primary olfactory cortex is active correlates with experience, with professional perfumers showing stronger activation than novices (Plailly et al. 2012).
So far we have highlighted the similarities between perception and imagery, but introspectively, they are very different phenomena. The strength of activation is clearly different between perception and imagery, but other differences have also been reported. For example, one study reported greater deactivation in the auditory cortex during visual imagery compared with visual perception, suggesting enhanced unimodal processing during imagery (Amedi et al. 2005). In another visual imagery study, the similarity of representations across different regions along the ventral visual pathway was greater during imagery than perception, suggesting different neural dynamics (Lee et al. 2012).
In sum, the study of mental imagery shows that top-down processes are able to elicit highly specific responses in sensory areas. The relationship between imagery and perception is complex, with overlap in the neural substrates involved but differences in the interregional relationships.
9.5 Experience-Dependent Perceptual Representations
Sensory information processing in mammalian brains is highly malleable both during development and adulthood, and over both short and long time scales (Buonomano and Merzenich 1998). In this section, we will focus on several ways in which prior experience impacts the nature of perceptual representations.
9.5.1 Development
While the large-scale circuitry of the brain is present at birth, it is clear that there is the potential for extensive plasticity early in life and the nature of perceptual representations is dependent on experience throughout development. Even in primary sensory cortices, many of the properties of neurons and maps depend on experience early in life. For example, in V1, neural properties such as orientation selectivity and ocular dominance are dependent on early postnatal experience (Espinosa and Stryker 2012). Such changes are difficult to observe with fMRI due to the substantial practical challenges posed by scanning young children (but see, e.g., Arichi et al. 2010; Perani et al. 2010; Raschle et al. 2012). fMRI studies of visual development in infant monkeys have suggested that while there is strong activation in V1 early in life, there is only weak activation in extrastriate areas such as MT and V4 (Kourtzi et al. 2006). Studies in older children suggest a prolonged time course for developmental changes that may extend into adulthood. For example, in audition, a cross-sectional study of music perception in 5–33-year-olds revealed selective activation for melody and rhythm processing that increases over time even in the absence of any musical training (Ellis et al. 2012). In vision, much work has focused on high-level category-selective regions and in particular the face-selective FFA (fusiform face area). At a behavioral level, many of the markers of specialized face processing are present by 3–4 years of age (Sangrigoli and de Schonen 2004; Cassia et al. 2009), although performance improves through adolescence (e.g., Mondloch et al. 2003; for review, see McKone et al. 2012). Many fMRI studies report increases in size, response magnitude, or selectivity of FFA (e.g., Golarai et al. 2007; Scherf et al. 2007, 2011) with a smaller FFA in 12–16-year-olds than in adults (Golarai et al. 2010). However, it has been questioned whether methodological issues might account for such effects, rather than changes in neural processing (McKone et al. 2012). In particular, a major concern is the reduced signal strength observed when putting a child’s head inside an adult-sized head coil – it may be critical to match the size of head coil to the size of the child’s head (Keil et al. 2011).
9.5.2 Repetition Suppression or Adaptation
One of the simplest forms of experience is prior exposure to a given perceptual stimulus. Such stimulus repetition leads both to decreased BOLD responses (variously termed repetition suppression or adaptation) throughout brain regions active in a given task, not just sensory areas, and also improvement in behavioral performance (termed repetition priming) (Grill-Spector et al. 2006). Such repetition suppression has been reported in multiple modalities and has been used as a way of probing neural representations with fMRI (see Box 9.2). The reduction in the BOLD response is immediate (Kourtzi and Kanwisher 2001), increases with multiple presentations (Sayres and Grill-Spector 2006), survives intervening stimuli (Vuilleumier et al. 2002; Weiner et al. 2010), and occurs even with delays of 3 days (van Turennout et al. 2000). However, the relationship between the decreased BOLD response, behavioral improvement, and the underlying neural mechanisms is unclear (Wiggs and Martin 1998; Henson 2003; Grill-Spector et al. 2006). How is it that reduced activity can be associated with enhanced performance? Proposals have included a more rapid neural response (James and Gauthier 2006), a sharper or more-selective response (Desimone 1996), or some suppression of bottom-up sensory responses by top-down predictions (Friston 2005). One intriguing suggestion is that the reduced neural activity is associated with enhanced neuronal synchronization producing more effective long-range communication between brain regions (Gotts et al. 2012).
9.5.3 Learning and Perceptual Expertise
Beyond repetition suppression, perceptual representations can change as a result of active training or learning. One way to investigate the effect of learning is to use a cross-sectional approach and compare subjects with varying amounts of perceptual expertise. Such studies have focused on differences in both functional and anatomical properties. For example, studies of musicians compared with nonmusicians have reported increased gray matter volume in the auditory cortex that correlates with musical aptitude (Schneider et al. 2002; Gaser and Schlaug 2003). Further, musical training correlates with stronger activation in the superior temporal gyrus (Koelsch et al. 2005) and in the planum temporale, just posterior to the primary auditory areas (Ohnishi et al. 2001). In gustation/olfaction, wine sommeliers show enhanced activation in the insula and orbitofrontal cortex (Castriota-Scanderbeg et al. 2005), and in somatosensation, Mah-Jong experts, who have learned tactile discrimination of the 2D shapes on Mah-Jong tiles, show enhanced activation of V1 (Saito et al. 2006) suggesting changes in cross-modal associations.
In the visual domain, cross-sectional studies have focused on expertise in the recognition of object categories, such as cars and birds. Faces can be thought of as a perceptual category we are all experts in processing (Diamond and Carey 1986), and it has been proposed that processing objects of expertise should engage the same neural structures that are engaged by faces (Tarr and Gauthier 2000).
While some studies have reported enhanced activation in FFA when car or bird experts view objects from their domain of expertise relative to control objects (Gauthier et al. 2000; Xu 2005), other studies failed to replicate these findings (Grill-Spector et al. 2004; Rhodes et al. 2004). Further, the enhanced activity for car experts viewing cars is both widespread, extending well beyond the FFA and even into parietal and prefrontal regions, and diminished when the experts are not engaged with their objects of expertise, suggesting that it may reflect enhanced attention (Harel et al. 2010). This same group of car experts also showed increased gray matter volume in the prefrontal cortex and not in the visual cortex (Gilaie-Dotan et al. 2012) suggesting that the neural changes involved in expert recognition are not necessarily perceptual and may involve top-down factors, such as knowledge and attention.
Since studies of real-world expertise are correlational in nature, it is impossible to avoid the “chicken and egg problem”: perhaps the specialized neural correlates exhibited by experts do not reflect the acquisition of expertise, but are in fact a precondition for the successful acquisition of expertise. Thus, an alternative approach is to provide laboratory training and measure the changes in perceptual representations directly. The advantage of such longitudinal studies is that they provide causal evidence for the relationship between training and neural changes. Across modalities, these studies have revealed changes in cortical responses following training, in the form of both increases and decreases. For example, in audition, frequency discrimination training over a week leads to reduced BOLD responses in the auditory cortex (Jancke et al. 2001). In contrast, odorant learning produces increased responses in the piriform and orbitofrontal cortex (Li et al. 2006). In vision, training on a simple visual texture discrimination task produces enhanced activity in the early visual cortex after only a single session of practice (Schwartz et al. 2002). However, both increases and decreases in visual responses across distributed regions have been reported for trained versus untrained shapes (Kourtzi et al. 2005), novel objects (“smoothies,” “spikies,” “cubies” Op de Beeck et al. 2006), and bird types (van der Linden et al. 2008). In the context of comparing object expertise to face expertise, some studies have reported changes in FFA following training on novel objects (“Greebles” Gauthier et al. 1999), while others have not (Op de Beeck et al. 2006; Wong et al. 2009), even with the same training paradigm (Brants et al. 2011). Although the presence of both increases and decreases in response following perceptual learning both within and across studies may seem contradictory, there are two major factors that need to be considered. First, the nature of the stimuli may determine which preexisting representations training modifies, by either strengthening or weakening. For example, whether responses in FFA change during training may depend on how face-like the stimuli are (Brants et al. 2011). Second, the nature of the task and the informativeness of any given neural population for that task will determine their likely modulation in learning (Op de Beeck and Baker 2010). Neural populations that are engaged by and used in performing a task will be more likely to show increased responsiveness.
9.5.4 Loss of Sensory Input
Changes in functional response properties have also been reported following loss of sensory input. Complete loss of input in a given modality seems to produce some form of cross-modal plasticity (Merabet and Pascual-Leone 2010). For example, in the blind, a number of studies have demonstrated enhanced responsiveness to auditory (Gougoux et al. 2005; Poirier et al. 2006) and tactile (Burton et al. 2002) stimuli in visual areas (V1, MT), and others have reported activity even during verbal memory tasks (Amedi et al. 2003). Similarly, visual and somatosensory activation of the auditory cortex have been reported in the early deaf (Finney et al. 2001; Karns et al. 2012). However, these cross-modal effects are stronger with loss of input early in life and may reflect developmental plasticity mechanisms (Merabet and Pascual-Leone 2010). Further, such plasticity may be driven by enhancement of preexisting cross-modal responsiveness, which is normally masked by the dominant modality. Support for this “unmasking” comes from studies showing tactile responses in V1 of sighted subjects following blindfolding (Merabet et al. 2007, 2008). However, cross-modal responses in the early blind cannot be predicted from cross-modal responses in sighted subjects (Lewis et al. 2010), and it may be that unmasking of preexisting connections is accompanied by more permanent structural changes with long-term loss of sensory input (Merabet and Pascual-Leone 2010).
Related posts:

Stay updated, free articles. Join our Telegram channel

Full access? Get Clinical Tree


