(1)
Radiology Department Beijing You’an Hospital, Capital Medical University, Beijing, People’s Republic of China
Abstract
Functional magnetic resonance (MR) imaging is a valuable technique for the analysis and assessment of metabolism and water diffusion from the perspectives of histology, cytology and even molecular biology based on conventional MR technology. It has exhibited a promising application in the diagnosis and differential diagnosis of HIV/AIDS.
26.1 MR Functional Imaging in Neurological Diseases
Functional magnetic resonance (MR) imaging is a valuable technique for the analysis and assessment of metabolism and water diffusion from the perspectives of histology, cytology and even molecular biology based on conventional MR technology. It has exhibited a promising application in the diagnosis and differential diagnosis of HIV/AIDS.
Functional magnetic resonance imaging (fMRI) is applied for the research and assessment of human or animals functions by using MRI. Generally, it includes diffusion weighted imaging (DWI), diffusion tensor imaging (DTI), perfusion weighted imaging (PWI), blood oxygenation level dependent (BOLD) fMRI, and magnetic resonance spectroscopy (MRS).
26.1.1 Diffusion Weighted Imaging (DWI)
DWI is a valuable tool for diffusion assessment and imaging by using the characteristic diffusive movements of water molecules. Being different from conventional T1WI and T2WI, DWI enables more microcosmic studies by MRI, which provides information about spatial structure of the human tissues and the functional water molecules exchange between tissue components at different physiological and pathological conditions.
Diffusion is one of the important physical processes in physiological functional activities of the human body, which is also a random motion of molecules, namely the self-diffusion of water molecules (known as Brownian motion). Molecular diffusion of pure water is the same in all directions, namely isotropy. In biological tissues, however, the water diffusion is restricted by various local factors, with manifestation of different diffusion in different directions, namely anisotropy. Anisotropic discrepancy is related to the physical properties of the medium and the obstacles restricting molecular motion. Therefore, anisotropic information about the water molecules diffusion per unit volume can be obtained to demonstrate the subtle anatomical structure and functional changes of organisms.
The principle of DWI is the addition of two equally intense but directionally opposite gradient pulses before and after the 180° pulse of spin-echo T2-weighted sequence. For static water molecules (with low diffusion), the dephasing of the proton spin induced by the first gradient pulse is re-focused by the second gradient pulse, with no attenuation of the signaling. For water molecules in motion, the dephasing of the proton spin induced by the first gradient pulse leaves its original position, which fails to be re-focused by the second gradient pulse, with attenuation of the signaling. The degree of signaling attenuation is dependent on the water molecules diffusing capacity and diffusing sensitivity coefficient at specific temperature and pressure, while the diffusing sensitivity coefficient is determined by the duration and strength of diffusing gradient field. Their relationship can be expressed by the following formula: SI = exp − bD, in which D is the diffusing coefficient, a larger D value representing the faster diffusion; and b is the diffusing sensitivity coefficient. The b value can be calculated by b = γ2G2δ2 (Δ − δ/3), in which γ represents magnetogyric ratio, G strength of the diffusion pulse, δ duration of the diffusion pulse, and Δ the time interval between two pulses. The b value is positively related to the degree of diffusion weight. Concerning DWI, there are many factors influencing the molecular diffusion (such as blood flow/CSF flow and cytomembrane). Therefore, D value is replaced by the diffusion coefficient (ADC) which integrates these factors. ADC chart can be figured out according to different b values, with the following formula: ADC = (lnS1/lnS2)/(b1 − b2). In the formula, S1 and S2 represent two different signal strength of DWI. The signal strength in ADC chart has a positive correlation with the capacity of molecular diffusion. Rapid signal attenuation and high value of ADC indicate rapid molecular diffusion in the tissues, which is demonstrated as low DWI signal but high signal in ADC chart; and vise versa. DWI signal is affected by both T2 value and the diffusion, while ACD chart avoids the effect of T2. Therefore, ADC chart more authentically demonstrates the changes of the diffusion, but is affected by the diffusion sensitive gradient direction.
26.1.2 Diffusion Tensor Imaging (DTI)
DTI is the most recently developed technology of magnetic resonance imaging based on the DWI. It is the only effective and noninvasive examination to observe and track cerebral white matter fiber tracts.
The principle of DTI is that the dispersion of water molecules is isotropic in infinitely homogeneous liquid in vitro. At the physiological conditions of the human body, the three-dimensional diffusion of the water molecules is affected by multiple local factors, including cytomembrane and high molecular substances. Especially in the myelinated nerve fibers, the diffusion rate of the water molecules along the axons is much faster than that in the vertical direction. Such direction highly dependent diffusion is known as anisotropic diffusion. In the brain tissues, the diffusion of the CSF is isotropic and the diffusion of cerebral gray matter is generally anisotropic. However, due to the components of axons with similar directions in the cerebral white matter fiber tracts, the diffusion is therefore highly anisotropic.
Fractional anisotropy (FA) is the most commonly used quantitative anisotropic index, whose magnitude is related to the integrity of myelin sheath, compactness and parallelism of fibers, which varies from 0 (direction independent diffusion) to 1 (unidirectional diffusion). The FA value of the brain white matter association fibers (corpus callosum) is the highest. That is to say, it has the highest degree of anisotropy, which is followed by the brain white matter projecting fibers (internal capsule) and the association fibers (semioval center). When the axons and myelin of white matter fiber bundles are involved by various lesions, the FA value of the involved region decreases in different degrees. The FA value can be represented by vectogram and color coding FA image, and its brightness is positively related to the magnitude of FA value.
Diffusion tensor tractography (DTT) is also known as fiber tractography, which is a noninvasive imaging examination based on the diffusion tensor data for three-dimensional demonstration of cerebral white matter fiber bundles in the living bodies. Due to its capacity in demonstrating the coursing direction and the three-dimensional morphology of the fibers and functional tracts, it facilitates in understanding the normal brain functions and the pathogenesis of the diseases influencing brain functions.
DTI is a most recently developed imaging examination based on the DWI, which is superior to the uni-dimensional imaging by routine DWI. It quantitatively analyzes the molecular motion by using tensor at the voxel level, with the advantage of three-dimensional quantitative analysis of the water molecules diffusion in the tissues to describe the diffusion directions and the average degree. In addition, it can provide imaging based on the anisotropy of water molecules diffusion in the tissues to demonstrate the minor functional and structural changes of the living tissues. Therefore, the integrity of the white matter as well as the lesions (which interrupt the continuity of the tissues) can be assessed.
26.1.2.1 The Basic Principle of DTI
Definition of DTI
Diffusion is random movement of the liquid molecules, which is known as Brownian motion. At an unconstrained condition, the motion is isotropic. However, in tissues of organisms such as the cerebral white matter, the three-dimensional diffusion of water molecules is affected by multiple extracellular and intracellular factors, such as neuron membrane and wall as well as high molecular materials. Therefore the motion range of water molecules is direction dependent, namely anisotropy. Tensor is a mathematical structure used to three-dimensionally describe the ellipsoidal features, usually with three spatial coordinates of X, Y and Z. The Z coordinate is the axis across the main magnetic field, whose direction is the main direction of diffusion.
Tensor is generally represented by diffusion coefficient D. But in human body, the D value fails to inclusively represent the diffusion features of the water molecules. Therefore, apparent diffusion coefficient (ADC) is used to indicate the degree of water molecules diffusion. In the cerebral white matter, the factors influencing ADC value include the density of fibers, the degree of myelinization, the average diameter of fibers and the voxel direction similarity. The basic quantitative measurement of the DTI is the three eigenvector values of μ1, μ2 and μ3 as well as eigenvalues of λ1, λ2 and λ3 of the MRI (magnetic resonance imaging) voxel. In each voxel, the main diffusion directions and the diffusion degree in each direction are obtained along the three main coordinate of ellipsoid. Due to the relative strength of the eigenvalue, the anisotropically diffusing voxels form ellipsoid.
DTI is a technology with quantitative anisotropy of water molecules to observe the microstructure of the tissues and to measure the degree and direction of water molecules diffusion. DTI can be applied for quantitative research and fiber tractography (FT). The following indices of measurement serve the quantitative research:
Trace Apparent Diffusion Coefficient (Trace ADC)
ADC value indicates the speed of water molecules diffusion but fails to indicate their anisotropy. The value is the mean of water molecules diffusion in all directions of the tissue. With the ADC value as the imaging signal intensity, the ADC map can be fitted out to directly demonstrate the speed of water molecules diffusion. The faster diffusion speed is demonstrated by the greater ADC value, the stronger ADC imaging signal and the brighter ADC imaging. For instance, the signal of cerebrospinal fluid is high while that of the cerebral white matter is low. The mean ADC value of three mutually perpendicular directions is known as the mean diffusivity (MD), which is direction independent and does not demonstrate the anisotropy of the tissue. Rather, it demonstrates the magnitude of water molecules diffusion in the tissue. The increased MD indicates unrestrained water molecules diffusion in all directions due to myelin defects or loss. The more free water in the tissue indicates the higher diffusion degree. The transverse diffusion coefficient (λ⊥) is the water molecules activity in the direction perpendicular to axon axis, which provides information specific to myelination changes. The longitudinal diffusion coefficient (λ∥) is water molecules activity in the direction along the axon axis, which is more correlated with the essential characteristics of axons, or indicates extra-axonal or extracellular changes.
Anisotropy
It includes fractional anisotropy (FA) and relative anisotropy (RA). FA is the ratio of fractional anisotropy of the diffusion tensor to the total diffusion tensor, which indicates a small fraction of anisotropic diffusion coefficient. RA is the ratio of diffusion anisotropy to diffusion isotropy. The value of FA represents intensity of water molecules motion in the main vector axis of diffusion. Both FA and RA are non-vectored (values, non-directional), which are zero for the totally isotropic tissue. With the increase of anisotropy, the RA value can be up to √2 and the FA can be up to 1. With the FA values as the imaging signalling intensity, the FA image can be fitted out, which directly demonstrates the proportion of anisotropy and indirectly demonstrates the speed of water diffusion in the tissue. In the direction of fiber tract coursing, the diffusion motion is minimally restricted, with the fastest speed, largest FA value, the most intense signalling in the FA image and the brightest image. However, in the direction vertical to the fiber tract coursing (the second and third vectors), the diffusion motions are maximally restricted, with the slowest motion. In FA image, the cerebral white matter is the most highly anisotropic in high signal; while the cerebrospinal fluid is the least anisotropic in low signal. The FA value is an index for assessing the anisotropy and integrity of the cerebral white matter, which decreases in the cases of changed environmental of the microstructure (such as tissue density), defective or lost myelin, and decreased fibers. In the normal brain tissue, the factor with largest impact on the diffusion anisotropy is the arrangement and density of white matter fibers. That is to say, the more regularly dense arrangement of the fibers (the thicker myelin sheath) has the higher degree of anisotropy, with the higher FA value and the brighter FA image. In the normal brain tissues, the FA values are different in different brain tissues. For instance, the FA value of association fibers is the highest, followed by projection fibers and subcortical association fibers.
Volume Ratio (VR)
VR is the ratio of the diffusing ellipsoid volume to the spherical volume with a diameter of 2e, varying from 1 to 0. The VR value of 1 indicates isotropic diffusion. The closer its value is to 0, the higher degree of anisotropy the tissue has. The exponential ADC (EADC) excludes the effect of tissue T2, which, compared to ADC, can more conveniently and more accurately localize and measure the restriction degree of diffusion. Anisotropy index (AI) is equal to 1 − VR, which increases along with the increase of anisotropy.
Three Eigenvalues of λ1, λ2 and λ3
The three eigenvalues is usually represented with the help of the three diameters of the ellipsoid. The three values demonstrate the diffusion degrees along the longest diameter of the ellipsoid (the longest axis), anteroposterior diameter (the middle axis) and the mediolateral dimension (minimal axis), respectively.
Fiber tractography (FT) refers to a new visualization fiber imaging technology by applying DTI data and specialized software (such as fiber tracking software), which is also known as diffusion tensor tractography (DTT). It can clearly demonstrate the coursing, direction and integrity of fiber bundles, especially the cerebral white matter fiber tracts. Clinically, the combination of FT image with the corresponding trace ADC and FA images is commonly applied to demonstrate and illustrate the fiber images.
Data Collecting
DTI demands high-quality MRI images, namely more complicated magnetic resonance scanner with stable and uniform magnetic field as well as faster and stronger magnetic field gradient to reduce motion artifact, eddy current and heterogeneity of magnetic field. In addition, a mathematical framework is also necessary to convert discrete and rough diffusion tensor data into smooth and macroscopic coursing of the cerebral white matter tracts. Before DTI imaging, the gradient field strength and slew rate should be set. Meanwhile, the imaging planes should be selected according to the region of interest (ROI), in addition to the index settings of section thickness and intervals.
Image Processing
There are mainly four methods to study the cerebral white matter changes by applying DTI technology.
1.
The region of interest (ROI) is selected to manually measure the values of anisotropy for comparison with those of the control group. The recent research data of ROI can be applied to demonstrate the cerebral white matter and its functions related structures.
2.
Based on the similarities of adjacent voxels in shape and size in the ellipsoid, 2D color tensor images and 3D tracts tensor images can be established for direct visual observation.
2D color tensor images
The DTI is sensitive to anisotropic water molecules diffusion, which can construct visualized anatomic structures images based on colored directional encoding of various white matter tracts. According to its definition, the three main vector components of each voxel eigenvector are assigned with three colors, namely red in X coordinate, green in Y coordinate and blue in Z coordinate. That is to say, the rightward and leftward coursing tracts are red, the anterior and posterior coursing tracts are green and the cephalic and caudal coursing tracts are blue. The thickness of the color represents the magnitude of FA value.
3D tracts tensor images
3D white matter fiber tracts tensor images can be reconstructed by using computer software. The specific methods mainly include two types: (1) Linear extension algorithm directly utilizes the tensor information within each pixel for extension step by step. (2) Total energy minimization algorithm can explore a passage between two predetermined pixels with minimal energy loss, including fast marching method and SA (simulate annealing). Fiber assignment using continuous tracking (FACT) technology is to trace local vector information of each pixel and bidirectional (forwards and backwards) linear extension from the seed pixel for reconstruction of the nerve fiber pathway. The extending direction is determined by the main direction of seed pixel eigenvector. The extension is terminated till the FA value of voxel being less than 0.2 or the angle between two connected pixels being above 45°. The algorithm can well demonstrate the complex fiber pathways for more favorable reconstruction of the white matter fiber tracts.
3.
Voxel-based morphometry (VBM) is applied to analyze the whole brain. The standard VBM examination is based on the pixel analysis, which requires spatial standardization firstly. That is to say, the brain structure images of an individual should be standardized into a standard three-dimensional space. Subsequently, the standardized brain structure images are effectively segmented to obtain three types images of gray matter, white matter and cerebrospinal fluid. After that, the images to be studied should be smoothed. Finally, 3D pixels statistics can be applied to measure the anisotropy and diffusion changes of the whole brain.
4.
Concerning the method of fMRI and DTI images fusion, the fMR imaging provides the fiber tracer seeds to register both fMRI and DTI images into statistical parametric mapping (SPM) system. In the FA image, the white matter ROI directly adjacent to the corresponding activated cortex can be chosen as the seed points for 3D white matter fiber tracts tracer imaging. According to the voxel with most obvious change based on BOLD fMRI signal, three adjacent seed points are selected in both cerebral hemispheres. Such a way of selection is due to the obviously different connectivity patterns resulted from the white matter fibers images originated from adjacent voxels. To harvest different cortical connectivity patterns is in line with the intracerebral cortical complex connectivity. Therefore, the selection of three adjacent seed points can reduce the probability of important connecting path loss resulted from the minor errors in placing the seed points. Meanwhile, after SPM software processing, the three seed points produced connecting fibers can be merged. It also has the advantage that the functional area information provided by fMRI can prevent the large artificial error caused by random selection of the seed points. Especially in cases with intracerebral space occupying lesions, the normal anatomical markers are migrated.
26.1.2.2 Application of DTI in HIV/AIDS Related Dementia
HIV can pass through the blood brain barrier to replicate itself in brain tissue, which evolves into nerve tropic HIV strain to invade the nerve cells. In the cases with direct invasion of HIV-1 to the brain, the neuropathological changes occur to cause continuously progressive loss of intelligence and motion function, namely cognitive and behavioral problems, which is known as AIDS dementia complex (ADC), HIV-1 related dementia complex, HIV encephalopathy or HIV-1 related cognitive/motion syndrome. The manifestation is white matter and subcortical HIV encephalopathy and about 20–90 % HIV infected patients have such lesions, including extensively responsive astrocytosis, blood borne macrophages infiltration, inherent microglia activation and the formation of multinucleated giant cells. Some patients with HAD only have slight pathological changes, such as atrophic lesions in frontal and temporal region. HAD is commonly diagnosed in the advanced stage of AIDS. However, the early diagnosis and accurate diagnosis of HAD is the key to improve the therapeutic efficacy and quality of life of the patients.
Before the application of HAART therapy, the average survival period of HAD patients is 6 months. After the application of HAART therapy, the average survival period of such patients is prolonged seven times as long as those with no HAART therapy. Meanwhile, the newly emerging incidence and mortality of HAD both decrease. Therefore, early detection is critically important for the therapeutic efficacy of HAD. In the developed countries with application of HAART therapy, the incidence of HAD has decreased by about 50 %, compared to that in 1990s. Some studies in China indicated that the period from the diagnosis of HAD to the occurrence of death is averagely 4.17 months, which is shorter than that reported internationally. Moreover, the number of newly emerging cases of HAD increases in some regions. For instance, about 1,300 cases paid their clinic visit to the HIV section, neurology department in Johns Hopkins University during 1994–2000, with a slight increase. In Australia, the incidence of HAD increased from 5.2 % in 1993–1995 to 6.8 % in 1996–2000. HAD remains to be an important public health problem, especially in the developing countries with insufficient supply of antiviral drugs. Therefore, HIV is another main cause of dementia in addition to Alzheimer’s disease and vascular dementia worldwide.
Currently, the diagnosis of HAD is based on typical clinical manifestations and exclusion of other causes. Otherwise, its diagnosis can also be made based on neuropsychological behavior test. But it only defines the damage severity of cognitive execution function but fails to detect the pathological state of HAD. It has been documented that 22.4–47.5 % patients with AID sustain clinical symptoms of neurological lesions. However, autopsy revealed that about 87–90 % patients with AIDS have pathological changes of central nervous system. In asymptomatic patients, 5.5–43 % has neuropsychological disturbance. The discrepancy of the incidences is due to the insufficient sensitivity of the diagnostic examination. Recently, neuroimaging technology has gained a rapid development, with advantages in its directness compared to speculations proposed based on neuropsychological behavior test and other assistant examinations, which effectively decreases the testing errors.
The mechanism of nerve cells damage and apoptosis caused by HIV infection remains unknown. Therefore, the studies for its pathogenesis and early diagnosis are necessary but challenging. DTI facilitates our understanding to the pathology and physiology of HAD, which also provides basis for the diagnosis of HAD. In addition, it has special significance in assessing cerebral functions of HIV positive patients. In recent years, some scholars have attempted to assess HAD related white matter lesions by using DTI technology.
A preliminary study using DTI has demonstrated that DTI is particularly sensitive to microstructure of white matter and the microstructural abnormality is related to the severity of the disease. Filippi et al. studied the diffusion and anisotropy in HAD patients by using DTI and the patients have a viral load ranging from undetected to 400,000 [39]. It has been found that with the increase of viral load, the anisotropy of the corpus callosum genu and splenium decreases. In addition, along with the increase of viral load, the patients have increased diffusion of subcortical white matter. However, the viral load cannot be detected in patients receiving HAART therapy and their anisotropy and diffusion are normal. Pomara [86] & Ragin [88], et al. found that the fractional anisotropy is a more sensitive index. In their study, the FA values of the frontal and whole brain significantly decreased compared to the control group.
Y. Wu et al. [117] performed a study by using DTI technology, which has demonstrated that the corpus callosum and frontal white matter have diffusion abnormalities. Their further study for the relationship between the diffusion abnormalities and the severity of cognitive deterioration demonstrated that the FA value of the corpus callosum splenium in patient with HAD significantly decreases compared to the normal control. In addition, the diffusion abnormalities are related to the severity of dementia and the rate of motion functional loss. The MD value also significantly increases, which is related to the rate of motion functional loss. The FA value is also related to the visual and oral memory. The quantitative neuroimaging assessment of the integrity of the corpus callosum is a potentially effective marker for brain lesions in HAD patients. David F. Tate et al.. proposed that most scholars pay their focused attention to the quantitative changes of the DTI indices but ignore the diffusion direction [25]. Their study by fiber tractography found that the tractography indices can provide information about the clinical cognitive ability of patients, suggesting the importance of microstructural changes of the white matter in assessing the cognitive ability.
Adolf Pfefferbaum et al. studied 42 cases of AIDS patients without dementia and 88 age-matched healthy volunteers [84]. In the study, the researchers measured 11 association fiber tracts and projecting fiber tracts as well as 6 association fiber tracts, with the indices of FA value, apparent diffusion coefficient, horizontal diffusion coefficient and longitudinal diffusion coefficient. The study of frontal striatum fiber tracts in AIDS patients without dementia found higher diffusions (mainly longitudinal) of the posterior corpus callosum, internal and external capsules, and the superior cingulate bundle. Neuroimaging evidence indicates that HIV positive patients without dementia have association fibers and association fiber tracts lesions, which accelerate the progression of HIV infection into AIDS. Otherwise, HAART therapy can alleviate the conditions.
Edith V. Sullivan et al. studied 40 cases of HIV positive patients without dementia and 83 healthy volunteers [100]. All the subjects received quantitative balance experiments, digital symbol test and finger movement speed and flexibility test. The DTI quantitative examination was performed to assess the infratentorial brain area, supratentorial ventricular system, callosum, pontocerebellar tract as well as internal and external capsular motion fiber system. The correlationship between the DTI indices and the results of behavioral tests was analyzed. It has been found that the ratio of infratentorial to the whole brain in HIV positive patients is 3 % less than that of the healthy control. The HIV positive patients have behavioral problems in single foot balance test, digital symbol replacement task. The proportion of their whole infratentorial brain tissues is significantly related to the balance. However, the size of cerebral ventricles and the callosum, as well as the integrity of the internal and external capsular fiber bundle and pontocerebellar tract are not related to the balance ability.
Yasheng Chen et al. studied 8 cases of HAD [24], 21 cases of HIV positive patients without dementia (HND) and 18 healthy volunteers. The region of interest was the white matter of the whole brain, including the frontal, parietal, temporal and occipital white matters, the corpus callosum, and the internal capsule, with measurement indices of FA, MD, transverse diffusion coefficient and longitudinal diffusion coefficient. Compared to the healthy control, all the indices have significant differences from the patients with HND and HAD. The MD and longitudinal coefficient of parietal white matter have significant difference between patients with HAD and HND. Patients with HND and HAD had extensive abnormalities in the brain and the abnormalities of the four DTI indices in HAD patients were more serious. The longitudinal diffusion coefficient based on the voxel analysis is more sensitive to HIV infection than the transverse diffusion coefficient, indicating the demyelination is the primary lesion the white matter.
DTI is a valuable imaging technology in studying the microstructures of living HAD patients, which can provide anatomic details that routine MR imaging fails to demonstrate. With the advantages of histopathological visualization of microstructures and the functional brain imaging, DTI is an effective tool for the brain comprehensibility, noninvasiveness and functions. However, in the related studies, the anatomic ROI and the research methodology are different. Therefore, the results greatly vary. Moreover, due to the heterogeneous magnetic field and the sensitivity to motion artifact of the planar echo sequence, the images are geometrically deformed to a certain degree. Therefore, in neuromorphological studies, the imaging is not so favorable for low noise small white matter fiber tracts and fiber overlapping areas. Currently, the brain diffusion in patients with HAD is still a hot research area internationally. And the current problems can be resolved with the development of MRI device and imaging processing techniques. With the development of DTI research, its application in functional brain diseases is promisingly wider.
26.1.3 Perfusion Weighted Imaging (PWI)
Perfusion refers to the process of delivery of oxygen and nutrients to the tissues and cells when blood flows through the capillary bed. To some extent, it defines the hemodynamic state and functions of tissues or organs. Because the physiological and pathological changes of tissues and organs are closely related to the changes of blood flow perfusion, the changes monitoring can therefore reveal the pathological process of tissues and organs for early diagnosis or early functional assessment.
PWI is a functional imaging, which demonstrates vascular changes and blood flow perfusion, and provides hemodynamic information of the tissues and organs by using rapid magnetic resonance imaging sequence and image processing techniques. Currently, the procedures include intravenous injection of the contrast reagent for rapid imaging sequence. Specifically, intravenous bolus injection of contrast reagent gadolinium is performed for a high concentration of gadolinium to flow through the examined area in a short period of time. During this period, the rapid imaging technology such as EPI is used to scan the examined area to harvest the images when the contrast reagent initially passes through the vascular bed of the ROI. Because gadolinium has impact on the magnetic susceptibility of local tissue, it therefore increases the heterogeneity of local magnetic field and obviously shortens the T1 and T2 relaxation times. It has greater impact on the T2 relaxation time, which is demonstrated by more obviously shortened T2 relaxation time and decreased signaling. The degree of signaling decrease is positively related to the local reagent concentration. Therefore, it demonstrates the blood perfusion capacity of local tissue. The indices demonstrating blood flow distribution in the capillary bed include: (1) capacity indices, such as regional cerebral blood volume (rCBV); (2) speed indices, such as mean transition time (MTT) and local perfusion time to peak (TTP); (3) flow volume indices, such as regional cerebral blood flow (rCBF). Based on the signaling decrease of local tissue along with time, a signal intensity-time curve can be obtained, as well as a concentration of the contrast reagent-time curve. The area under the curve demonstrates the blood capacity of the cerebral tissue, namely rCBV. The processing of regional rCBV through the working station can show its corresponding greyness or color, namely rCBV image. In the same ways, rCBF image of the contrast reagent, MTT image and TTP imaging can also be obtained.
26.1.4 Blood Oxygenation Level Dependent fMR Imaging (fMRI-BOLD)
Functional magnetic resonance imaging (fMRI) has been widely applied in scientific research of the brain and clinical practice due to its noninvasive and radiation-free as well as effective demonstration of anatomic structures and their functions since it was proposed in 1990s. It plays an important role in neuroscience research, which has been proved to be a powerful tool in demonstrating motions, visual sense, auditory sense and the rest state as well as functional brain network.
BLOD-fMRI is a noninvasive examination of the brain function, which is based on the difference of oxyhemoglobin and deoxygenated hemoglobin. It demonstrates the functional activities of certain brain area in real time with high time and spatial resolutions, which facilitates the understanding of brain activities more objectively, accurately and directly. Due to its advantages, BLOD-fMRI has been widely applied in modern scientific research, such as neuroscience, cognitive and psychological sciences. And some breakthroughs have been achieved. The principle is that neurons in some brain areas are activated when the area is executing certain tasks or is stimulated. The results are increased blood flow volume and blood flow capacity of the adjacent venous blood and capillary bed, which further leads to increased content of local oxyhemoglobin and no marked increase of oxygen consumption. Therefore, the balance between oxygen supply and oxygen consumption is interrupted, with subsequent decrease of deoxygenated hemoglobin in this area. Deoxygenated hemoglobin is a paramagnetic substance. MRI is sensitive to changes of the magnetic field, which can detect the brain activated functional area by specific rapid imaging sequence and data processing method and has obvious T2 shortening effects. Therefore, in the activated state, the decreased deoxygenated hemoglobin in the brain area causes relatively prolonged relaxation time and increased intensity of MR signal, which is demonstrated as high signal by brain functional MR imaging. Generally, deoxygenated hemoglobin plays a role of endogenous contrast agent in BLOD-fMRI.
When HIV invades the central nervous system, the virus can be firstly found in the microgliacytes and phagocytes. Its infection of the neurons fails to directly induce the death of HIV related neurons. However, the mechanism of HIV related brain lesions is not fully elucidated. Multiple HIV related diseases can affect the brain functions. The knowledge of these abnormal manifestations and the imaging features of the brain lesions is important for the early diagnosis and therapeutic planning. The diagnostic imaging examinations including CT and PET are performed for patients in resting state. However, fMRI can demonstrate the functional activated brain area during tasks or after stimulations. In addition, it can detect early changes caused by HIV infection, such as minor cognitive motor disorder (MCMD) and HIV associated dementia (HAD).
HIV positive patients with common neurological functional impairments usually have cognitive, behavioral and motion difficulties, whose severity varies with the progression of the conditions. MCMD is believed to participate the functional degeneration of certain nerve cells while cell death occurs in the HAD stage. HAD has difficulties in attention, memory, learning, problem solving and social activities, with manifestations of emotional apathy and fatigue.
Currently, functional imaging studies in HIV positive patients are rarely conducted by using fMRI. The researchers selected different experimental tasks to assess the early central nervous system lesions in HIV positive patients. The experimental tasks include working memory test such as zero-back, one-back and two-back, attention and mathematic calculation assessment as well as respond speed test. When the subjects executed simple reaction task and work memory test, bilateral lateral prefrontal cortex (LPFC), posterior parietal cortex (PPC) and caudate nuclei were all activated. Compared to the controls, complex tasks usually induce activated supplementary motor cortex (SMA) such as in the two-back test. In addition, compared to the controls, greater activation was found in the left and middle parietal lobe when HIV positive patients executed simple reaction task and one-back task. However, the activation significantly increased in frontal area including LPEC and SMA when they executed complex tasks such as mathematic calculation and two-back tasks. The brain activated areas are characterized by: (1) adjacent to the activation areas of healthy control; different activation range between HIV positive patients and healthy controls. During the process of BOLD-fMRI, with the increased difficulty of the task, HIV positive patients showed prolonged reaction time and decreased reaction accuracy, which also occurred in the healthy controls.
The activation in HIV positive patients demonstrates that the neural activities are saturated in the normal activation area and the execution of the tasks needs functional assistance by peripheral nerve materials, indicating the existence of reserve system in the nerve network. In different tasks, the nerve pathways play their role for such assistance. HIV infection plays a destructive role to the brain nerve materials, which may have impact on the brain nerve pathways. Therefore, when HIV positive patients execute simple tasks, large amount of energy reserve is consumed, with a small proportion of residual energy for executing more complex tasks.
BLOD-fMR imaging is a new research tool for early brain lesions of HIV positive patients. In the future studies, its use in combination with magnetic resonance spectroscopy (MRS), diffusion weighted imaging (DWI) and MR perfusion imaging (PWI) for the diagnosis provides new insights for the assessment of brain functions in patients with HIV/AIDS.
26.1.5 Magnetic Resonance Spectroscopy (MRS)
MR spectroscopy (MRS) is the only noninvasive examination for histochemical features of living body. In many diseases, metabolic changes occur prior to pathomorphological changes. MRS has a highly potential sensitivity to the metabolic changes for early diagnosis of these diseases. MRS demonstrates physiopathological changes of cell metabolism in human body, while routine MRI demonstrates physiopathological changes of the organs and tissues gross morphology. However, both are physically based on the magnetic resonance. MRS is an examination for quantitative analysis of specific atomic nucleus and their compounds, which utilizes the magnetic resonance and chemical migration and is the only non-invasive examination to quantitatively analyze metabolism and biochemical changes of the living tissues and organs. It is virtually molecular imaging. Based on chemical migration, it explores the frequency discrepancies of different substances, with the results represented with ppm. Currently, the atom nucleus applied in medical spectrum studies includes 1H, 31P, 13C and 19F. Especially, 1H and 31P are the most widely used in medical sciences. Currently, as the only non-invasive examination for metabolic and biochemical changes of the living tissues and organs, it quantitatively analyzes specific atomic nucleus and their compounds and has been widely used in clinical and basic studies of neoplasms, ischemic cerebral stroke, cerebral hemorrhage, senile dementia, neonatal intensive care, prognosis of brain trauma, white matter lesions, infectious diseases and AIDS. The commonly applied procedures now is single voxel PRESS 1HMRS, which has convenient and simple manipulation. However, its disadvantage firstly is compulsory appropriate area setting of single voxel and one-dimensional data that fails to provide spatial distribution of the metabolic abnormalities. Moreover, the correct voxel localization has to be based on the understanding of the lesions position in advance, which restricts its application. The recently developed two-dimensional or M-dimensional MRS technologies are targeting on these disadvantages. Chemical migration imaging for one time can be applied for multiple voxel MRS for two-dimensional or three-dimensional data. After computer processing of these data, metabolic images can be obtained. These images can be registered with routine MR T1 or T2 images for favorable background contrast, therefore a more direct view for the examination and diagnosis.
26.1.5.1 The Basic Principal of MRS
Two factors determine the resonance frequency of magnetic resonance signal. The first factor is the gyromagnetic ratio that indicates the inherent property of the atoms. And the other factor is magnetic intensity at the place of the nucleus. The magnetic field of nucleus is determined by the external main magnetic field B0 while the magnetic intensity of the nucleus is related to the extranuclear electron cloud and adjacent atomic cloud. The electron cloud can shield the effect of the main magnetic field to cause weaker magnetic intensity of the nucleus than external main magnetic field. This magnetic field discrepancy caused by electron cloud is known as the chemical migration. Therefore, in certain external magnetic field, different nucleus is in different chemical environment to cause minor difference in resonance frequency and different peak of magnetic resonance spectrum. As a result, different metabolites and their concentrations can be recognized. By MRS, the concentrations of many important compounds can be detected, based on which the changes of tissue metabolism can be analyzed. By 1H-MRS, the resonance peak of 12 brain metabolites and neurotransmitters can be determined, including NAA, Cr, PCr, Cho, Mi, Gln, Glu and Lac. Many biomolecules contain 31P, which participates in cellular energy metabolism of cells and biomembrane related phospholipids metabolism. 31-PMRS has been widely used in analysis of brain tissues energy metabolism and acid–base balance to measure the contents of PCr, PI α-ATP, β-ATP and γ-ATP, as well as the intracellular pH value.
26.1.5.2 Clinical Application of MRS
MRS Changes of Normal Human Brain
The MR spectrum changes of normal human brain can demonstrate the growth and differentiation of the neurons, brain energy metabolism and the myelin sheath disintegration. NAA is commonly found in mammalian nervous system, almost all of which can be found in the nerve pairs. Currently, NAA is believed to be an internal marker of the neuron functions. In healthy people, the ratio of NAA/Cr is high and the decrease of NAA indicates absence or destruction of the neurons. Both Cho and Cr can be found in neurons and gliocytes. However, cell studies have demonstrated that the contents of Cho and Cr in oligodendrocytes and astrocytes are obviously higher than those in neurons. Therefore, the increases of Cho and Cr suggest the occurrence of gliosis. The decrease of NAA or increases of Cho and Cr results in the decrease of NAA/(Cho + Cr) which is often used as the indicator of the neuron function. In addition, 1H-MAS has demonstrated that NAA increases twice as high as that at birth within one year, with corresponding increase of the creatine signal. Along with the age, NAA/Cr and Glu-n/Cr increase and MI/Cr decreases. 31P-MRS has demonstrated that along with the age, the PME signal weakens compared to other metabolites and the creatine phosphate increases. These findings indicate that by quantitative analysis of the brain tissue metabolites by MRS, the development and maturity of the brain tissue can be understood. In addition, these findings also indicate that age related changes should be aware of during observation of pathological spectrum.
MRS of Epilepsy
1H-MRS has demonstrated that lateral to the epilepsy lesion and adjacent to the middle temporal lobe, the NAA peak value decreases by 22 %, with increases of Cho and Cr values by 25 and 15 % respectively. The decrease of NAA indicates the absence, defect or dysfunction of neurons in the lesion. The increases of Cho and Cr suggest gliocyte proliferation. The previous studies tend to use NAA/(Cho + Cr) as the marker of lateralization and abnormality. In healthy people, the bottom value of NAA/(Cho + Cr) is 0.72. The two-side discrepancy being above 0.05 or significant two-sided decreases than those in healthy people can be defined as abnormality. The decreased ratio indicates hippocampal sclerosis. The lateralization sensitivity of NAA/(Cho + Cr) is 87 % and the accuracy, 96 %. In addition, 1H-MAS can be also applied to determine epilepsy activity related neurotransmitters, including r-aminobutyric acid (GABA), glutamic acid (Gln), and hydrochloric acid of glutamic (Glu).
MRS of Brain Neoplasms
1H-MAS is an effective way to study brain neoplasm materials and energy metabolism, which contributes to the diagnosis and differential diagnosis of brain neoplasms. It can provide information about the histological grading as well as assessment for recurrence and therapeutic efficacy. The 1H-MAS demonstrates differences between tumor tissues and the normal brain tissues. The increase of Cho value indicates increased membrane metabolism and the decrease of NAA peak value indicates the migration of neurons due to compression. 1H-MAS demonstrates meningiomas and brain metastatic tumors as deficient NAA signal and decreased creatine peak value. In addition, 1H-MAS demonstrates meningioma as abnormal alanine signal. In the cases of brain metastatic tumor, the characteristic finding is the paired resonance peak, which is the occurrence of lipid fluidity. In the cases of low-grade malignant glioma, the creatine signal peak is almost the same as the normal brain tissue. However, the Cho signal peak doubles, with small NAA signal in the tumor, which is in consistency with the invasive growth of glioma. These findings demonstrate that a small amount neurons remains in the tumor. In about 50 % cases of glioma, lactate signal can be found. The highly malignant part is demonstrated to have significantly decreased or even absent NAA and Cr peak values. Some other demonstrations are similar to those of low grade malignant glioma. The difference is due to the heterogeneity of glioma structure, namely the proportional difference of parenchymal and necrotic components. The necrotic lesions are demonstrated as decreased Cho peak value and increased lactate peak value. The increased lactate peak value indicates poor prognosis, which plays an important role in radiotherapeutic planning.
MRS of Cerebral Ischemia and Infarction
The demonstrations include decreased NAA signal peak value and decreased Cho peak value. The decrease of the Cho peak value is different from the demonstration of encephaloma. In the cases of cerebral ischemia and infarction, the decrease of NAA is obviously larger than the decrease of total Cr and Cho values. The brain ischemia lesions caused by neonatal hypoxia have demonstrations of obviously decreased NAA peak value of the basal ganglia, and different strength of lactate signal. The higher signalling indicates more serious hypoxia.
MRS of Alzheimer’s Disease
The decrease of NAA can sensitively and accurately demonstrate demyelination of neurons in the cases of Alzheimer’s disease. Previous studies have shown that patients with AD have obviously decreased NAA level but increased MI level. Their levels in the white matter are closely related to the severity and duration of dementia. The ratio of NAA/MI can be used to differentiate AD from normal brain.
MRS of Other Conditions
In addition to the above mentioned clinical applications, MRS plays important roles in the diagnosis of brain metabolic diseases and white matter demyelinating disease, as well as in assessing the prognosis of multiple sclerosis, traumatic brain injury. For instances, children with non-ketone glycine hyperlipidemia have excessive glycine signal by 1H-MAS. Patients with Canavan’s disease have specific increase of NAA signal. In the acute plaque period of demyelinating diseases, the concentration of choline chemical compound is t by 1H-MAS, but decreased NAA concentration when the conditions are stable. These findings indicate that 1H-MRA can be used to monitor the clinical changes of the acute phase, chronic phase and advanced plaque phase. In recent years, many scientific studies have paid focused attention on the specific peak values of demyelinating diseases. From the perspectives of monitoring and therapeutic efficacy, the data is valuable.
26.1.5.3 1H-MRS Resonance Peak of Human Brain Metabolites and its Clinical Significance
NAA
The main peak is located at 2.02 ppm and is the highest in normal MRS. NAA are mainly located in the neuron and its axon, which is believed to be the internal marker of the neuron. Many brain diseases including inflammations, infections, neoplasms, dementia and gliosis can cause neuron dysfunction and therefore decreased NAA. By MRS, decreased NAA is rarely found which can only be found in cases of Canavan’s disease.
Choline
The resonance peak is located at 3.22 ppm. Cho includes choline phosphate, phosphatidylcholine and glycerophosphate choline, which is the marker of membrane flip. Its content in the white matter is higher than that in the gray matter. The increased Cho indicates increased cellular membrane synthesis or increased cell count, which is the demonstration of wound repair, neoplasms, gliosis and demyelination. The decreased Cho indicates cell density decline,, which is the demonstration of dementia, cerebral stroke and AIDS.
Creatine/Creatine Phosphate (Cr)
The resonance peak is located at 3.0 and 3.94 ppm. In the normal brain MRS, it is the second or third highest peak. Cr is an important compound for energy use and storage, which is a marker of cellular energy state. In infants, its level is low, which increased with age. It pathological increase can be found in the cases of trauma, hyperosmolar state, while its pathological decrease can be found in the cases of hypoxia, stroke and neoplasms.
Lactate (Lac)
The resonance peak is located at 1.33–1.35 ppm, which is double peaks and is absent in normal brain tissue. Lac is a glycolytic terminal product, whose occurrence indicates terminated effective aerobic respiration. In the cases with occurrence of long TE from short TE, the Lac peak can be reverse. The Lac peak occurs in the cases of brain neoplasms, abscesses, cysts and infarction.
Muscular Inositol (mI)
The resonance peak is located at 3.56 and 4.06 ppm. mI plays roles in adjusting osmotic pressure, nourishing cells, anti-oxidation and generating surfactants. It is the marker of neuroglia, and its increase is believed to be a sign of gliosis.
Glutamine and Glutamic Acid Complex (Glx)
The resonance peak is located at 2.2–2.4 ppm (β + γ peak), 3.6–3.8 ppm (α peak). Glx has effects of activating toxicity and increases in the cases of brain tissue ischemia and hypoxia as well as hepatic encephalopathy.
Lipids (Lip)
The resonance peak is located at 1.33–1.35 ppm, which is absent in normal brain tissue. Its increase can be found in the cases of high-grade tumor, abscess, acute inflammation and acute stroke.
26.1.6 Clinical Application of Functional MR Imaging
Functional MR integrates the nerve activities with high resolution magnetic resonance imaging, which is a only non-invasive examination to accurately position the human brain functions. It not only provides basis for the diagnosis of the diseases, but also facilitates our understanding to the pathophysiology of some diseases, such as HIV associate dementia.
1.
HIV encephalitis (HIV associated dementia)
HIV virus is neurotropic and the central nervous system and peripheral nervous system are susceptible to its invasion. About 37–75 % of HIV infected patients develop HIV encephalitis. In some serious cases, dementia occurs. MRS demonstrates decreased NAA peak and increased Cho peak in the lesions. DWI demonstrates significantly decreased FA value and significantly increased ADC value of the cerebral white matter.
2.
Opportunistic infections
CMV encephalitis is the most common opportunistic infection in HIV positive patients. Its infection rate at the terminal stage of AIDS is up to 40 %.
Toxoplasma encephalitis is the most common opportunistic infection of the central nervous system of AIDS patients, commonly leading to abscess and granuloma. The typical demonstrations by DWI include even high signal and low ADC value. The MRS demonstrates decreased NAA, Cr, Cho and mI peak values in the lesions, and decreased ratios of NAA/Cr, NAA/Cho.
Cryptococcus neoformans meningoencephalitis is caused by invasion of Cryptococcus neoformans via the respiratory tract and along with blood flow to meninges and brain parenchyma. It the most common fungal infection of the central nervous system in AIDS patients, which commonly occurs in the advanced stage of AIDS.
Herpes simplex encephalitis is relatively rare. It is commonly caused by reactivated Herpes simplex virus spreading to the brain due to compromised immunity.
3.
Glioma
It is the most common primary intracranial tumor. AIDS complicated by glioma is rarely found. MRS, DWI and DTI can facilitate its diagnosis and differential diagnosis, which provide information about the histological grading, postoperative recurrence and therapeutic efficacy.
26.1.6.1 HIV Encephalitis
HIV encephalitis is also known as AIDS encephalopathy, HIV associated dementia (HAD) and AIDS dementia complex (ADC). It is the most common and serious neurological complication in AIDS patients. HIV fails to directly infect the neurons, but can infect macrophages and microglia in the brain tissues. These cells produce the inflammatory responses and release post-inflammatory cytokines and free radicals to impair the cerebral neurons, namely HIV encephalitis. And in some serious cases, dementia occurs. Gliocytes in the human brain is 10 times as many as the neurons and thus the impairment has a cascade effect.
In the early stage of HIV encephalitis, no obvious morphological changes of the brain can be found. With its development, varying degrees of brain atrophy occurs, with manifestations of local brain atrophy that is more obvious in the frontal and temporal lobes. In the advanced stage, the cerebral ventricles expand, with obvious brain tissues atrophy and brain weight loss. HIV encephalitis commonly involves the white matter or/and deep nuclei. The pathological changes include brain parenchymal and perivascular infiltration of lymphocytes and macrophage. There is also reactive proliferation of the astrocytes, as well as the formation of glial nodules by microglia, astrocytes and macrophages. The lesions of HIV encephalitis are generally in size of 0.2–2.0 cm, which distribute under the white matter and cerebral cortex and mainly symmetrical periventricular and semi-oval central white matter. The white matter lesions often extend to the subcortical area and the extensive lesions may involve the basal ganglia, cerebellum and brainstem.
HIV encephalitis is clinically characterized by cognitive impairment, decreased motion ability and behavioral changes. The diagnosis is based on the clinical symptoms as well as exclusion of other diseases that are not related to HIV infection.
The typical CT scanning demonstrations include bilaterally symmetric/asymmetric cerebral white matter lesions. In some rare cases, the lesions are unilaterally found. By plain CT scanning, the lesions are in low density. In the advanced stage, the lesions fuse together to form large flakes of low density lesions, with no space occupying effect. By enhanced scanning, no enhancement can be found. The lesions are commonly found in the periventricular white matter, semioval center, frontal and parietal lobes, and even subcortical area. Meanwhile, accompanying cerebral atrophy occurs. By MR imaging, diffuse cerebral white matter lesions can be demonstrated, with slightly low T1WI signal, high T2WI signal and no space occupying lesions. By enhanced imaging, no enhancement can be found.
In the period of no neurological symptoms of HIV infection and negative findings by conventional MRI, MRS can detect early abnormalities of brain metabolism. It can also be used to assess the involvement of the central nervous system. For HIV infected patients with no neurological symptoms, there are significantly decreased ratios of NAA/Cr and NAA/Cho in bilateral semioval center and thalamus, no significant change of Cho/Cr and mI/Cr ratios, more obvious change of NAA/Cr ratio in the white matter than in the gray matter and more obvious decrease of mI/Cr ratio in the gray matter. In addition, Cho/Cr ratio decreases less in the white matter than in the gray matter. The ratios of mI/Cr and Cho/Cr increase in bilateral basal ganglia. The NAA/Cr ratio decreases in the white matter of the frontal lobe, but Cho/Cr ratio increases. The mI/Cr ratio significantly changes in the basal ganglia, while NAA/Cr ratio decreases more in the white matter. For HIV infected patients with neurological symptoms, the NAA peak value and NAA/Cr ratio decrease, but the Cho and mI peak values increase. Lip and Lac peak values commonly increase. In the following ups after the treatment, some patients showed gradual decreased of the NAA/Cr ratio, but in some other patients, the ratio increases. In HDC patients, NAA/Cr and NAA/Cho ratios decrease in the frontal cortex, with increased mI/Cr and Cho/Cr ratios. mI/Cr ratio in the white matter increases. NAA/Cr ratio decreases in parietal cortex, with increased Cho/Cr and mI/Cr ratios. NAA/Cr ratio decreases in bilateral basal ganglia, with significantly increased NAA/Cr, Cho/Cr and mI/Cr ratios. mI/Cr and Cho/Cr ratios increase in the semioval center and the NAA value drops in hypothalamus. For children, the Cho/Cr ratio increases in the frontal gray matter, frontal white matter and the left parietal white matter.
For HIV positive patients without dementia, quantitative fiber tracer demonstrates increased diffusion coefficient in the posterior corpus callosum, internal capsule, external capsule and the superior cingulum and increased longitudinal diffusion coefficient (an index for axonal defect) in the posterior corpus callosum, fornix and superior cingulum. In untreated patients, the transverse diffusion coefficient (an index for myelin lesions) increases in the major forceps, inferior cingulum and superior longitudinal fasciculus. In patients with cognitive impairments, the FA values of multiple areas white matter significantly decrease, with significantly increased ADC values. Meanwhile, the MD values of the corona radiata, optic radiation, posterior limb of the internal capsule as well as the genu and splenium of the corpus callosum increase. Studies have shown that the FA value of the whole brain of HIV positive patients decreases, which is related to the severity of dementia. It has also been demonstrated that the ADC value of the whole brain is related to psychomotor dysfunctions.
PWI demonstrates that the rCBV of deep gray matter and cortical gray matter increases in HIV positive patients, indicating subcortical inflammatory responses. The rCBF values in bilateral frontal inferior lateral cortex and unilateral parietal inferior medial area decrease in early HAD patients. The white matter perfusion increases in the bilateral parietal inferior posterior area. The increased parietal white matter perfusion may be related to the reactive inflammatory responses or proliferative responses of the neuroglia, which may cause the increase of blood flow velocity. The abnormity of rCBF is related to the CD4 T cell count, the viral load and the severity of HIV dementia. Specifically, the lower rCBF value indicates more serious HIV encephalopathy.
Chang et al. studied the working memory performance of the patients [5]. The finding indicates indicate that the lateral frontal cortex, posterior parietal cortex and the accessional motion area are activated. In patients with serum negative findings, the total activated volume and the brain activated areas in BOLD images increased when they performed more difficult tasks. The brain activation and the difficulty of the tasks or attentional load may demonstrate the regulatory effect of the attention by the neural circuits. However, HIV positive patients showed increased total activation area when performing simple tasks, with locally increased activation. But these increases were absent whey they performed difficult tasks, which indicated that HIV positive patients require stronger stimulation (such as increase of attentional regulation) to the neural circuits to perform the simple tasks, which plays an role in compensating decreased neural processing efficacy due to brain lesions. In contrast, in healthy people or HIV positive patients, the activation volume is saturated when they perform more difficult tasks, indicating exhausted neural network resources. Therefore, the increased activation volume in HIV positive patients is most likely to be directly related to the attention.
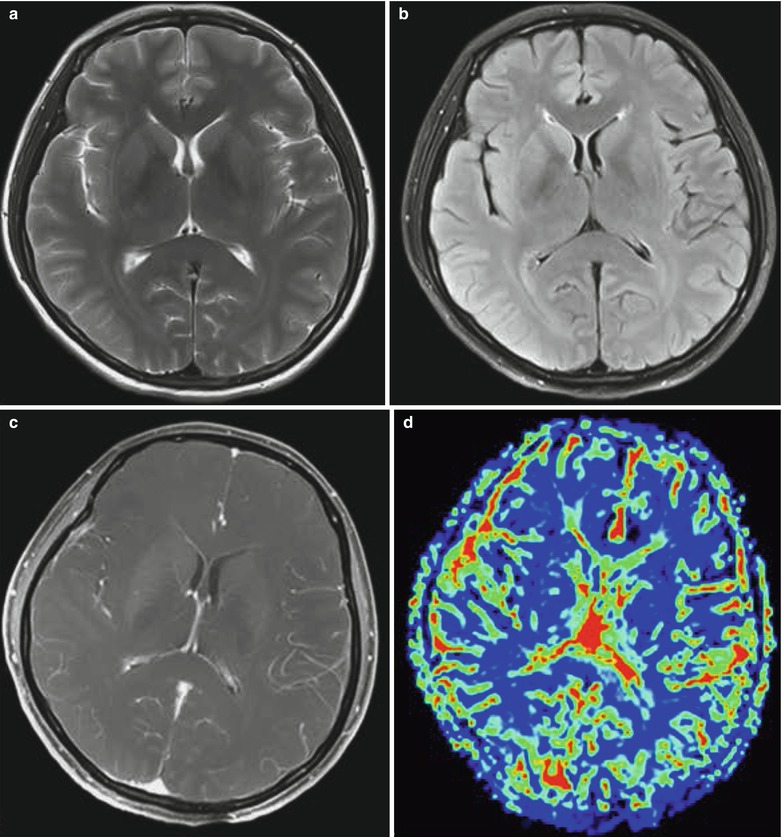
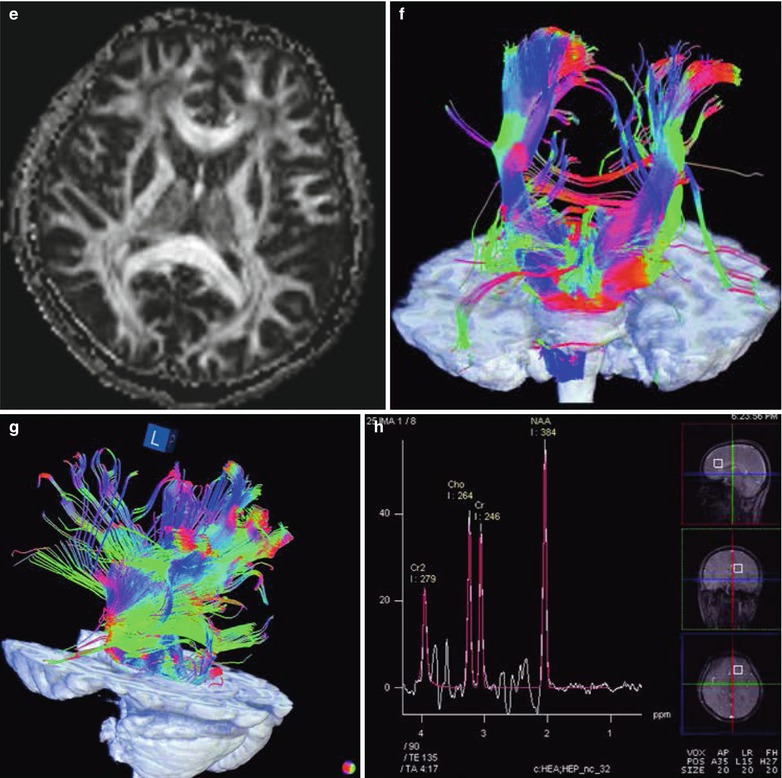
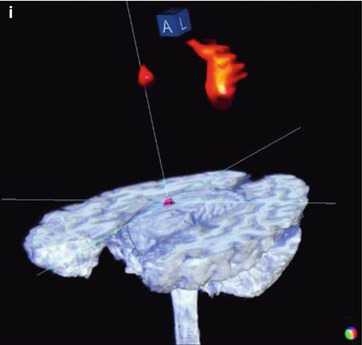
Case Study
A female patient aged 48 years was confirmatively diagnosed as having AIDS by the CDC. She had diarrhea, vomiting and occasional epilepsy seizures since May 2011. Her CD4 T cell count was 95/μl.
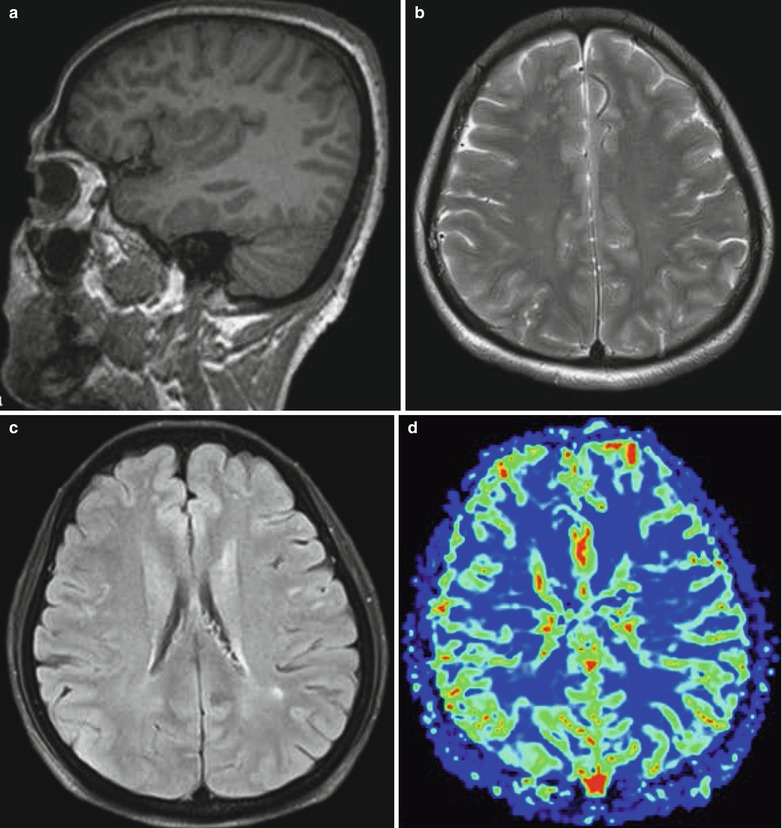
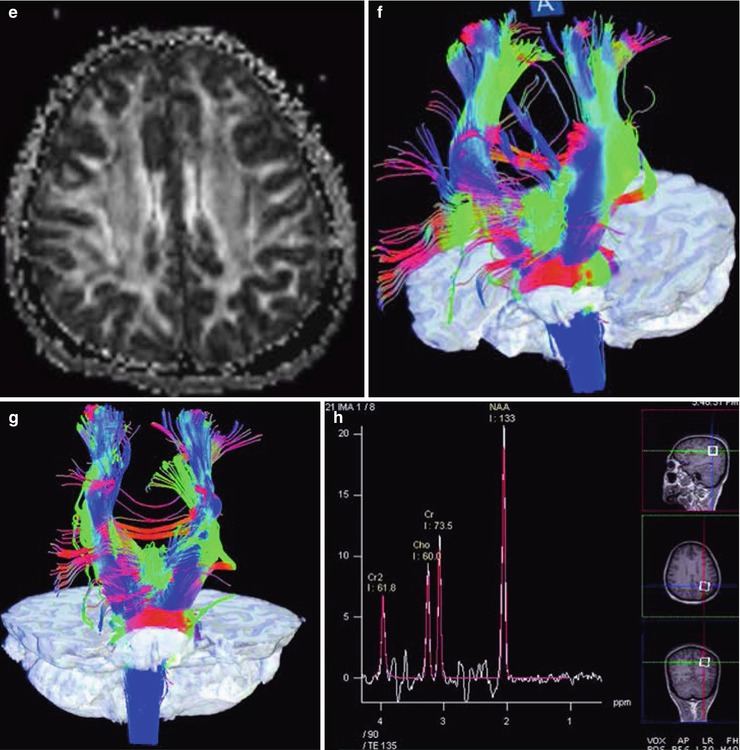
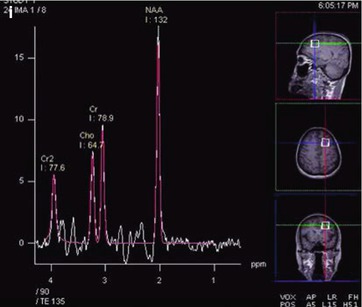
Fig. 26.1
(a–i) HIV/AIDS related HIV encephalitis. (a–b) MR imaging demonstrates multiple spots long T1 and long T2 signal in the subcortical white matters in bilateral frontal and parietal lobes, with unclear boundaries, that is more obvious in the bilateral frontal lobes. (c) Fat and water suppression T2WI demonstrates high signal. (d) Perfusion imaging demonstrates bilaterally symmetric CBF. (e) DTI demonstrates strips of decreased signal areas in the bilateral frontal and parietal lobes and decreased FA values. (f–g) 3D white matter fiber tracts tracer imaging demonstrates sparse fiber tracts in the left frontal and parietal lobes than the contralateral. (h–i) MRS demonstrates obviously decreased NAA/Cr in the white matter of the left frontal and parietal lobes
26.1.6.2 Toxoplasmosis Encephalitis
Toxoplasmosis encephalitis is a common complication of the central nervous system of AIDS patients, with an incidence of about 10–30 %. It is also a common cause of death in AIDS patients. Toxoplasma widely infests parasites in the healthy population, with no specific selectivity to the parasitized tissues. All nucleated cells except erythrocytes in the human body can be parasitized by toxoplasmas. Toxoplasmosis encephalitis in AIDS patients is commonly a result of activated latent infection. The toxoplasmas incubating in the cysts escape or cysts rupture to cause acute necrosis of the brain tissue. In combination with the participation of delayed hypersensitivity, glial nodules are formed in local brain tissue. The pathological manifestations include different degrees of coagulation necrosis and granulomatous inflammation, yellowish necrotic malacia, later calcification as well as edema and space occupying lesions. Clinically, the manifestations include low grade fever, headache and nervous system positioning symptoms in over 90 % cases. In some serious cases, death occurs. The findings of free or intracellular trophozoites in tissues, body fluids or nucleated cells can define the diagnosis.
Toxoplasmosis encephalitis commonly occurs in the basal ganglia (70–75 %), with multiple lesions and possible involvement of the cerebellum, brainstem and the interface of cortex and medulla. The diameters of the lesions are about 4.0–5.0 cm. The imaging demonstrations are characterized by bilateral multiple lesions but rare unilateral lesions. CT scanning demonstrates low density lesions with accompanying perifocal edema and space occupying effect. MR imaging demonstrations are different in different stages of the disease. In the stage of necrotic abscesses, high T2WI signal is found. In the stage of organic abscesses, equal T2WI signal is found. Generally, T1WI is in equal or slightly low signals. Enhanced CT scanning or MR imaging demonstrates obvious enhancement of the lesions, with even enhancement of the small nodules and spiral shaped, ring shaped or mass shaped uneven enhancement of the large lesions. The asymmetric and uneven target sign of the lesions enhancement indicates collapse of the abscess wall. The enhancement of lesions adjacent to the ependyma has diagnostic significance. After treatment, the high T2WI signal of the lesions is transformed into equal signal, indicating the progression of necrotic abscesses stage into organic abscesses stage. DWI typically demonstrates high signal, with pathological basis of coagulation hemorrhage and necrosis of local brain tissue. In the necrosis area, there are mainly inflammatory cells, toxoplasmas and proteins. Protein has a strong absorption to water molecules and thus to cause restricted water molecules diffusion. As a result, DWI demonstrates even high signal, with a low ADC value. MRS demonstrates decreased NAA, Cr, Cho and mI peak values, significantly decreased NAA/Cr and NAA/Cr ratios, lower NAA/Cr ratio in the acute stage than in the remission stage, increased Cho/Cr ratio, and obvious occurrence of Lip peak or its concurrence with Lac peak. After anti-toxoplasm treatment, NAA/Cr ratio returns to normal, but in some patients Cho/Cr ratio may decrease or continuously increase. PWI demonstrates decreased rCBV of toxoplasmosis encephalitis lesions, which may be caused by insufficient blood vessels in the lesions.
HIV/AIDS complicated by toxoplasmosis encephalitis should be differentiated from primary CNS lymphoma. Primary CNS lymphoma is commonly singular, with slighter peritumor edema than toxoplasmosis encephalitis but more obvious space occupying effect. It commonly invades the ependyma and corpus callosum. Enhanced scanning demonstrates map liked or sawteeth liked enhancement of the lesions. It shows no responses to anti-toxoplasmosis therapy but is sensitive to radiation therapy. DWI facilitates their differential diagnosis. For the cases with an ADC ratio (ADC value of lesion ROI to ADC value of contralateral ROI of normal brain tissue) being above 1.6, the diagnosis of toxoplasma infection should be considered. For the cases with the ADC ratio being lower than 1.0, the diagnosis of lymphoma should be considered. For the cases with the ADC ratio between 1.0 and 1.6, large overlapping of both diseases occurs. Therefore, for the cases of difficulty diagnosing, directed biopsy should be performed for the differential diagnosis. In addition, HIV/AIDS complicated by toxoplasmosis encephalitis should also be differentiated from tuberculosis meningitis. The localization of the lesions facilitates the differential diagnosis. The lesions of toxoplasmosis encephalitis are commonly found in the basal ganglia, while the lesions of tuberculosis meningitis are commonly found adjacent to the brain surface. The difference of the lesions location is possibly related to the infection route of the pathogens. Both toxoplasmas and TB can spread along with blood flow to seriously damage the blood brain barrier via multiple routes, especially the supplying area by the medullary branches of the middle cerebral artery. Deep brain is firstly infected by toxoplasmas, while meninges are firstly infected by tubercle bacilli, which may be related to the distribution of the lesions. The lesions of toxoplasma encephalitis are distributed in the nerve nuclei of the deep brain and the periventricular white matter, while the lesions of TB encephalitis are distributed in the brain surface, the cerebral cortex and the transitional area of the cortex and medulla.
Case Study
A male patient aged 34 years was confirmatively diagnosed as having AIDS by the CDC. He had no obvious symptoms, decreased coordination function and memory loss. His CD4 T cell count was 186/μl.
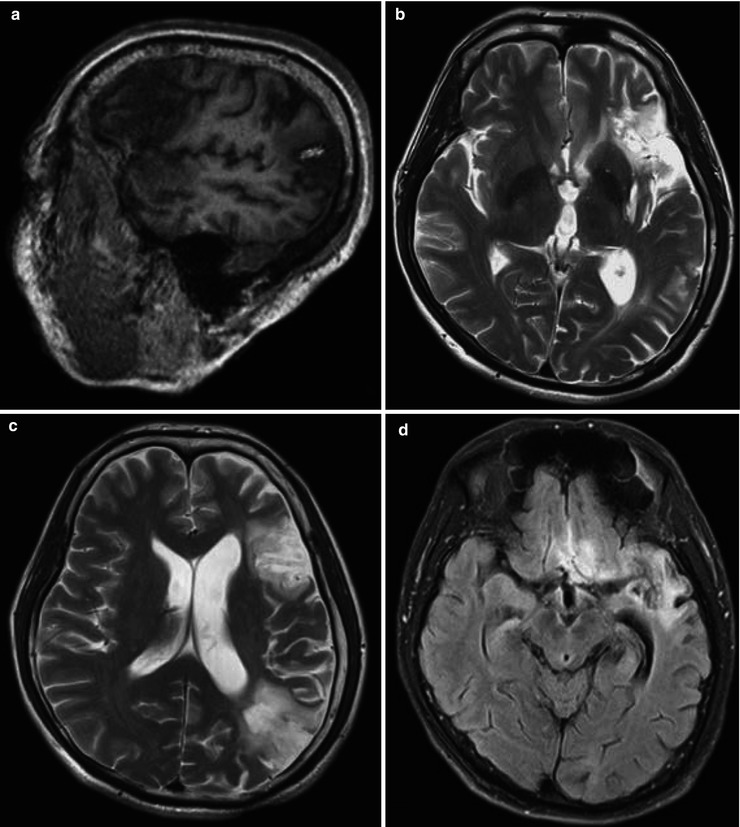
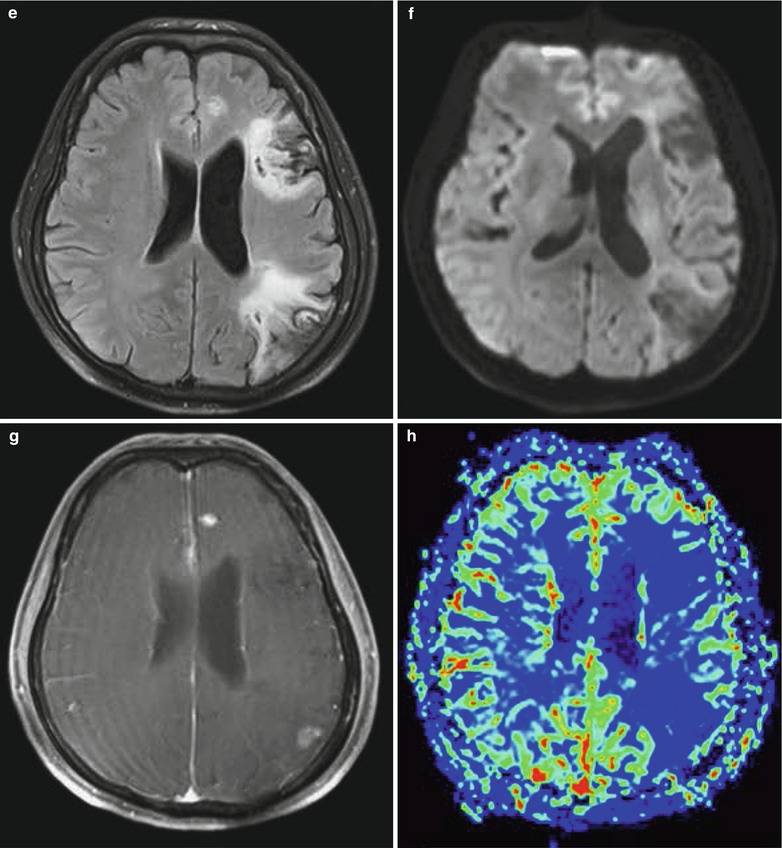
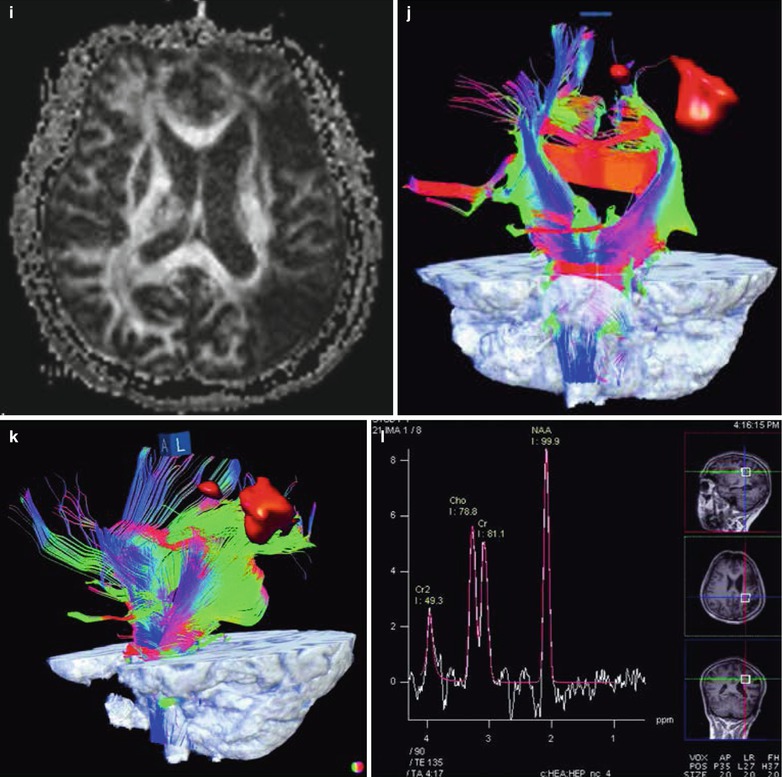
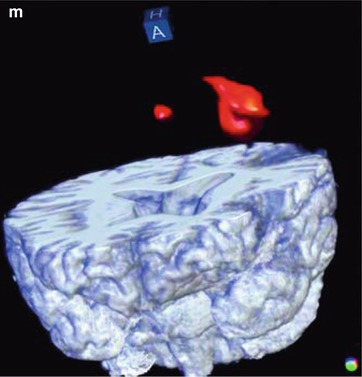
Fig. 26.2
(a–m) HIV/AIDS related toxoplasma encephalopathy, cytomegalovirus infection, TB meningitis, herpes meningitis sequela. (a–c) MRI demonstrates mass liked and cloudy long T1 and long T2 signals in the gray matter of the left frontal lobe, temporal lobe, frontal-temporal interface and parietal-occipital interface, with involvement of the white matter. The signals are uneven, and some signals are cerebrospinal fluid signal shadows. There are also widened cerebral fissure. (d, e) Tirm demonstrates high signals. (f) DWI demonstrates high signals. (g) Enhanced imaging with Gd-BOPTA demonstrates small mass liked enhancement of the lesion area in the left frontal lobe and occipital lobe. (h) Perfusion imaging demonstrates lower CBF of the lesion area than the contralateral part in the left frontal lobe and occipital lobe. (i) DTI demonstrates weakened signal of the white matter in the left frontal lobe, temporal lobe, frontal-temporal interface and parietal-occipital interface, with obviously decreased FA value. (j, k) 3D white matter fiber tracts tracer imaging demonstrates sparser transverse fiber tracts in the left frontal, temporal and occipital lobes than the contralateral areas. (l) MRS demonstrates decreased NAA/Cr ratio being 1.23 in the lesion area. (m) Simple movement test of the right hand demonstrates smaller range and amplitude of the motion activated areas of the left pre- and post-central gyri than those in healthy people
26.1.6.3 Cytomegalovirus Encephalitis
CMV infection has an incidence of 40 % in end-stage of AIDS, with common involvements of the cerebrum, cerebellum, spinal cord and spinal nerve roots. CMV encephalitis is more common in the temporal lobe, with possible involvements of both cortex and white matter. Its pathological manifestations greatly vary. The slight cases may have no inflammatory changes but only small quantity viral inclusions. The serious cases may have serious necrotic ependymitis and meningoencephalitis. The disease has a subacute process, with clinical manifestations of memory loss, apathy, consciousness disturbance and delirium. Approximately 30 % patients complain of headache and 50 % patients complain of focal neurological defects. By laboratory tests, the CMV titer in cerebrospinal fluid increases. By brain tissue biopsy, eosinophilic CMV inclusions can be found in the cells.
The imaging demonstrations of cytomegalovirus encephalitis are non-specific. The incidence of cerebral atrophy and ventricular dilation is about 40 %. CT scanning demonstrations can be normal, or can be cerebral atrophy with dilated ventricles. In some cases, scattering or diffuse low density lesions can be found in the paraventricular white matter. Enhanced scanning demonstrates ring shaped or nodular enhancement. MR imaging demonstrates periventricular diffuse white matter lesions or irregular strip liked lesions, with low T1WI signal and high T2WI signal. In the large lesions, there are commonly weakened signal areas. Enhanced imaging demonstrates diffuse irregular enhancement under the ependyma. However, there is no enhancement of the white matter lesions, which is the key difference from progressive multifocal leukoencephalopathy.
Case Study 1
A male patient aged 18 years was confirmatively diagnosed as having AIDS by the CDC. He had fever, headache and functional disturbance of the left limbs. His CD4 T cell count was 60/μl.
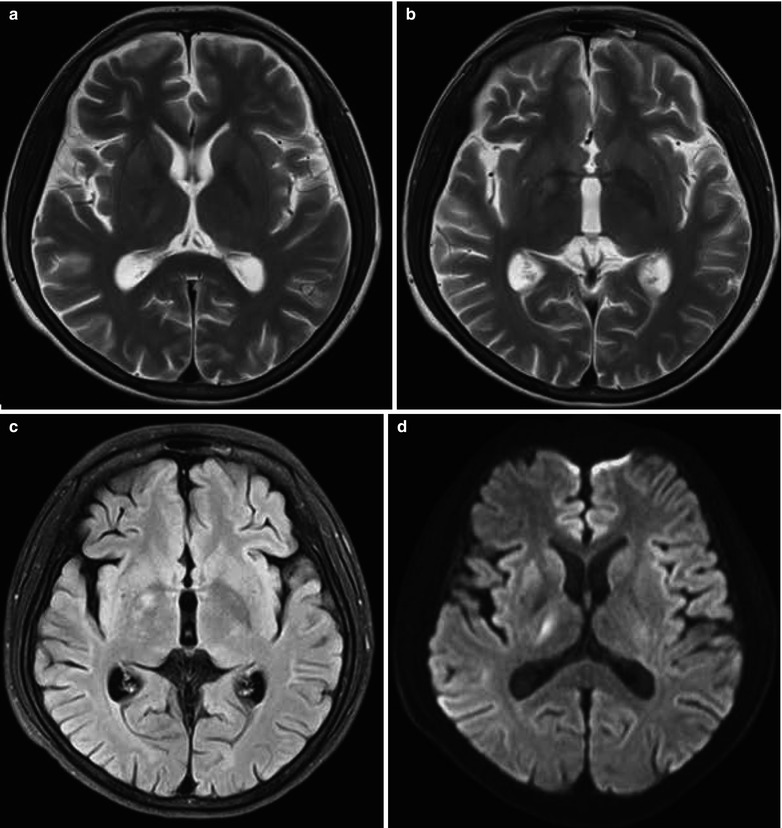
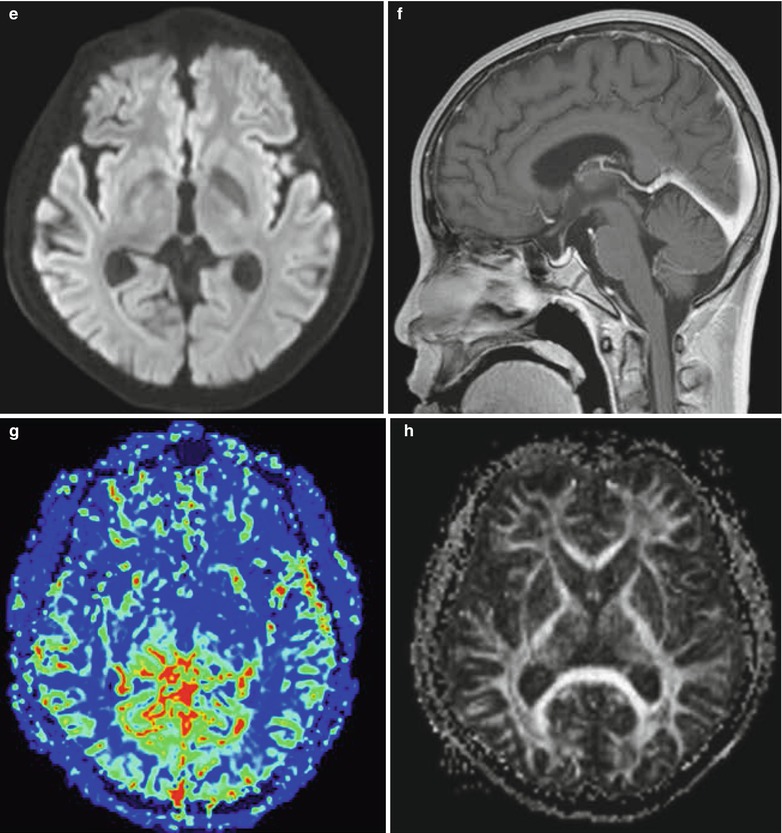
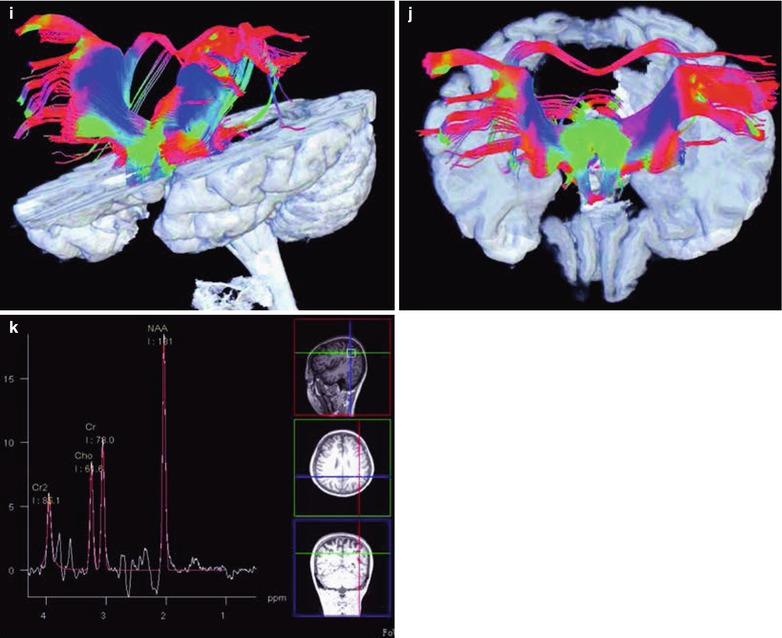
Fig. 26.3
(a–k) HIV/AIDS related CMV encephalitis. (a, b) MRI demonstrates flakes of slightly higher T2WI signal in the right basal ganglia, with blurry boundary. (c) Tirm demonstrates high signals. (d, e) Diffusion imaging demonstrates high signal. (f) Enhanced imaging demonstrates obvious abnormal enhancement of the tentorium and occipital meninges. (g) Perfusion imaging demonstrates higher CBF in the right basal ganglia than the contralateral part. (h) DTI demonstrates symmetric signals in the white matter of bilateral basal ganglia. (i, j) 3D white matter fiber tracts tracer imaging demonstrates almost bilaterally symmetric fiber bundles. (k) MRS demonstrates increased NAA peak value
Case Study 2
A female patient aged 38 years was confirmatively diagnosed as having AIDS by the CDC. She had no obvious neurological symptoms and signs. Her CD4 T cell count was 566/μl.