Fig. 16.1
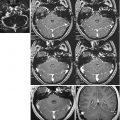
Seven-tesla T2*/phase features and contrast enhancement dynamics in (a, b) centripetal and (c) centrifugal enhancing lesions. The hypointense phase rim is clearly visible in (a, b), but whereas it is clearly seen on T2* in (a), it is virtually invisible on T2* in (b). In (c), a centrifugal lesion is subtly but homogeneously hypointense on phase. The area of phase hypointensity, delimited by cyan dashes, is smaller than the area of T2* hyperintensity (indicated by white dashes). (d) Stable phase and T2* features, including a thick rim, in a chronic lesion at baseline and 1.3 years later. DCE5 dynamic contrast-enhanced; MPRAGE5magnetization-prepared rapid gradient echo”
A limited number of studies have tracked the longitudinal evolution of the previous abnormalities. A longitudinal study of 29 patients with possible but unclear diagnosis has shown the presence of a central vein in most lesions to accurately identify MS patients [60]. Another study has shown that ring phase lesions remained unchanged over a 2.5-year period in five RRMS patients [5], whereas such a ring can be transient in acute lesions [1, 39].
16.3.2 MRI and MS Pathophysiology
16.3.2.1 Cortical Lesions
Pathologic studies have shown extensive involvement of the GM in MS patients [8, 49, 69]. According to their location within the GM, different cortical lesion (CL) locations (subpial, purely intracortical, and leukocortical lesions abutting the GM/WM border) have been identified [69]. Imaging CL is challenging (particularly using conventional clinical scan protocols). Different MRI techniques have been proposed and are currently being compared for their sensitivity to CL detection, including DIR [41], phase-sensitive inversion recovery (PSIR) [28, 63, 100], and magnetization-prepared rapid acquisition with gradient-echo [62] sequences. Despite this, correlative MRI pathology studies have shown that many CLs remain invisible on MRI, at least at 1.5 and 3.0 Tesla MRI strengths [98, 99].
Using DIR sequences at 1.5 T, CLs have been identified in more than 30 % of CIS patients [17, 33]. In a cohort of 80 CIS patients with a 4-year follow-up, the accuracy of MRI diagnostic criteria for MS was increased when considering the presence of at least one IC lesion on baseline scans [33]. CL assessment may also help in the differential diagnosis between MS and mimicking MS conditions, since they have not been found in patients with migraine with T2 WM lesions [2] or NMO [16]. IC lesions are also rare in healthy controls (1/60 subjects using PSIR sequences) [100].
The quantification of CLs in MS patients contributes to a better characterization of the clinical heterogeneity of the disease, in terms of clinical phenotypes and symptoms. CLs are more frequently seen in patients with secondary progressive (SP) MS than in those with CIS or relapsing-remitting (RR) MS, whereas in patients with benign (B) MS, they are fewer than in those with early RRMS [13]. Longitudinal studies have shown that new CLs continue to form in the main MS phenotypes [13]. CL burden has been associated not only with the progression of disability over the subsequent 2 to 5 years [14, 15, 18] but also with the severity of cognitive impairment [15, 19, 86].
Ultrahigh-Field MRI
CLs have been imaged with improved spatial resolution both ex vivo [48] and in vivo [57, 104] using ultrahigh-field MRI systems (≥7 T), despite the challenges presented by the B0 and radiofrequency field inhomogeneities and the potential for higher RF deposition compared to lower fields. The use of T2*-weighted imaging at 7 T also improves GM/WM contrast, allowing better definition of the lesion territory [59, 72]. Additionally, the greater spatial resolution helps to minimize the partial volume between parenchyma and adjacent cerebrospinal fluid (CSF). Several studies have tried to optimize 7 T imaging in order to improve the detection and classification of cortical MS lesions and to develop a clinical acquisition protocol [24, 51, 104]. Sinnecker et al. [104] showed that CLs are hypointense on 3D magnetization-prepared rapid acquisition gradient-echo scans, while Kilsdonk et al. [51] found that 3D fast fluid-attenuated inversion recovery (FLAIR) sequences detect a higher total number of GM lesions than 3D DIR sequences.
The advantages of 7 T and multichannel receive technology have enabled the identification of different cortical lesion types in a small MS population, based on visual inspection of focal cortical hyperintensities on T2*-weighted fast low-angle shot (FLASH) and T2-weighted turbo-spin-echo (TSE) images [57]. The frequency with which different lesion locations were observed in the cortical ribbon, including subpial lesions, conformed to previous descriptions of the neuropathology [8]. The number of subpial lesions correlated with clinical disease severity measures, suggesting that ultrahigh-field MRI is potentially a sensitive and specific marker of cortical pathology in MS. Interestingly, T2*-weighted images were the most sensitive for detecting cortical MS lesions, compared to phase, T1, and T2 TSE-weighted images [57]. Noteworthy, plaque-like subpial demyelination is typical of MS and is found rarely, if ever, in other inflammatory and neurodegenerative CNS conditions [37].
Postmortem MR examinations of MS brains have demonstrated an excellent retrospective sensitivity of ex vivo focal cortical lesion detection using T2*-weighted imaging at 7 T, validating preliminary in vivo findings [72]. In a study assessing the sensitivity of 3D T2*-weighted gradient-echo and 3D inversion recovery WM-attenuated (WHAT) turbo-field-echo (TFE) sequences at 7 T in formalin-fixed MS brain for detecting cortical demyelination, prospectively, 46 % of CLs were detected on T2*-weighted scans and 42 % on TFE images. These counts improved to 93 % and 82 %, respectively, with retrospective scoring, after comparison with histological sections. This technique has been also applied in vivo in eight MS patients and showed a high sensitivity in the detection of type I CLs [7].
In vivo data in a heterogeneous cohort of MS patients showed that the use of an optimized FLASH T2*-weighted sequence at 7 T MRI reveals about five to seven times the number of in vivo CLs than does DIR imaging at 3 T [64], which has so far been the best MR tool for identifying CLs in MS patients, although detection of subpial lesions is suboptimal with DIR. Neuropathology studies report that subpial lesions may extend across multiple adjacent gyri, a phenomenon termed “general subpial demyelination” [107]. In vivo observations with 7 T MRI revealed that in some MS cases, FLASH T2*-weighted magnitude images show, in addition to focal subpial lesions, band-like areas of signal hyperintensity that involve the outer cortical laminae and may extend over an entire gyrus or multiple gyri, resulting in extensive involvement of the cortex [57].
The in vivo quantification of “general subpial demyelination” in MS presents a technical challenge. Advances in the study of diffuse subpial pathology in vivo can be achieved by combining T2*-weighted acquisition at 7 T with a surface-based analysis of the cortex [22 and 23]. This type of analysis is based on the parametric reconstruction of the folded cortex from high-resolution anatomical scans, to identify the pial and WM/GM boundaries that define the cortical ribbon. It is then possible to selectively sample signal and contrast at various depths from the pial surface and measure changes in tissue across the cortical width, hemispheres, gyri, and sulci. The use of this analysis, by selectively sampling 7 T T2*-weighted signal at 50 % depth from pial surface, demonstrated, in patients with established and late MS, and distributed subpial T2*-weighted signal increases across the whole cortical mantle [22, 23], which may reflect the diffuse subpial pathology described in postmortem studies. While subpial T2*-weighted signal increases were disseminated throughout the cortex, the correlation between subpial T2* changes and WM lesions involved only a few cortical areas, suggesting that subpial pathology is largely independent of WM damage, as observed in ex vivo studies [9]. The surface-based analysis technique can be combined with quantitative indices of cortical tissue changes, including magnetization transfer (MT) imaging [26] and T2* relaxation decay [22, 23], to measure diffuse tissue abnormalities that are otherwise difficult to quantify using signal intensity measurements alone.
Ultrahigh-field MRI of cortical MS plaques can potentially provide useful information on the biophysical properties of such lesions. Correlations between histopathology and MRI of postmortem MS brains have evidenced hypointense rings on CLs identified on 7 T T2*-weighted magnitude images. These areas correlate pathologically with iron-laden microglia present at the edge of chronic active lesions [72].
Initial findings in a small patient dataset revealed that leukocortical lesions constitute the greatest fraction of MS cortical plaques with evidence of increased susceptibility effects on phase images [57], likely reflecting a greater degree of inflammation of this type of CL relative to subpial and intracortical types. Phase imaging at 7 T thus potentially represents a highly sensitive method for staging MS lesions by inflammatory activity in vivo. Using quantitative T2* 7 T MRI as a marker of demyelination and iron loss, spatial and tissue intrinsic characteristics of CL types, and structural integrity of perilesional normal-appearing cortical (NACGM) have been investigated [56]. In MS patients, T2* was higher in both ICL and LCL, indicating myelin and iron loss, than in NACGM irrespective of CL subtype and MS phenotype. Cortical damage expanded beyond visible CL, close to lesions in RRMS, and more diffusely in SPMS, suggesting that evaluation of NACGM integrity, beyond focal CL, could represent a surrogate marker of MS progression.
16.3.2.2 Quantitative and Metabolic MR Techniques
Despite being extremely sensitive in revealing WM lesions, conventional MRI lacks specificity to the heterogeneous pathological substrates of individual lesions, which include edema, inflammation, demyelination, remyelination, gliosis, and axonal loss. This contributes to explain why the magnitude of the correlation between WM lesion burden quantified on these sequences and the clinical manifestations of these conditions is still suboptimal. Quantitative MR-based techniques, including MT [89] and diffusion tensor (DT) [90] MRI, can quantify the extent and improve the characterization of the nature of structural changes occurring within and outside focal demyelinating lesions. Proton MR spectroscopy (1H-MRS) [95] can add information on the biochemical nature of such abnormalities.
Quantitative MR techniques allow grading the extent of intrinsic tissue damage of focal WM lesions of MS patients and to assess the involvement of the NAWM and GM. Variable degrees of MT ratio (MTR) reduction, abnormalities of diffusivity indexes, and modifications of metabolic profiles have been reported in acute and chronic MS lesions, with the most prominent abnormalities found in T1-hypointense lesions. Voxel-wise approaches have been applied to track longitudinal changes of damage in individual, newly-formed MS lesions, and to map the regional distribution of microscopic damage to the NAWM and GM on different MR sequences [35, 61]. A postmortem study reported the correlation between MTR values and focal cortical demyelination, supporting the notion that this technique is sensitive to demyelination/remyelination processes in the cortex [20]. Based on these findings, a reduced MTR of the outer surface of the cortex has been proposed as a measure of subpial demyelination. Such a reduction has been detected in MS patients with the main disease phenotypes, with the lowest values seen in SPMS [96].
Several studies with serial scanning showed that at least in some lesions dramatic changes in NAWM areas can be seen days to weeks before the development of enhancing lesions [35, 61]. A reduction of MTR and fractional anisotropy (FA) and an increase of mean diffusivity (MD) values have also been described in the NAWM and GM of MS patients, including those with CIS [35, 61]. Metabolite abnormalities, including reduced levels of N-acetylaspartate (NAA, a marker of axonal viability) and choline (Cho, a marker of membrane turnover), and increased levels of myoinositol (mI, a marker of gliosis) have been found in the NAWM, cortex [101], and subcortical GM tissue [21, 45] from MS patients. Structural and metabolic abnormalities are more severe in patients with the progressive clinical phenotypes, tend to worsen over time, and correlate with the severity of locomotor disability and cognitive impairment [35, 91–93]. In patients with relapse-onset MS, GM MTR was found to be an independent predictor of the accumulation of disability over the subsequent 13 years [34], and in primary progressive MS patients, the severity of GM damage predicted accumulation of disability over a five-year period [93].
Several approaches have been developed to investigate damage to selected WM tracts, with the ultimate goal of improving the correlation with clinical measures. These approaches include the use of DT tractography and the quantification of abnormalities at a voxel level, by means of voxel-based or tract-based spatial statistics (TBSS) analyses. In patients with CIS and definite MS, diffusivity measures of the corticospinal tract (CST) correlate with clinical measures of motor impairment [55, 68]. Using TBSS, FA [42] and radial diffusivity [85] abnormalities of the CC and CST have been related to clinical disability in RRMS patients. Diffusivity abnormalities in optic radiations have been related to transsynaptic degeneration secondary to optic nerve damage and Wallerian degeneration due to local lesions in a recent study in which patients were classified according to the presence of previous optic neuritis and lesions along these tracts [81]. TBSS studies [27, 88] have found a correlation of impaired attention, working memory, and speed of information processing with decreased FA in the CC and other tracts mainly connecting prefrontal cortical regions.
Advances in DT MRI and tractography have spurred the development of brain neuro-connectivity techniques, which define and quantify anatomical links between remote brain regions by axonal fiber pathways. The use of these approaches has revealed reduced network efficiency in the WM structural networks of MS patients [30, 102], including those at the earliest stages of the disease [118].
Ultrahigh-Field MRI
One of the most promising research applications at ultrahigh-field is MRS of brain metabolites with low concentrations (1–5 mM) that make their detection very challenging at lower field strengths [113]. Glutathione (GSH) is an indicator of oxidative status in the human brain. In vivo detection and quantification of GSH at 7 T has been performed using proton MR spectroscopic imaging (MRSI) with a spectral editing scheme called band selective inversion with gradient dephasing (BASING) [106]. The application of this MRS technique to MS patients has shown that cortical GM and WM lesions are characterized by a significant reduction of GSH concentration in comparison to healthy controls, hinting at the potential of GSH to probe brain oxidative status [106].
Increasing field strength also improves imaging and MRS of nuclei other than hydrogen, such as sodium (23Na) and phosphorus (31P) that have lower MR sensitivity [10]. 23Na yields the second-strongest nuclear magnetic resonance (NMR) signal among biologically relevant NMR-active nuclei. In most biological tissues, sodium is distributed in two compartments: extracellular (~ 140 mmol/L) and intracellular ([Na]in) (~ 15 mmol/L) [46]. The use of multiple-quantum filters (MQFs) is considered to be the best method for monitoring changes in intracellular sodium noninvasively in the human brain. A preliminary study of MS patients using a novel triple-quantum filtered 23Na MRI sequence at 7 T has shown an increase of whole brain intracellular Na concentration in MS patients when compared to healthy controls [38]. Recent studies have suggested that intra-axonal Na accumulation contributes to axonal degeneration by reversing the action of the sodium/calcium exchanger and thus inducing a lethal rise in intra-axonal calcium concentration [46]. Therefore, a noninvasive technique able to quantify intracellular sodium concentration in the brain may help in the understanding of mechanisms underlying axonal degeneration and may provide a marker of cellular viability. A recent 7 T study [70] quantified global and regional brain intra- and extracellular sodium concentration in 19 RRMS patients. Global GM and WM total sodium concentration and intracellular sodium concentration were higher in patients compared to controls, whereas GM and WM intracellular sodium volume fraction (indirect measures of extracellular sodium concentration) were lower. While intracellular sodium volume fraction decrease could reflect expansion of extracellular space due to tissue loss, intracellular sodium concentration increase could reflect neuro-axonal metabolic dysfunction.
Compounds with a high magnetic susceptibility, such as those containing iron, increase the local magnetic field. This provides a contrast mechanism which is more pronounced at ultrahigh fields. Using the phase of a gradient-recalled echo image and a newly developed post-processing technique, a recent MRI study enabled high-resolution quantitative imaging of local magnetic field shifts in patients with MS [43]. The phase images showed an increased local field in the caudate, putamen, and globus pallidus of patients relative to control subjects, with contrast in 74 % of WM lesions, and distinct peripheral rings in the larger lesions. This is consistent with the results of postmortem histological studies of MS showing pathological iron accumulation in both deep GM and WM plaques [54]. Increased magnetic susceptibility (reflecting increased iron concentration) has been recently found in the deep GM of CIS patients [3]. An in vivo contrast mechanism sensitive and specific to the presence of iron may help in understanding the role of iron in neurodegenerative pathology and in developing biomarkers for disease progression.
16.3.2.3 Functional MRI
Functional (f) MRI is a noninvasive technique which allows to study CNS function and to define abnormal patterns of activation and/or functional connectivity (FC) caused by injury or disease. The signal changes seen during fMRI studies depend on the blood oxygenation level-dependent (BOLD) mechanism, which, in turn, involves changes of the transverse magnetization relaxation time – either T2* in a gradient-echo sequence or T2 in spin-echo sequence. Local increases in neuronal activity result in a rise of blood flow and oxygen consumption. The increase of blood flow is greater than the oxygen consumption, thus determining an increased ratio between oxygenated and deoxygenated hemoglobin, which enhances the MRI signal [65]. By analyzing these data with appropriate statistical methods, it is possible to obtain information about the location and extent of activation as well as connectivity of specific areas involved in the performance of a given task in healthy subjects and in patients with different neurological conditions. Recently, a completely task-free approach, based on the assessment of functional correlations of neural networks at rest (resting-state [RS] fMRI), has been developed (for a review see [6, 29]).
Using both 1.5 and 3.0 T scanners, functional cortical abnormalities have been demonstrated consistently in all MS phenotypes using different active paradigms. The correlation found by the majority of these studies between measures of abnormal activations and quantitative MR metrics of disease burden suggests that, at least at some stages of the disease, functional reorganization might play an adaptive role which limits the clinical consequences of disease-related structural damage. The results of a cross-sectional study of the motor network in patients with different clinical MS phenotypes [78] support the notion of a “natural history” of brain adaptive mechanisms in MS. Such a study showed, at the beginning of the disease, an increased recruitment of those areas “normally” devoted to the performance of a motor task, such as the primary sensorimotor cortex and the supplementary motor area. At a later stage, a bilateral activation of these regions is seen, followed by a widespread recruitment of additional areas, which are usually recruited in normal people to perform novel/complex tasks. The preservation of a focused and strictly lateralized movement-associated pattern of cortical activations has been suggested as a possible mechanism to explain the favorable clinical outcome of patients with pediatric MS [76] and BMS [80].
There is also evidence supporting a maladaptive role of cortical functional abnormalities in MS. In patients with progressive MS [32, 77, 80], reduced activations of “classical” regions of the sensorimotor network and an increased recruitment of “high-order” regions, such as the superior temporal sulcus and the insula, have been found with motor tasks. In patients with cognitive decline, a “reallocation” of neuronal resources and an inefficiency of neuronal processes have been associated with the extent of structural damage.
The combination of measures of FC with measures of structural damage to specific WM tracts is likely to improve our understanding of the relationship between structural and functional abnormalities, as suggested by studies in patients with RRMS [79] and BMS [84].
The analysis of brain activity at rest has shown an increased synchronization of the majority of the resting-state networks (RSN) in patients with CIS [87] and a reduced activity of the anterior regions of the default-mode network in patients with progressive MS [11] and cognitive impairment [83]. Distributed abnormalities of RS FC within and between large-scale neuronal networks have been shown in RRMS patients and have been related to the extent of T2 lesions and severity of disability [75].
The increased magnetic susceptibility that comes with higher field magnets enhances the BOLD effect, and the higher SNR strengthens the signal. As a consequence, increased spatial resolution contributes to map additional areas and submillimeter structures. Although no study has been published to date on the use of fMRI at ultrahigh-field in MS patients, there is no doubt that future functional investigations will be performed at this field strength to study baseline circuitry and connectivity in the MS brain, as well as the mechanisms of neuronal plasticity and compensation related to the extent and location of brain injury.
16.4 Other White Matter Diseases
The use of MR systems at 3.0 T or higher is relatively new, and the literature on the use of higher-field MR scanners for the study of other white matter diseases is still not extensive, but it is growing and increasing. A number of different studies have been published both on 3 T and 7 T and even these equipment are increasing in number all over the world.
The improved clinical results with regard to morphological as well as functional and metabolic capabilities have led to a number of different studies both on 3 T, which sometimes can be performed routinely, and on 7 T, which can even be performed for comparison with both equipment.
From 2004 on, a number of studies have been done so far to assess white matter damage in diseases such as frontotemporal dementia [53], aging [47, 71], Alzheimer’s disease (AD) [44], and adrenoleukodystrophy [67] with 3.0 or 4.0 T MR scanners and evaluation of iron deposition in neurodegenerative and cerebrovascular disease at 7 T [25]. Other attempts have been done in order to distinguish between vascular occlusion and microinfarction vs demyelinating disease like in case of differential diagnosis at 7 T between Susac syndrome and MS [117]. This specific field of interest is developing quickly.
The assessment of white matter changes in neurodegenerative conditions is likely to bring insights into the understanding of white matter diseases where the presence of a neurodegenerative component is increasingly being accepted. Admittedly, normal aging is not a disease; however, work done with 1H-MRS at 4.0 T [47] and DT MRI at 3.0 T [71] might ultimately help understand some of the processes occurring in the pathological brain.
But also studies of anatomy and quantitative MRI have been proposed to better understand anatomic modification undergoing different pathologic conditions such as the presence of dilated perivascular spaces studied and quantified at 7 T [12] showing different patterns and quantification in case of stroke, dementia, AD, and mild cognitive impairment. A further attempt to comprehend degenerative disease has been done at 7 T in a postmortem evaluation with a study that tried to distinguish the spectrum of cerebral microinfarcts that presented with an intracortical and juxtacortical location [114] showing differences in acute and chronic lesions defined as chronic gliotic cerebral microinfarcts with or without cavitation an hemorrhagic components. This type of lesions is frequently in the intracortical as well as in the juxtacortical region, and the principal finding is the presence of dilated perivascular spaces. These findings can be confidently extended in vivo MRI in the context of aging and dementia.
Migraine CADASIL and neuromyelitis optica (NMO) are actually the principal field of focus of the majority of papers both on 3 and 7 T.
During the past few years, the application of advanced MR techniques for the assessment of patients with migraine has shown that, similarly to what has been described in other chronic vascular affections, including leukoaraiosis, cerebral autosomal dominant arteriopathy with subcortical infarcts and leukoencephalopathy (CADASIL), brain damage extends beyond the resolution of conventional imaging and diffusely involves the normal-appearing brain tissue (NABT). In a preliminary study using 1H-MRS at 3.0 T, we found that NAA is reduced in white matter lesions as well as in the NAWM of patients with migraine (Fig. 16.2). Concentrations of choline follow an opposite trend, with increased concentrations in the NAWM and lesions. Preliminary findings obtained with DT MRI at 3.0 T also suggest the presence of occult damage in the NABT of patients suffering from migraine. On the other hand, at 4 T glutamatergic abnormalities in the anterior cingulate cortex (ACC) and insula of patients with migraine [74] during their interictal period compared to healthy controls have been shown. This can be a contributing factor for migraineurs for a decrease in sensibility for migraine or a consequence of the chronic migraine status. Studies of volume-based morphometry (VBM) at 3 T [82] also demonstrated structural gray matter abnormalities with areas of reduced and increased density in migraine patients with T2 visible lesions.

