(1)
where Ã(r S) is the cumulated activity (total number of nuclear decays integrated over a time period measured from injection to infinity) of the source. This general equation for calculating the absorbed dose can be simplified using the Medical Internal Radiation Dose (MIRD) system, in which the dose to the target summed over all source regions is given by:

(2)
Additionally, to improve our understanding of the dose–response relationship, radiobiological information can be incorporated into TRT planning. This approach would allow us to better predict and account for radiation effects and toxicity. It is a well-established principle in EBRT that a given total dose, when delivered using different fractionation schemes, can result in different biological effects (Dale 1996). In radionuclide therapy, the absorbed dose rate depends on the amount and the type of the injected radionuclide. Furthermore, due to physical decay and biological elimination of the radiotracer, tissues are irradiated with a dose rate that decreases exponentially over time. The implications of these varying dose rates can be modeled using the biological effective dose (BED), which employs knowledge about radiosensitivity and repair rate for a given tissue type to predict total absorbed doses delivered at different dose rates.
Another relevant factor to consider is the spatial distribution of absorbed doses, which in TRT is typically more heterogeneous than in other forms of radiotherapy. Analogous to the BED model for comparing the effects of different dose rates, different spatial dose distributions can be compared using the equivalent uniform dose (EUD) (O’Donoghue 1999). As its name suggests, the EUD translates the heterogeneous 3D dose distribution into a uniform absorbed dose that would be expected to lead to the same biologic effects as the actual dose distribution.
4 Key Elements of Internal Dose Calculations
The procedure for performing patient-specific internal dose calculations can be broken down into several steps. First, a series of NM scans (planar and/or SPECT) must be acquired. Then, the planar and/or reconstructed SPECT images are analyzed to obtain volume and activity estimates of source regions of interest (ROI) inside the patient. Following this analysis, the cumulated activity in each ROI is determined and used to form the dose estimate. To complete each of these steps, dedicated software providing the necessary image analysis and dosimetry tools is required.
4.1 Imaging Protocol
A series of NM images are needed to identify source regions and to estimate cumulated activities in these regions. This is traditionally done using conjugate view analysis in which cumulated activities in source regions are estimated using a 2D imaging protocol (Matthay et al. 2001; Wiseman et al. 2003; Fisher et al. 2009). Simplified methods to correct for attenuation, scatter, and organ overlap in 2D images are then employed (Siegel et al. 1999). Using these approximate corrections, source activity data can be plotted versus time to generate the time–activity curve (TAC) for each of the regions and/or organs. Time-integrated activity coefficients are obtained through integration of the area under these TACs, divided by the injected activity.
The limitations of using a processing method based purely on planar studies have been explored, and large discrepancies between 2D and more advanced fully 3D approaches have been reported in simulations (He et al. 2008) and patient studies (Assie et al. 2008). These discrepancies can be attributed to the fact that in 2D studies it is impossible to properly compensate for organ overlap, attenuation, and scatter. Furthermore, dosimetry estimates based on 2D approaches usually do not consider patient-specific organ masses, instead using reference values based on the average patient. Given the inverse dependence of absorbed dose on mass, dose calculations that consider individual patient masses can vary considerably compared with calculations based on standard organ masses (Rajendran et al. 2004).
To increase the accuracy of cumulated activity estimates for different areas in the body, hybrid planar/SPECT techniques have been proposed (Koral et al. 1994, 2000). In this approach (Fig. 1), the temporal changes in radiotracer concentration, represented by the TAC, are determined from a coregistered series of 2D whole-body (WB) images acquired over several hours or even days after radiotracer injection. Additionally, a single SPECT or SPECT/CT scan is acquired over the main area of interest to provide quantitation for this activity. The data acquired with any standard hybrid SPECT/CT camera allows the user to compensate for attenuation, creating images representing the 3D semiquantitative distribution of the radiotracer in the body. However, to obtain truly quantitative images, corrections for other effects (most importantly scatter, dead-time, and partial-volume effects) must be implemented (Shcherbinin et al. 2011; Beauregard et al. 2011). The resulting quantitative SPECT-based absolute activity measures can then be applied to rescale the TACs to obtain absolute values of time-integrated activity coefficients that are necessary for dosimetry calculations. The hybrid planar/SPECT method has been shown to perform much better than a purely planar approach, providing nearly the same accuracy as a purely SPECT-based method for estimating residence times (He et al. 2008, 2009).
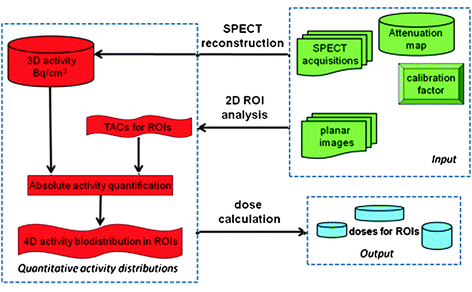

Fig. 1
Flowchart depicting general framework of hybrid planar/SPECT approach
The accuracy of the hybrid planar/SPECT technique makes it an attractive option for use as part of a practical dosimetry method for clinical use. In many clinics, a combination of planar and SPECT/CT scans are already acquired as part of the routine diagnostic procedure. There is a need for careful design of the imaging protocol to keep data acquisition acceptable for the patients and to limit the clinical burden in busy NM departments, while still acquiring all necessary temporal information.
4.2 Image Reconstruction
Although the filtered backprojection (FBP) algorithm is still extensively used in clinical studies, it does not reconstruct quantitative images. This is because FBP cannot accommodate any patient-specific quantitative corrections as it allows only for uniform attenuation correction with the Chang method. Therefore, for dosimetry calculations, more advanced iterative algorithms must be employed.
For advanced reconstruction of SPECT images, the maximum-likelihood expectation-maximization (MLEM), or its accelerated version, ordered-subsets expectation-maximization (OSEM) (Hudson and Larkin 1994), reconstruction algorithms are the most widely utilized. The iterative MLEM scheme can be presented as follows:

where  is the image value generated in the kth voxel at the nth iteration, Y i is the number of counts recorded in the ith pixel of the detector,
  is the number of counts in the ith pixel estimated in the projection of the image at the nth iteration, and C is the predetermined matrix formalizing the acquisition process for a particular imaging system (system matrix). In detail, the matrix element C ij corresponds to the probability that a photon emitted from the jth voxel is recorded in the ith pixel. A system matrix that accurately models acquisition allows for calculation of realistic projections of the image, P. Furthermore, the consistency between the experimental Y i and computed
  projections generally leads to improvement in the image estimate X (n), as the ratios
  are included in Eq. 3.

(3)
 is the image value generated in the kth voxel at the nth iteration, Y i is the number of counts recorded in the ith pixel of the detector,
  is the number of counts in the ith pixel estimated in the projection of the image at the nth iteration, and C is the predetermined matrix formalizing the acquisition process for a particular imaging system (system matrix). In detail, the matrix element C ij corresponds to the probability that a photon emitted from the jth voxel is recorded in the ith pixel. A system matrix that accurately models acquisition allows for calculation of realistic projections of the image, P. Furthermore, the consistency between the experimental Y i and computed
  projections generally leads to improvement in the image estimate X (n), as the ratios
  are included in Eq. 3.
To translate the reconstructed image X (n) to the distribution of activity expressed in absolute units (Bq or Ci), it must be multiplied by the camera sensitivity factor, which should be determined experimentally using a planar scan of a small point source.
The OSEM-based reconstructions that are currently used in clinics aim mostly at providing medical personnel with diagnostic rather than quantitatively accurate images. So, only a limited number of corrections for image-degrading factors (attenuation and, to some extent, detector response and scatter) are implemented into clinical OSEM algorithms. Therefore, in order to extract an absolute activity distribution from a standard SPECT scan, advanced data processing with more sophisticated corrections would be required. As recognized in the NM community (He et al. 2005; Du et al. 2006; Dewaraja et al. 2006; Ljungberg and Sjogreen-Gleisner 2011), attenuation correction, patient-specific modeling of scattered photons, and 3D resolution recovery must be incorporated. Additionally, the main photopeak photons for some radiotracers are accompanied by emissions of a different nature. Correspondingly, the acquired data are contaminated and additional corrections must be applied before reliable absolute quantification can be achieved; For example, when processing SPECT studies acquired with 123I and 131I, the collimator septal penetration of high-energy photons must be accounted for. For imaging therapeutic isotopes, such as 177Lu or 188Re, correction for the BRS component must be included into the reconstruction algorithm (Eq. 3).
Aiming to develop a quantitatively accurate, yet relatively simple and practical SPECT reconstruction, we pursue a “hybrid” tactic when adapting the standard OSEM reconstruction algorithm for dosimetry applications, with some corrections implemented directly into the system matrix and some included only in the projection step. First, we include a CT-based attenuation map and a 3D Gaussian model of the resolution loss into the system matrix C. Second, we acquire data in an additional energy window set above the main photopeak to estimate emissions corresponding to high-energy septal penetration and/or BRS. This simple approach allows us to avoid complex and time-consuming modeling of interactions of photons with the detector and collimator, and requires only minimal changes to the standard clinical protocols. Third, we accurately model the scatter component based on a standard clinical image and patient-specific CT-based density map (Vandervoort et al. 2005; Shcherbinin et al. 2008). Then, the combined corrections for scatter, BRS, and septal penetration are added in the denominator of Eq. 3 to the projections to get a more realistic estimate of P. Additionally, the final images obtained from this reconstruction can be corrected for the partial-volume effect (PVE) (Shcherbinin and Celler 2011).
To summarize, besides attenuation correction (which is now considered standard), we introduce additional corrections and build them into the reconstruction algorithm. Some of these corrections are based on measured rather than modeled data, in order to bypass time-consuming computations. However, the effects which may be critical for reconstructing the activity distribution in tumors (corrections for scatter and PVE) are modeled accurately.
Finally, injection of large therapeutic activities results in substantial dead-time and pulse pile-up effects in the camera. Furthermore, as count rates change during camera rotation (caused by different depths of tumors leading to different BRS components and attenuation effects), the dead-time may also vary. Therefore, if a therapeutic rather than diagnostic dose is injected, a dead-time correction (Beauregard et al. 2011; Koral et al. 1998; Delpon et al. 2002; Hobbs et al. 2010) must be performed. This correction should be determined from a time series of measurements of count-rate losses using phantom experiments containing insert(s) with high activities. The derived relationship between injected activity and detected counts is employed for correction of the reconstructed image.
4.3 Segmentation of Nuclear Medicine Images
The determination of total radiation absorbed dose in an ROI requires information about the activity accumulated in this region and its mass. Therefore, image segmentation is a crucial next step in the internal dose calculation process, as it is used to determine both region volume and activity. Since a CT scan is often acquired at the time of the SPECT acquisition, volumes of interest can be drawn manually on CT slices. Alternatively, organs and tumors may be segmented from SPECT images manually or by use of thresholds, which are defined as a percentage of the maximum number of counts inside a volume of interest. Use of thresholds ranging from 25% to 70% have been reported, while fixed thresholds set at around 40% of the maximum counts are most commonly employed (Erdi et al. 1995; Biehl et al. 2006). The problem with using a fixed threshold value is that the optimum threshold for volume determination depends on many factors such as the relative source-to-background activity, object size, and the reconstruction algorithm (Mut et al. 1988; Fleming and Alaamer 1998; Daisne et al. 2003). A more robust option is to use an adaptive threshold where the threshold value is calculated based on the source-to-background ratio (SBR), and different formulations with and without the need for a priori volume estimates from CT have been described (Daisne et al. 2003; Erdi et al. 1997).
To apply the adaptive threshold technique, a calibration phantom experiment must first be performed to obtain a threshold–SBR curve. This threshold–SBR curve relates the optimal threshold for segmentation of the object of interest to the measured SBR of that object. In the past, adaptive thresholds applied in this way have only been focused on exact volume estimates of organs and tumors. However, the total activity inside volumes segmented with this threshold will often underestimate the true activity because some activity will have spilled out of the object in the reconstructed image due to the partial-volume effect.
To correct for this problem, we recently proposed a modified adaptive threshold technique that utilizes two adaptive thresholds for each ROI (Grimes et al. 2011). The first threshold is employed in the standard way to estimate the volume of the object, while the second threshold is used to recover the true activity of the object.
A drawback of current adaptive threshold methods is that the background is typically defined using a manually selected region. This process can be tedious and may result in inconsistent results. To deal with this issue, we are currently working to further modify the adaptive threshold method so that the background is selected semi-automatically using an iterative approach.
4.4 Dose Calculation Method
Once the time-integrated activity coefficients for each ROI are determined, the corresponding dose distribution can be calculated. These calculations are most often performed using the OLINDA/EXM software, which calculates the total dose at the organ level (Stabin et al. 2005). Using OLINDA/EXM, the user inputs organ time-integrated activity coefficients and the program calculates the resulting absorbed dose for each organ, where the dose is assumed to be uniformly distributed throughout the organ volume. These doses are estimated based on the absorbed fractions calculated for standard phantoms representing the average male or female, so they are not patient specific. However, OLINDA/EXM allows the user to apply correction factors to account for individual patient organ masses. Tumor doses are approximated using precalculated absorbed fractions to unit-density spheres of different sizes filled with uniform activity.
More advanced methods, such as the MIRD voxel S value approach and different Monte Carlo-based techniques, provide much better accuracy, but are currently used mostly in research studies (Bolch et al. 1999). As both of these methods use patient-specific information in their dose calculations, they constitute an important step towards personalized dosimetry.
The voxel S value approach uses lookup tables for absorbed dose fractions in a target voxel due to radiation emitted from a single source voxel. Unlike OLINDA/EXM, this method considers activity distributions at the voxel level (rather than at the organ level), and calculates the corresponding voxelized dose distribution. The drawback of this technique is that the lookup tables are calculated for a source material of uniform density and do not account for tissue inhomogeneities. The advantage of using voxel S values is that calculations are simple and fast.
Monte Carlo techniques involve the simulation of radioactive emissions, which are propagated through the body, and a dose distribution at the voxel level is determined. As a result, the computational times that they require are often substantial. Reconstructed SPECT images provide quantitative information about the activity distribution, and CT data are used to account for patient-specific anatomy and tissue density distributions. Monte Carlo simulation is the most robust method for dose estimation, but its use may be quite complicated, and as mentioned, it suffers from the drawback of long computation times. An example Monte Carlo code commonly used for radiotherapy applications is EGSnrc, which is accompanied by the user code DOSXYZnrc (Strigari et al. 2006).
It should be noted that, when estimating dose distributions using voxel S values or one of the Monte Carlo programs, one does not need to segment images, as the entire activity and tissue density distributions are used in calculations. However, in order to extract the total or mean dose for an organ or an ROI, segmentation of the dose distribution would be required, and thresholding methods analogous to those used for estimating total organ activity from an image could be used.
4.5 Software Tools for Dosimetry Calculations
As the discussion presented in the previous sections indicates, image-based dosimetry calculations require processing of a large body of data. To organize this data and to perform each of the steps necessary for dose estimation requires the use of various software tools. Currently, there is a lack of a generally accepted program that would be able to assist the user through the entire dose calculation process. Most existing software packages (e.g., Gardin et al. 2003; Glatting et al. 2005; Visser et al. 2007; Loudos et al. 2009) have limited functions and either do not provide enough tools to perform all of the necessary steps from image analysis to determination of time-integrated activity coefficients, to calculation of final dose estimates, or contain only specific tools that do not give enough versatility to account for different dosimetry protocols used in different centers. The need for a comprehensive yet versatile software package is particularly acute in busy clinics with limited time and programming skills, where the existence of a single program that could perform all of these tasks would encourage clinicians to perform dosimetry calculations for each individual patient.
We have developed a prototype of such a program. Our graphical user interface (GUI) is programed in MATLAB and features a single software environment for performing all steps in the dose calculation process. In particular, it provides options for considering different acquisition protocols (only planar scans or only SPECT scans or a hybrid planar/SPECT protocol). Additionally, it allows the user to coregister a series of images, perform image segmentation, and finally calculate the doses using one of three different dosimetry methods (OLINDA/EXM, voxel S values, or Monte Carlo). A screenshot of one window from this GUI is provided in Fig. 2, which shows an example of how the SPECT data are analyzed.
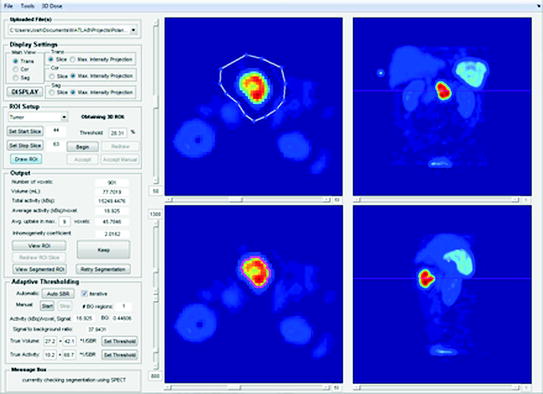

Fig. 2
GUI screenshot demonstrating how reconstructed SPECT images are analyzed. The user draws regions slice by slice in the top left window, with a choice of using a transaxial, coronal, or sagittal view. The remaining two views are displayed in the top right and bottom windows, which are used to check the slice position. The resulting segmented region (obtained, for example, by using the adaptive threshold method) is delineated in the lower left window
5 Clinical Implementation of the Proposed Dose Calculation Technique
As previously discussed, in order for patient-specific TRT treatment planning to be employed in routine clinical practice, a dose assessment technique that is simple and practical is needed. To address this need, we have implemented in our institution a patient-specific dose calculation approach that uses a hybrid planar/SPECT method combined with the adaptive thresholding technique for determination of volumes and activities in source regions of interest.
With the aim to optimize the parameters of different elements of the technique, the data from 45 patient studies were entered into this study, which was approved by the Ethics Review Board at our institution (Pomeranian Medical University). These 45 patients (23 males, 22 females) with median age of 57 years (range 7–78 years) were referred to our clinic for a diagnostic NET scan. Additionally, a number of phantom experiments were performed. These phantom experiments were used for normalization of the camera, calibration of the adaptive threshold technique, and investigation of BRS and camera dead-time effects.
5.1 Patient Image Acquisition
All patient scans were acquired using a dual-head Infinia Hawkeye 4 camera (GE Healthcare). For each patient, multiple (2–5) WB planar scans and one SPECT/CT scan were acquired over a period of 1–24 h following injection of 450–1,000 MBq of the somatostatin analog, 99mTc-HYNIC-Tyr3-octreotide (Tektrotyd, IAE POLATOM, Poland).
The following imaging protocol was used: The WB anterior and posterior views used 256 × 1,024 matrixes with pixel size of 2.21 mm and scan speed of 20 cm/min. For quality control in all planar studies, a small 99mTc point source (marker) was placed beside the patient within the field of view (FOV) of the camera. An example WB scan of a patient with a NET in the small bowel is provided in Fig. 3.
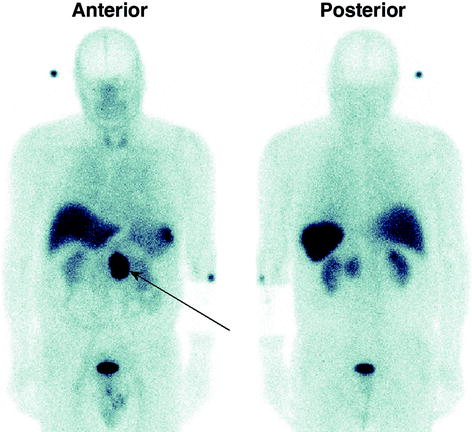

Fig. 3


Anterior and posterior views from a whole-body scan acquired at 2 h after injection, showing a neuroendocrine tumor in the small bowel
Stay updated, free articles. Join our Telegram channel

Full access? Get Clinical Tree


