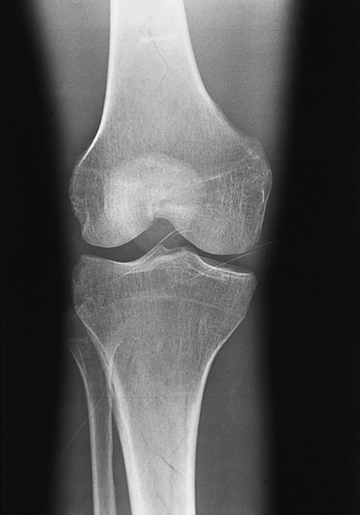
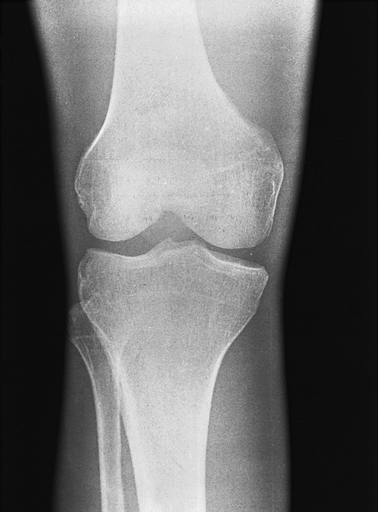
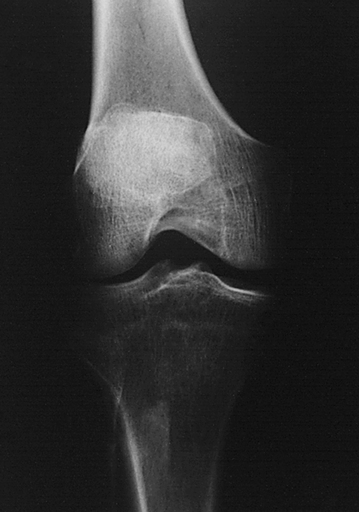
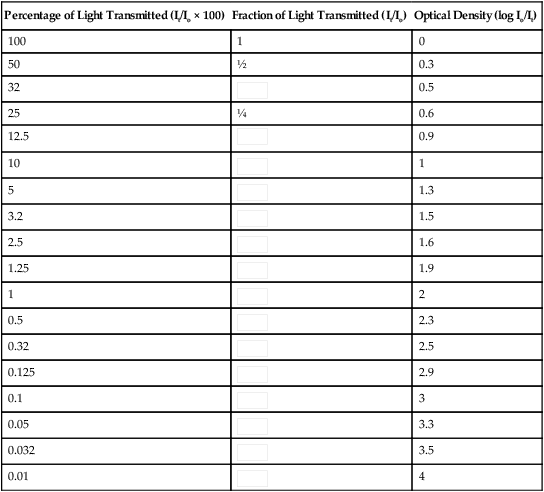
• Describe the necessary components of radiographic image quality. • Differentiate between the photographic and geometric properties of a radiograph. • Explain the importance of radiographic density to image quality. • Explain the importance of radiographic contrast to image quality. • Differentiate between high- and low-contrast radiographic images. • Describe sensitometry and explain the construction of sensitometric curves. • Differentiate among the film characteristics of speed, contrast, and latitude. • Compare the characteristics of different sensitometric curves. • Explain the evaluation of recorded detail in film-screen imaging. • Differentiate between size and shape distortion. • Explain the digital image characteristics matrix and pixels. • Compare the dynamic range between film-screen and digital imaging. • Discuss bit depth and its effect on digital image quality. • Compare the digital image characteristics brightness, contrast, and resolution to film-screen image quality. • Explain how adjusting the window level and window width affects digital image quality. • Recognize the effect of quantum noise and scatter on digital image quality. • Discuss the effects of image artifacts on radiographic quality. As stated in Chapter 8, radiographic images can be acquired from different types of image receptors (film-screen or digital). The process of creating the latent image by differential absorption is the same for both types of receptors, but the acquisition, processing, and display vary greatly. Because of the significant differences between film-screen and digital image receptors, image quality is discussed separately for film-screen and digital images. Information about the construction of image receptors and how the image is acquired, processed, and displayed is discussed in detail in subsequent chapters. The visibility of the anatomic structures and the accuracy of their structural lines recorded determine the overall quality of the radiographic image. For film-screen, visibility of the recorded detail refers to the photographic properties of the image and the geometric properties refer to how accurately the structural lines are recorded. The accuracy of the structural lines is achieved by maximizing the amount of recorded detail and minimizing the amount of distortion. Visibility of the recorded detail is achieved by the proper balance of radiographic density and radiographic contrast (Figure 9-1). Radiographic density is the amount of overall blackness produced on the processed image. A radiograph must have sufficient density to visualize the anatomic structures of interest (Figure 9-2). A radiograph that is too light has insufficient density to visualize the structures of the anatomic part (Figure 9-3). Conversely, a radiograph that is too dark has excessive density, and the anatomic part cannot be well visualized (Figure 9-4). The radiographer must evaluate the overall density on the image to determine whether it is sufficient to visualize the anatomic area of interest. He or she then decides whether the radiograph is diagnostic or unacceptable. If a radiograph is deemed unacceptable, the radiographer must determine what factors contributed to the density error. Knowledge about the factors that affect the density on a radiographic image is critical to developing effective problem-solving skills. The factors that affect the density of the image are discussed in Chapter 10, “Radiographic Exposure Technique.” This device is constructed to emit a constant intensity of light (incident) onto an area of the image and then measure the amount of light transmitted through the area (Figure 9-5). The densitometer determines the amount of light transmitted and calculates a measurement known as optical density (OD).Optical density is a numeric calculation that compares the intensity of light transmitted through an area on the film (It) with the amount of light originally striking (incident) the area (Io). The ratio of these intensities is called transmittance. Math Application 9-1 shows the mathematical formula used to calculate percent transmittance. Because the range of radiographic densities is large, the calculation of radiographic densities is compressed into a logarithmic scale (Table 9-1) for easier management. Notice the relationship between light transmittance and optical density (Table 9-1). When 100% of the light is transmitted, the optical density equals 0. When 50% of the light is transmitted, the optical density is equal to 0.3, and when 25% of the light is transmitted, the optical density equals 0.6. When a logarithmic scale base 10 is used, every 0.3 change in optical density corresponds to a change in the percentage of light transmitted by a factor of 2 (log10 of 2 = 0.3). TABLE 9-1 Percentage of Light Transmittance and Calculated Optical Densities Radiographic contrast is the degree of difference or ratio between adjacent densities. The ability to distinguish between densities enables differences in anatomic tissues to be visualized. An image that has a diagnostic density but no differences in densities appears as a homogeneous object (Figure 9-6). This appearance indicates that the absorption characteristics of the object are equal. When the absorption characteristics of an object differ, the image presents with varying densities (Figure 9-7). It is because of these density differences (i.e., radiographic contrast) that the anatomic tissues are easily differentiated. Tissues that attenuate the x-ray beam equally are more difficult to visualize because the densities are too similar to differentiate. Radiographic images are typically described by their scale of contrast or the range of densities visible. A radiograph with few densities but great differences among them is said to have high contrast. This is also described as short-scale contrast (Figure 9-8). A radiograph with a large number of densities but little differences among them is said to have low contrast. This is also described as long-scale contrast (Figure 9-9). Radiographic contrast is the combined result of multiple factors associated with the anatomic structure, quality of the radiation, and the capabilities of the film. Subject contrast refers to the absorption characteristics of the anatomic tissue radiographed along with the quality of the x-ray beam. Differences in tissue thickness, density, and effective atomic number contribute to subject contrast. For example, the chest is composed of tissues that vary greatly in x-ray lucency, such as the air-filled lungs, heart, and the bony thorax. This anatomic region creates high-subject contrast because the tissues attenuate the x-ray beam very differently (Figure 9-10). When the chest is imaged, great differences in densities are recorded for the varying tissues (Figure 9-11). The abdomen on the other hand, is composed of tissues that attenuate the x-ray beam similarly and therefore is considered to be a region of low-subject contrast (Figure 9-12). The densities representing the organs in the abdomen are more similar (Figure 9-13). It is therefore difficult to distinguish the stomach from the kidneys. As discussed in Chapter 8, the quality of the x-ray beam also affects its attenuation in tissues, which in turn alters subject contrast. Increasing the penetrating power of the x-ray beam decreases attenuation, reduces absorption, and increases x-ray transmission; as a result the density differences recorded in the radiographic image change. Figure 9-14 shows a chest radiographed using a low and a high penetrating x-ray beam.
Image Characteristics
Introduction
Film-Screen Characteristics
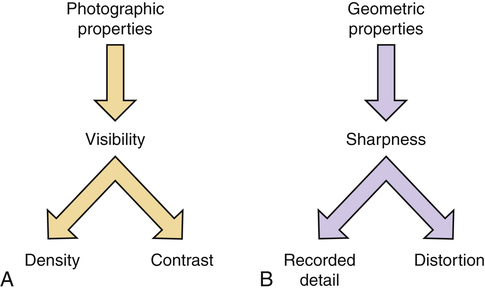
Factors affecting radiographic image quality. A, Photographic properties. B, Geometric properties.
Density
Radiograph with optimal density. (From Mosby’s instructional radiographic series: radiographic imaging, St Louis, 1998, Mosby.)
Radiograph with insufficient density. (From Mosby’s instructional radiographic series: radiographic imaging, St Louis, 1998, Mosby.)
Radiograph with excessive density. (From Fauber TL: Radiographic imaging and exposure, ed 3, St Louis, 2009, Mosby.)
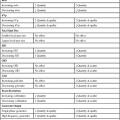
Optical Density
Percentage of Light Transmitted (It/Io × 100)
Fraction of Light Transmitted (It/Io)
Optical Density (log Io/It)
100
1
0
50
½
0.3
32

0.5
25
¼
0.6
12.5

0.9
10

1
5

1.3
3.2

1.5
2.5

1.6
1.25

1.9
1

2
0.5

2.3
0.32

2.5
0.125

2.9
0.1

3
0.05

3.3
0.032

3.5
0.01

4
Radiographic Contrast
Radiograph of a homogeneous object having no differences in density. (From Fauber TL: Radiographic imaging and exposure, ed 3, St Louis, 2009, Mosby.)
Object with different absorption characteristics produces an image with varying densities. (From Fauber TL: Radiographic imaging and exposure, ed 3, St Louis, 2009, Mosby.)
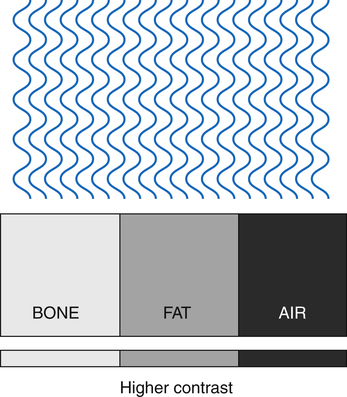
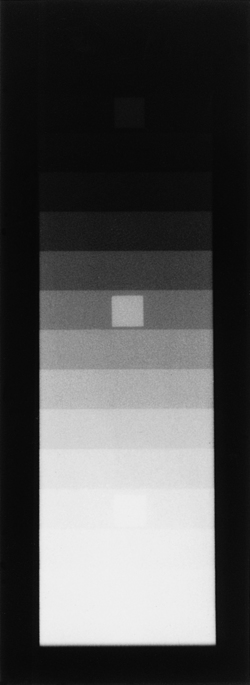
Higher contrast resulting from great differences in radiation absorption for tissues that have greater variation in composition.
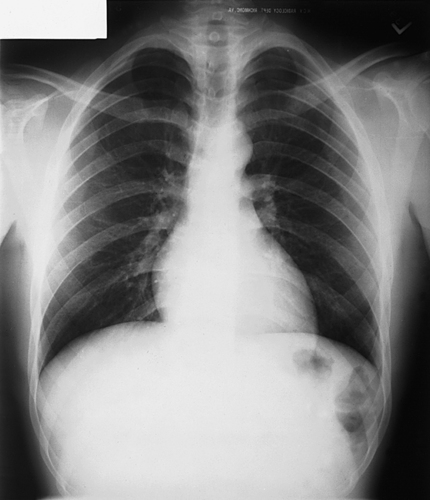
The chest is an area of high-subject contrast because there is great variation in tissue composition. (From Fauber TL: Radiographic imaging and exposure, ed 3, St Louis, 2009, Mosby.)
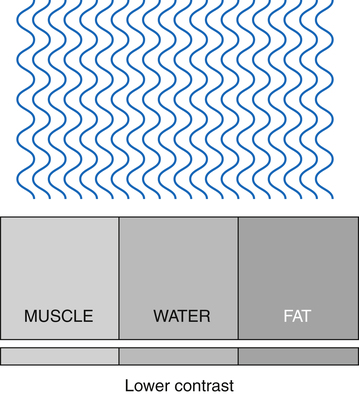
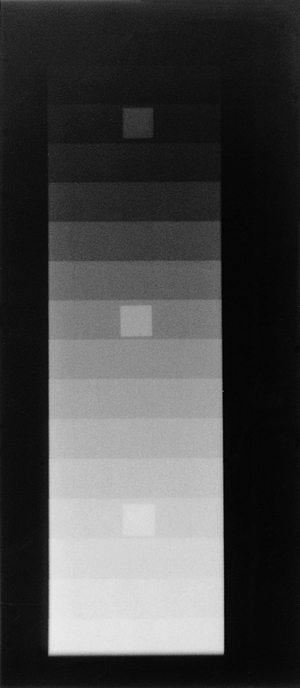
Lower contrast resulting from fewer differences in radiation absorption for tissues that are more similarly composed.
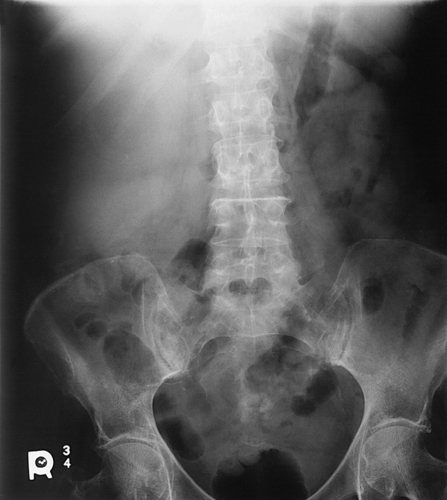
The abdomen is an area of low-subject contrast because it is made up of similar tissue types. (From Fauber TL: Radiographic imaging and exposure, ed 3, St Louis, 2009, Mosby.)
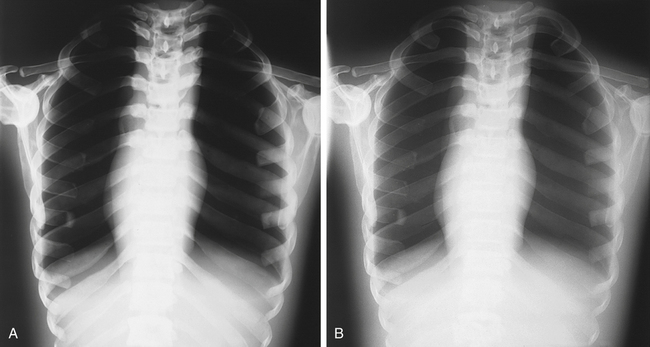
A, Low-kilovoltage radiograph of chest showing higher contrast than that in radiograph B. B, High-kilovoltage radiograph of chest showing lower contrast than that in radiograph A. (From Fauber TL: Radiographic imaging and exposure, ed 3, St Louis, 2009, Mosby.)
![]()
Stay updated, free articles. Join our Telegram channel

Full access? Get Clinical Tree


Image Characteristics
 Make the Physics Connection 9-1
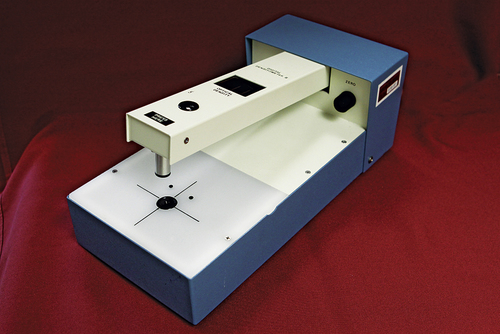
 Math Application 9-1
 Math Application 9-2
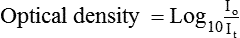
 Critical Concept 9-1
 Critical Concept 9-2
 Critical Concept 9-3
 Make the Physics Connection 9-2
 Critical Concept 9-4