7.2 The Biology of Angiogenesis
Tumour development and growth is dependent on development of new blood vessels to meet increasing demands for nutrient delivery and waste removal. This process of neovascularisation is called angiogenesis. The biology of angiogenesis is complex and continues to be a source of active research [2]. In tumour tissue, the process of angiogenesis is controlled by a number of angiogenic signalling mechanisms mediated by small molecules or cytokines. These may be released by tumour cells or by hypoxic or inflammatory tissue. Some knowledge of the angiogenic process is essential to understand the development of imaging-based biomarkers, and a brief, relatively simplified, description is presented here and illustrated in Fig. 7.2. Readers are referred to specific detailed reviews for further information regarding the biological processes involved in angiogenesis [2].
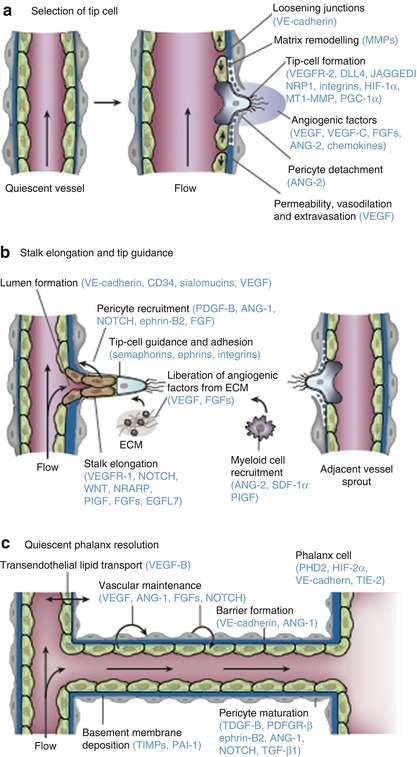

Fig. 7.2
The consecutive steps of blood vessel branching are shown, with the key molecular players involved denoted in parentheses. (a) After stimulation with angiogenic factors, the quiescent vessel dilates, and an endothelial cell tip cell is selected (DLL4 and JAGGED1) to ensure branch formation. Tip-cell formation requires degradation of the basement membrane, pericyte detachment and loosening of endothelial cell junctions. Increased permeability permits extravasation of plasma proteins (such as fibrinogen and fibronectin) to deposit a provisional matrix layer and proteases remodel pre-existing interstitial matrix, all enabling cell migration. For simplicity, only the basement membrane between endothelial cells and pericytes is depicted, but in reality, both pericytes and endothelial cells are embedded in this basement membrane. (b) Tip cells navigate in response to guidance signals (such as semaphorins and ephrins) and adhere to the extracellular matrix (mediated by integrins) to migrate. Stalk cells behind the tip cell proliferate, elongate and form a lumen, and sprouts fuse to establish a perfused neovessel. Proliferating stalk cells attract pericytes and deposit basement membranes to become stabilised. Recruited myeloid cells such as tumour-associated macrophages (TAMs) and TIE-2-expressing monocytes (TEMs) can produce pro-angiogenic factors or proteolytically liberate angiogenic growth factors from the ECM. (c) After fusion of neighbouring branches, lumen formation allows perfusion of the neovessel, which resumes quiescence by promoting a phalanx phenotype, re-establishment of junctions, deposition of basement membrane, maturation of pericytes and production of vascular maintenance signals. Other factors promote transendothelial lipid transport (From Carmeliet and Jain [2] with permission)
In healthy vessels endothelial cells (ECs) form a monolayer interconnected by junctional molecules, which include claudins and VE-cadherin. ECs are covered in a sheath of pericytes that actively suppress endothelial proliferation and which, together with EC, form a common basement membrane. Pericytes produce a range of signalling molecules including vascular endothelial growth factor (VEGF), angiopoetin-1 (ANG-1), fibroblast growth factors (FGFs), NOTCH and chemokines which support endothelial cell repair. EC can also respond directly to dissolved oxygen concentration and have receptors for hypoxia-inducible factors such as prolyl-hydroxylase domain 2 (PHD2) and hypoxia-inducible factor-2α (HIF-2α) which support a mechanism to enable remodelling of vessels to optimise oxygen delivery.
Under hypoxic and hypoglycaemic conditions, tumour cells will release pro-angiogenic signalling molecules including VEGF, ANG-2, FGFs and chemokines into the local microenvironment. When normal vessels are exposed to pro-angiogenic signals, pericytes detach from the basement membrane by the action of matrix metalloproteinases (MMPs), and tight junctions between endothelial cells loosen with increase in the permeability of the endothelial membrane. There is then extravasation of plasma proteins, which are involved in formation of an early extracellular matrix (ECM). Integrin signalling stimulates migration of EC onto this ECM, which in turn stimulates further release of pro-angiogenic signalling molecules. Growth of new vessels is an ordered process that involves a single EC, known as the tip cell. Neighbouring ECs, known as stalk cells, divide under the influence of NOTCH, placental growth factor (PlGF) and FGDFs to form an elongated vascular stalk that then develops a patent lumen in response to VEGF and a range of other signalling molecules. New vessels fuse with existing vasculature to initiate blood flow, and the new vessels develop pericyte coverage, reform EC tight junctions and develop new basement membranes.
7.3 Antiangiogenic Therapies
The development of imaging biomarkers to study the process of angiogenesis has been a major area of imaging research development. This was largely driven by the anticipation that antiangiogenic small molecules would provide an effective therapeutic intervention which, by targeting a common biological mechanism, would be effective across a range of cancer types. In practice, compared to initial expectations, therapeutic benefits of antiangiogenic agents have been rather disappointing [3]. Development of resistance to antiangiogenic therapy is relatively common [4], and some agents have proven toxic when combined with chemotherapy [5, 6]. Worryingly, some evidence is beginning to suggest that antiangiogenic therapy may cause cancer cells to become increasingly malignant in behaviour [7, 8]. Nonetheless, anti-VEGF targeting agents such as bevacizumab [9] have shown significant benefit and are licensed for use in a number of clinical settings (metastatic colorectal cancer, metastatic non-squamous non-small-cell lung cancer, glioblastoma (GBM) and metastatic renal cancer) although anti-VEGF agents are used as a monotherapy only in GBM. Agents which target the TKI pathways to block pro-angiogenic signalling have also been approved for use in a number of clinical applications [10] (Table7.1).
Table 7.1
Summary of phase II and III trials of anti-vascular agents
Drug | Approved indication | Improvement in RR (%) | Improvement in PFS (months) | Improvement in OS (months) |
|---|---|---|---|---|
Bevacizumab | Metastatic colorectal cancer (with chemotherapy) | 10 | 4.4 | 4.7a |
0 | 1.4 | 1.4a | ||
7.8 | 2.8 | 2.5a | ||
14.1 | 2.6 | 2.1b | ||
Metastatic non-squamous NSCLC (with chemotherapy) | 20 | 1.7 | 2.0a | |
10.3–14.0 | 0.4–0.6 | NRa | ||
Metastatic breast cancer (with chemotherapy)c | 15.7 | 5.9 | NSa | |
9–18 | 0.8–1.9 | NSa | ||
11.8–13.4 | 1.2–2.9 | NSa | ||
9.9 | 2.1 | NSb | ||
Recurrent GBM (monotherapy) | Currently only phase II data reported | |||
Metastatic RCC (with IFN-α) | 18 | 4.8 | NSa | |
12.4 | 3.3 | NSa | ||
Sunitinib | Metastatic RCC | 35 | 6.0 | 4.6a |
Sorafenib | Metastatic RCC | 8 | 2.7 | NSb |
Unresectable HCC | 1 | NS | 2.8a | |
2 | 1.4 | 2.3a | ||
Pazopanib | Metastatic RCC | 27 | 5.0 | NRa,b |
Although the initial hopes for antiangiogenic therapy have not been entirely fulfilled, enormous resource continues to be applied to the development of improved agents by increasing understanding of the modes of action, mechanisms of resistance and the principles that underlie the identification of optimised combination therapies [11–15]. Multiple mechanisms of resistance have been identified relating to changes occurring in tumour cells, EC or other cells in the tumour stroma. Some tumours, such as pancreas, are simply hypovascular by nature and therefore less sensitive to antiangiogenic strategies. Production of other pro-angiogenic signalling molecules can render tumours VEGF independent. Hypoxia in the native tumour or induced by vessel loss after antiangiogenic therapy can also promote mutations supporting development of hypoxia-resistant tumour cells and alternate pro-angiogenic mechanisms. Furthermore, there is some evidence, in GBM, that tumour stem cells can differentiate into EC via a process which is relatively insensitive to VEGF blockade [16].
7.4 Imaging Angiogenesis
Recognition of the importance of the angiogenic process led to substantial research efforts to identify tissue, soluble and imaging biomarkers that could be used clinically and in preclinical and clinical research. Imaging biomarkers have specific potential benefits that make them highly attractive. Quantitative imaging investigations can be performed non-invasively, can be repeated on a number of occasions to examine therapeutic responses and, most importantly, provide unique spatial data that allows investigation of heterogeneous tumour biology in vivo. In addition, the nature of antiangiogenic therapies and the sheer number of potential candidate compounds available made, and continue to make, the design of clinical outcome trials challenging. Development of panels of appropriate biomarkers to allow phenotypic classification, early response prediction and detection of biological activity in early, pre-phase 1, clinical trials became increasingly important.
Early development focused on the identification of biomarkers that quantified aspects of microvascular structure such as vascular fraction, endothelial permeability and blood flow. These biomarkers now have wide clinical application and are also routinely employed in clinical trials of antiangiogenic therapies. However, more recently there has been significant interest in developing biomarkers that target other aspects of the angiogenic process leading to the description of an increasingly wide range of PET-based molecular imaging agents.
7.4.1 Biomarkers of Perfusion and the Vascular Microenvironment
The technical details associated with the various imaging techniques are covered in considerable detail in earlier chapters. However, it is worth reviewing the characteristics and potential benefits of the quantitative imaging methods that now form an integral component of many or most antiangiogenic drug trials. Early approaches focused on the known histological features of angiogenic tissue. Classically, histochemical staining studies had identified the importance of the density of new vessels (microvascular density; MVD) measured on stained tissue. Although it is associated with a number of technical problems, MVD has been shown to relate to malignancy and outcome in a number of tumours and is routinely used in histological studies [17]. Many early imaging studies focused on identifying surrogate biomarkers of MVD mainly using dynamic contrast-enhanced MRI (DCE-MRI) with technical development commonly occurring in brain tumours due to favourable signal-to-noise characteristics and a lack of physiological motion. Most early studies used T2*-weighted acquisitions, often referred to as dynamic susceptibility contrast-enhanced MRI (DSCE-MRI), since susceptibility effects produce larger proportional signal changes in normal grey and white matter and, at that time, system architecture made rapid dynamic acquisitions with T2* weighting easier than T1 weighting. A proportional cerebral blood volume (rCBV) estimation is easily obtained from this data assuming that technical problems associated with contrast leakage are appropriately dealt with [18]. By scaling to normal white matter or pure vascular tissues (large veins), rCBV can be normalised to produce absolute values (CBV) which have shown close agreement with histological assessment of MVD in a number of cancer types and show similar correlations with tumour grade, aggressiveness and survival data [19–21].
Most early antiangiogenic agents targeted VEGF or VEGF signalling. Since VEGF produces rapid and significant increases in the permeability of the endothelial membrane, considerable work was directed towards the quantification of permeability by measurement of MR contrast agent leakage. Unfortunately, measurement of contrast agent leakage using T2* dynamic images is problematic, and the adoption of T1-weighted dynamic sequences, often referred to as dynamic relaxivity contrast-enhanced MRI (DRCE-MRI), received increasing attention. DRCE-MRI data can be acquired on most standard clinical MR imaging systems; however, dynamic signal intensity changes can vary between systems due to differences in acquisition sequence design, receiver gain settings and other technical variables. Early studies attempted to minimise these sources of variation by the use of simple, normalised, metrics such as the maximal rate of change of signal intensity or the ratio of pre- and post-contrast signal intensity. However, a desire for better standardisation across imaging systems and for greater physiological specificity led to the development and widespread application of pharmacokinetic analytical approaches [22]. Signal intensity changes are used together with direct measurements of baseline T1 values to calculate contrast concentration time course curves (CC-TCC). These can then be analysed using simple pharmacokinetic models to derive variables which have, in theory, both relative independence from variations resulting from differences in scanning equipment and sequence implementation and also offer increased physiological specificity. Most studies use a modified version of the original Toft’s pharmacokinetic model that produces estimates of vascular fraction (v p), extravascular extracellular space fraction (v e) and the transfer contrast coefficient (K trans ) [23, 24] (Fig. 7.3).
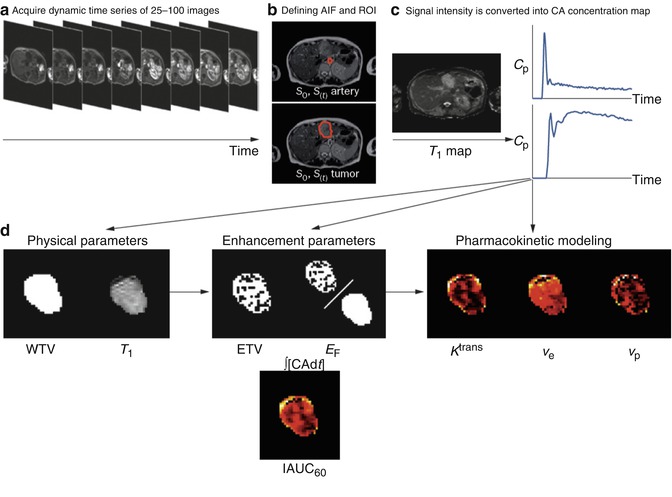

Fig. 7.3
DCE-MRI data acquisition and analysis. (a) Multiple images (typically 25–100) are acquired as a bolus of contrast agent passes through tissue capillaries; (b) the region of interest for a tumour and the feeding vessel arterial input function are defined; and (c) signal intensity values for each voxel are converted into contrast agent concentration using a map of T1 values. These steps allow calculation of (d) WTV and T1 values. Next, voxels are classified as enhancing or not after which parameters based on the amount and proportion of enhancement can be defined, along with the IAUC60. Finally, a pharmacokinetic model may be applied to derive parameters such as K trans. Abbreviations: ∫[CA]d t area under the contrast agent–time curve, AIF arterial input function, Cp contrast–agent concentration in plasma, CA contrast agent, DCE–MRI dynamic contrast-enhanced MRI, EF enhancing fraction, ETV enhancing tumour volume, IAUC 60 initial area under concentration agent–time curve at 60 s, K trans volume transfer constant between plasma and the extracellular extravascular leakage space, ROI region of interest, S signal, T 1 longitudinal relaxation time, v e volume of extracellular extravascular leakage space, v p blood plasma volume, WTV whole tumour volume (From O’Connor et al. [25] with permission)
Table 7.2 lists the parameters which can be extracted by the application of pharmacokinetic models and which are believed to be of value in clinical trials of novel therapies [26].
Table 7.2
Imaging biomarkers used in studies of anti-vascular agents
Parameter definition | Unit | Notes | |
|---|---|---|---|
Primary end points | |||
K trans | Volume transfer constant between plasma and the EES | min−1 | Composite measure of permeability, capillary surface area and flow |
IAUC60 | Initial area under concentration agent-time curve at 60 s | mmol min | Similar measure to K trans, but also influenced by v e |
Alternative functional biomarkers a | |||
k ep | Rate constant between EES and plasma | min−1 | NA |
v e | Volume of EES per unit volume of tissue | NA | NA |
v p | Blood plasma volume | NA | Relatively poor reproducibility |
F | Blood flow | ml/g min−1 | Temporal resolution achieved in most studies is too slow |
PS | Permeability surface area product per unit mass of tissue | ml/g min−1 | Temporal resolution achieved in most studies is too slow |
Alternative biophysical measurements b | |||
WTV | Whole tumor volume | mm3 | Easy to measure |
ETV | Enhancing tumor volume | mm3 | Easy to measure |
E F | Enhancing fraction (ETV: WTV ratio) | none | Easy to measure |
T1 | Longitudinal relaxation time | ms | Easy to measure |
The K trans value will be affected by blood flow and by the permeability surface area product of the endothelium (P.S). It rapidly became evident that the VEGF inhibition was indeed associated with rapid and profound reductions in K trans [25, 27, 28]. However, it must be noted that pharmacokinetic analyses have been far less popular in clinical practice where simple semi-quantitative metrics have become well established in many areas of oncology including prostate [29–31], breast [32–43], pancreatic [44], cervical [45], colonic [46] and rectal cancers [21, 47], bone sarcoma [48] and brain tumours [49, 50]. This clinical preference for semi-quantitative metrics reflects the complexity of pharmacokinetic analysis. The requirement to measure baseline T1 values and to identify a representative arterial input function (LIF) together with potential confusion concerning the choice of the most appropriate pharmacokinetic model make the use of semi-quantitative metrics far more attractive in a busy clinical environment. However, semi-quantitative metrics are capable of providing significant insight into the angiogenic status of tumour microvasculature which is, in most cases, comparable to pharmacokinetic parameters (Fig. 7.4).
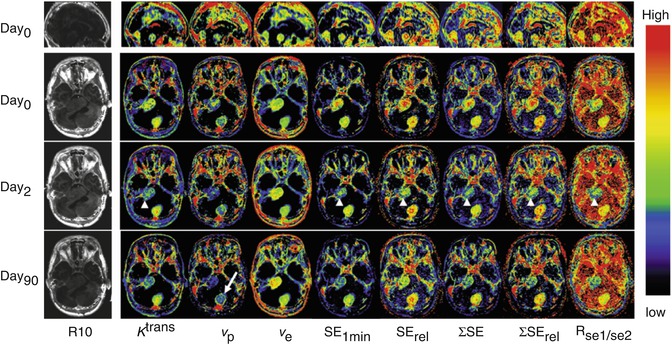

Fig. 7.4
Axial view of central slices of 3D longitudinally co-registered kinetic and semi-quantitative parametric maps obtained in 26-year-old woman, who has type II neurofibromatosis with a progressive VS (arrow heads) and an occipital located meningioma (arrow) undergoing treatment with bevacizumab. Images show comparisons of pharmacokinetic leak derived parameters K trans, v p and v e with semi-quantitative parameters (before and 2 and 90 days after the start of treatment): (1) absolute signal enhancement (SE 1min ), (2) relative signal enhancement (SE rel ) which uses a baseline value for normalisation in order to reduce the dependence on biological and imaging system variables, (3) the sum of SE over a fixed postinjection duration (SE), (4) the sum of SE rel over a fixed postinjection duration (SE rel ) and (5) signal enhancement ratio, commonly defined as the ratio of early to late contrast enhancement ratio, e.g. R se1/se2 = (SI1 min post − SIpre)/(SI5 min post − SIpre)
With the development of rapid multi-slice CT acquisitions, it was natural that the analytical approaches taken with DCE-MRI would be applied to CT data. Dynamic CT (DCT) has a number of potential advantages over MRI. The main one of these is that the concentration of contrast agent is directly linearly related to the measured attenuation value [51]. This makes measurements of semi-quantitative parameters and the application pharmacokinetic models more simple and alleviates many of the problems associated with multicentre studies in MRI (Fig. 7.5) [52–54].
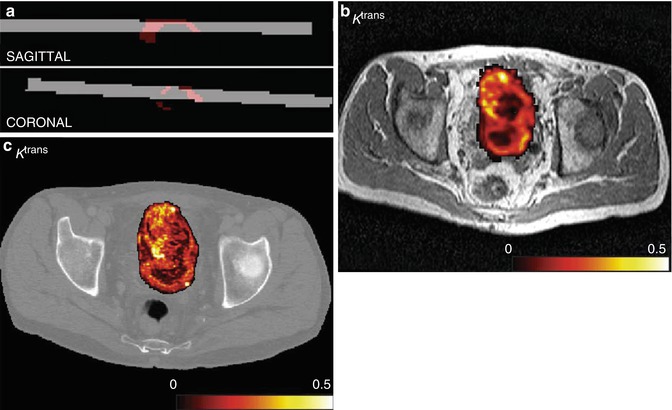


Fig. 7.5
(a) CT volume (grey) backtransformed into MR space and intersecting tumour ROI (red), sagittal and coronal views in a patient with bladder cancer. (b) Example of K trans map for DCE-MRI overlaid onto T2-weighted anatomical image after affine transformation to CT space. (c) Example of K trans map for DCE-CT at native resolution overlaid onto image from dynamic CT set. Colour scale in min−1. (d) Bland–Altman plots for the median values of K trans (in min−1), v p and v e (both unitless). The dashed lines indicate the mean difference, and the dotted lines indicate the limits of agreement (From Naish et al. [52] with permission)
The main problem with DCT is of course the radiation dose that is significant and limits the application of the technique into clinical trials requiring repeated imaging measurements.
The development of microbubble contrast agents led to the development of contrast-enhanced ultrasound (CEUS) which allows imaging of vessels with diameters of 50–100 μm using a combination of intravascular contrast and Doppler sonography. However, CEUS is limited by the presence of appropriate sonographic windows and is extremely operator dependent.
Although DRCE-MRI rapidly became an key component of many antiangiogenic studies, a number of other specific IB have been developed for angiogenesis. Some of these reflect recognition that novel antiangiogenic strategies may well not show changes in endothelial permeability but may affect other parts of the angiogenic process. One example of this is the recognition that antiangiogenic agents change the branching structure of the angiogenic vascular tree so that it more closely resembles normal vascular tissue [55]. This process, named normalisation, produces a change in the balance of vessel sizes within the tissue which can be detected by examining the differences in contrast-induced signal change on T2- and T2*-weighted images [56]. A number of studies used this approach to develop a vessel normalisation index which showed significant changes in response to tyrosine kinase inhibitors (Fig. 7.6) [57, 58].
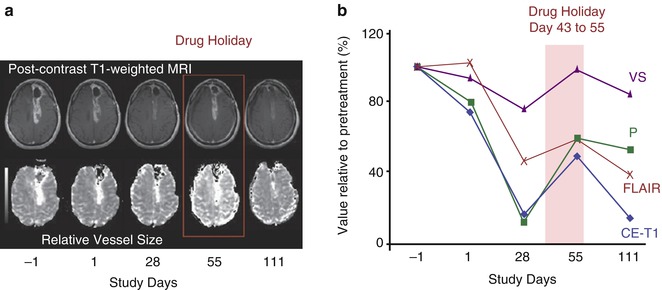

Fig. 7.6
Reversibility of normalisation: (a) vascular and volume changes as a function of time in a patient with glioblastoma multiforme who did not take drug from days 43–56 and was imaged on day 55 (shown as drug holiday). T1-weighted anatomic images after intravenous administration of gadolinium-DTPA. Note that at day 55, there is a rebound in tumour enhancement, which decreases again after restarting the drug as seen on follow-up imaging on day 110. In this patient, maps of relative vessel size also show fluctuation with the drug holiday and resumption of AZD2171 treatment. (b) Measurements of imaging parameters confirm the reversibility of vascular normalisation by drug interruption followed by renormalisation after AZD2171 is resumed. (VS vessel size, P endothelial permeability, CE–T1 contrast-enhanced T1-weighted sequence) (From Batchelor et al. [57] with permission)
Changes in vessel structure induced by antiangiogenic therapy can also be expected to produce changes in blood flow and blood flow velocity which can, in theory, be detected by arterial spin labelling. The ability to study antiangiogenic effects without the use of gadolinium-based contrast media is attractive, and a number of groups have examined the feasibility of ASL showing both treatment-induced changes and evidence that these changes can be used as early predictors of therapeutic response (Fig. 7.7) [60, 61].

