Fig. 1
(a) Terminology of nodular hepatocellular lesions. International Working Party. Hepatology 1995. DN = dysplastic nodule; well-moderately-poorly HCC = well-moderately-poorly differentiated hepatocellular carcinoma (HCC). (b) Change of intranodular blood supply on multistep carcinogenesis from regeneration to HCC. RN = regenerative nodule, low DN = low-grade dysplastic nodule, high DN = high-grade dysplastic nodule, well-diff. HCC = well-differentiated HCC, and moderately poorly diff. HCC = moderately or poorly differentiated HCC. Arterial supply is decreasing from RN to high-grade DN and is increasing from well-differentiated HCC to moderately and poorly differentiated HCC because of the proliferation of unpaired (abnormal) arteries, whereas portal supply is gradually decreasing from RN to moderately and poorly differentiated HCC
Microscopic invasion of stroma and portal tracts is important to differentiate HCC from DN [9]. On the multistep carcinogenesis, high-grade DN develops foci of malignancy [9]. Hypervascularity of HCC is a characteristic on imaging, because of progressive sinusoidal capillarization and unpaired artery on pathology [10, 11].
Modern CT Imaging of the Liver
In patients with a suspicion of HCC (such as rising alpha-fetoprotein and protein induced by vitamin K absence or antagonist-II levels), one of the best methods of diagnosis involves a CT scan of the liver using intravenous (IV) contrast agent and a four-phase scanning (unenhanced, arterial phase, portal-venous phase and equilibrium phase) to increase the ability of the diagnostic radiologists to detect small or subtle HCCs.
CT is now widely available and represents an important method for the diagnostics of liver lesions and planning of therapy. Dynamic MDCT with an intravenous bolus injection of contrast medium (CM) is essential to diagnose liver tumor [12, 13]. Diagnostic accuracy of the liver tumors has improved, because MDCT has higher spatial and temporal resolutions by the increase of both gantry rotation speed and the number of detector rows. But rapid scan speed with a MDCT scanner sometimes increases the difficulty to image hypervascular HCC during the arterial phase after CM injection. The optimal technique for IV injection of CM is very important to diagnose HCC. Therefore, we should know the optimal scanning protocol to start in the arterial phase after IV injection of CM.
The arterial phase imaging is useful to detect hypervascular HCC. On arterial phase of liver dynamic CT, there is a good correlation between tumor vascularity on CT and angiography. The portal-venous and equilibrium phases imaging are useful for the differential diagnosis of HCC, because the washout of CM from the tumor in these phases is a typical finding of hypervascular HCC (Fig. 2). On portal-venous and equilibrium phases, a minimum enhancement of 50 Hounsfield units (HU) should be achieved as adequate liver enhancement to obtain high conspicuity of low-attenuated hepatic lesions at the portal-venous and equilibrium phases [14–16].
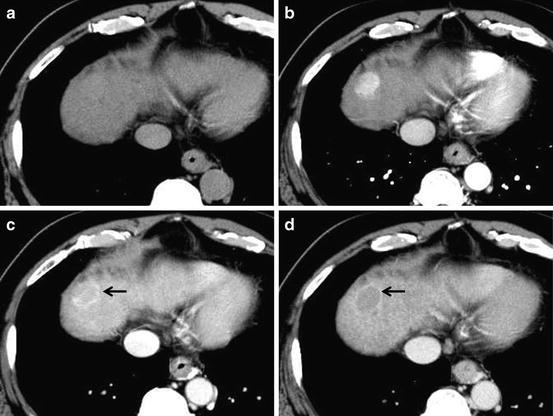
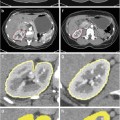
Fig. 2
Unenhanced CT (a), arterial phase (b), portal-venous phase (c), and equilibrium phase (d) of the CT show iso-density, hyper-density, washout with hyper-density ring (corona; arrow) enhancement, and washout with hyper-density capsule (arrow), respectively
However, arterial parenchyma enhancement due to arterioportal venous (AP) shunt may become a false-positive lesion (mimic HCC) on dynamic MDCT that evaluates hemodynamics of liver tumor, and it may sometimes reduce specificity. The finding of washout pattern is useful to distinguish non-tumorous AP shunt from hypervascular HCC, because AP shunt substantially showed no washout of the liver at the portal-venous and equilibrium phases. In other words, HCC shows both focal arterial enhancement and the corresponding washout in the portal and equilibrium phases, but AP shunt shows arterial enhancement alone and wedge-shaped appearance. However, the differentiation between HCC and AP shunt is sometimes difficult because some HCCs (especially small HCCs) do not demonstrate washout.
Scanning through the upper abdomen can be performed in less than 2–3 s by using state-of-the-art MDCT scanners with more than 64 channels, even though a spatial resolution of 0.6 mm is employed for both longitudinal and short axis of the body (transverse slice thickness), so-called isotropic voxel volume imaging. Three-dimensional (3D) images can be reconstructed from the isotropic voxel imaging data by using multiplanar reconstruction (MPR), volume rendering (VR) (Fig. 3), and maximum intensity projection techniques. These 3D images are useful for preoperative anatomical evaluation for surgeons and preoperative explanations for patients [17].
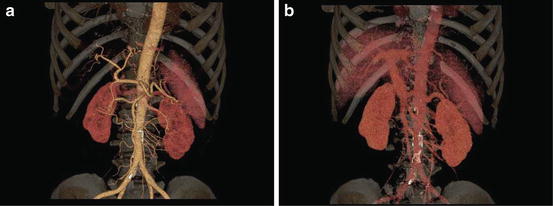
Fig. 3
(a) Volume rendering of hepatic arterial phase. Detailed depiction of hepatic arteries (right hepatic artery, left hepatic artery, proper hepatic artery, common hepatic artery) and superior mesenteric artery is obtained during early arterial phase by using CT angiography with intravenous injection of CM. (b) Volume rendering of portal-venous phase. Detailed depiction of portal vein system (portal vein, splenic vein, superior mesenteric vein) is obtained during portal-venous phase by using CT angiography with intravenous injection of CM
Scanning Protocol of Liver Dynamic CT to Detect Hepatocellular Carcinoma (Table 1)
Table 1
Optimal imaging parameters of liver dynamic CT for hypervascular HCC
Total volume and concentration of CM |
600 mgI/kg (i.e., 300 mgI/mL, 2 mL/kg) in patients with liver damage |
Injection duration of CM |
30 s |
Injection rate of CM |
Total volume of CM/30 s (i.e., 120 mL/30 s = 4 mL/s) |
Phases of liver dynamic CT |
Arterial phase of dynamic CT |
Fixed scan timing, approximately 40 s postinjection of CM |
Bolus tracking, approximately 20-s delay after achievement of 100-HU attenuation of the aorta |
Portal–venous phase of dynamic CT |
Fixed scan timing, approximately 70–90 s postinjection of CM |
Bolus tracking, approximately 30-s delay after arterial scanning |
Equilibrium phase of dynamic CT |
Fixed scan timing, approximately 180–300 s postinjection of CM |
A.
Four–phase liver dynamic CT.
Dynamic CT of the liver is performed by using bolus injection of iodine CM [18–20]. A four-phase (unenhanced CT, arterial phase, portal-venous phase, and equilibrium phase) examination protocol of liver dynamic CT should be employed for the diagnosis of HCC. By the use of different dynamic CT phases, good characterization of hepatic space-occupying lesions can be achieved.
B.
CM injection parameters in the liver dynamic CT.
It is important to optimize the parameters of the CT examination. There are several important technical factors for the injection of CM, such as volume and concentration of CM, injection rate, injection duration, body weight (BW), and scan delay time in the hepatic arterial phase. The volume and concentration of CM and the injection rate are directly related to maximum liver enhancement [21–24], whereas patients’ BWs are inversely related [25]. A rapid injection of CM is effective for the depiction of hypervascular HCC, when using the same volume and concentration of CM [26, 27]. The concentration and injection rate of CM are important for determining the amplitude of contrast enhancement in artery and hypervascular HCCs during arterial phase. And, the injection duration of CM is also important to predict peak enhancement time in the liver, because it may be the only factor to restrict temporal changes in contrast enhancement. When the alternative of injection rate or injection duration of CM is fixed, the other factor should be variable depending on the patients’ BW.
C.
Scan timing after CM injection for arterial, portal–venous, and equilibrium phases of dynamic CT.
The injection duration of CM is important to predict peak enhancement time in the liver, because the injection duration of CM is equal to the time of peak aortic enhancement after an arrival of CM to the abdominal aorta; in other words, it may be the only factor to restrict temporal changes in contrast enhancement. When injection duration of 30 s is employed, scanning is substantially made at arterial (approximately 40 s postinjection), portal-venous (approximately 70–90 s postinjection), and equilibrium phases (approximately 180–300 s postinjection) at whole liver containing the tumor. Ichikawa et al. stated that the peak enhancement time of the aorta, portal vein, and liver constantly appears approximately 10, 20, and 30 s after any fixed injection durations (completion of CM injection), respectively [28].
D.
Computer–assisted bolus-tracking technique.
It is important to predict the peak time of aortic enhancement to achieve optimal detection of HCC at the arterial phase for patients with hypervascular HCC, because blood is supplied to tumors from the hepatic artery (which is a branch of the abdominal aorta). The routine use of computer-assisted bolus-tracking techniques (i.e., SmartPrep®) for hepatic arterial phase scanning is recommended to detect hypervascular HCC [29], because the imaging by bolus-tracking technique is useful to catch the optimal scan timing during hepatic arterial phase in patients with severe cardiac dysfunction.
The scan delay for the arterial phase is about 20 s (i.e., optimal scan delay after a 30-s contrast injection of the hepatic arterial phase ranges from 5 to 10 s for the detection of hypervascular HCCs [30]) for the 16- or 64-MDCT scanner after achievement of 100-HU attenuation of the descending aorta measured with bolus-tracking technique. A certain scan delay after arterial phase acquisition was used for the portal-venous phase acquisition (optimal scan delay after a 30 s contrast injection of the portal venous phase is 35 s after the completion of contrast injection or somewhat longer [30]).
E.
Body weight (BW)-tailored dose (volume x concentration of CM).
To achieve adequate liver enhancement for all patients with a wide variety of BW on CT, recent clinical studies have suggested that the dose of CM should be tailored according to patients’ BWs, because a fixed dose of CM does not allow the same effects for the contrast enhancement of liver in patients with different BWs [31–33]. The variation in liver enhancement among patients with different BWs is cancelled by using the BW-tailored dose of CM [31]. When a tailored dose of CM according to patients’ BW is injected in the liver CT, a fixed injection duration method allows the minimization of the variation in aortic peak enhancement time for each patient [28, 34]. In patients with lighter BW, the injection rate can be reduced without reducing the degree of enhancement in the liver [31]. For the liver dynamic CT, 600 mgI/mL of CM is recommended [35].
American Association for the Study of Liver Diseases
The diagnostic algorithm for suspected HCC by the AASLD guideline states that an imaging diagnosis of HCC should be made if a lesion larger than 1 cm shows a typical vascular enhancement pattern on a single dynamic imaging study (Fig. 4) [36]. For hepatic nodules smaller than 1 cm, repeated sonography at 3 months is recommended to investigate the nodular size. Four-phase MDCT and dynamic contrast-enhanced MRI are recommended in this algorithm as imaging modalities to detect arterial hypervascularity and washout at portal-venous and/or equilibrium phase for hepatic nodules larger than 1 cm. Therefore, confirmation of arterial enhancement and the corresponding washout in the portal and equilibrium phases on dynamic CT is important to diagnose HCC after sonographic detection of hepatic nodule on the screening program. A biopsy is not needed to confirm the diagnosis of HCC if certain imaging criteria are met. When typical findings of HCC, such as arterial hypervascularity and washout at portal-venous and/or equilibrium phase on liver dynamic CT, could not be obtained, other contrast-enhanced imagings or biopsy of hepatic nodules are recommended.
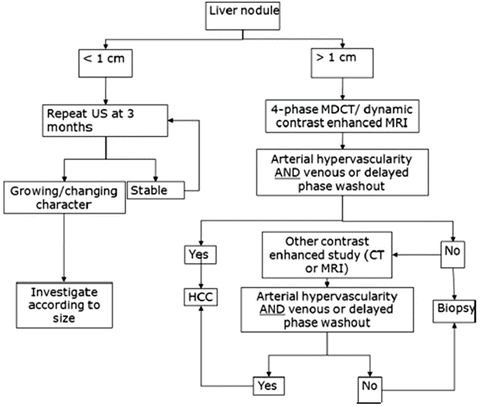
Fig. 4
American Association for the Study of Liver Diseases (AASLD) guideline
Classification of Nodules in Multistep Hepatocarcinogenesis
1.
Regenerative nodule (RN).
Regenerative nodules (RNs) represent a region of parenchyma enlarged in response to necrosis, altered circulation, or other stimuli. In chronic hepatitis B, macronodular hepatic nodules (>3 mm in diameter) are substantially seen, although micronodular nodules (<3 mm in diameter) are seen in other causes of cirrhosis. When RNs contain iron, they are substantially hyperattenuation or isoattenuation to the liver on unenhanced CT. Most RNs are difficult to depict on enhanced CT, because they show similar enhancement pattern compared to the surrounding liver parenchyma [37], but RNs may show early enhancement in comparison to or less than the surrounding liver [38]. And on the equilibrium phase, RN may show multiple hypoattenuation nodules which are separated by hyperenhancing fibrous tissue in the liver.
2.
Dysplastic nodule (DN).
Dysplastic nodules (DNs) are subclassified on the basis of cellular abnormalities, such as low-grade DN, containing hepatocytes with mild atypia, and high-grade DN, containing hepatocytes with moderate atypia, but insufficient for the diagnosis of malignancy. Low-grade DNs are difficult to distinguish histologically from RNs [9]. High-grade DN is most likely to progress to HCC than is low-grade DN. High-grade DN has pathologic features of increased cell density of this lesion, mild thickened cell plates, and foci of increased cell proliferation. The differentiation between high-grade DN and well-differentiated HCC in the liver cirrhosis can be difficult, because of overlap on imaging. However, rapid interval growth is one of the criteria of malignancy on imaging. DNs containing foci of HCC are considered to be premalignant lesions.
DNs may be detected as hypoattenuation in the arterial and/or portal-venous phase, because of normal or slightly decreased portal-venous supply to the DNs (Fig. 5), although DNs are not seen on imaging as frequently [39]. DNs are usually isoattenuation to the surrounding liver [40]. Lim et al. stated that helical dynamic triple-phase CT including arterial, portal-venous, and delayed phases depicted 14 % of high-grade DNs and 7 % of low-grade DNs [41].
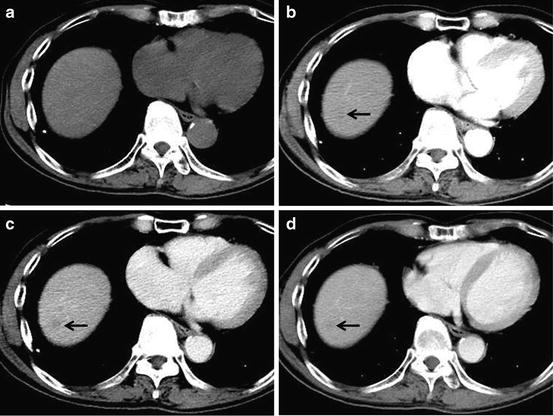
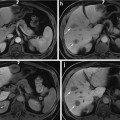
Fig. 5
Low-grade dysplastic nodule. Unenhanced CT (a), arterial phase (b), portal-venous phase (c), and equilibrium phase (d) of the CT show iso-density, hypodensity (arrow), washout with hypodensity (arrow), and washout with hypodensity (arrow), respectively
3.
Hepatocellular carcinoma (HCC).
MDCT provides detailed information about tumor vascularization and can also help differentiate its pathological grade noninvasively.
(a)
Early hepatocellular carcinoma (early HCC).
Tumor cells of early HCC grow in a replacing fashion. And portal tracts may be present in these lesions. The invasion into intralesional portal tracts is seen, and this invasion is called as “stromal invasion.” And early HCC does not show distal metastasis. Decrease or disappearance of ductular reaction is important to differentiate early HCC from fibrosis with chronic hepatitis [42]. Stromal invasion of early HCC has the active matrix metalloproteinase-1 (MMP-1) [43].
Early detection of early HCC may permit effective treatment and achieve long-term cure, although the natural history of early HCC is not well known. Treatment of early-stage HCC is potentially curative therapy with 5-year survival rates of 50–70 % [44, 45]. Early HCC substantially shows hypovascular tumor and slightly washout on liver dynamic CT (Fig. 6).
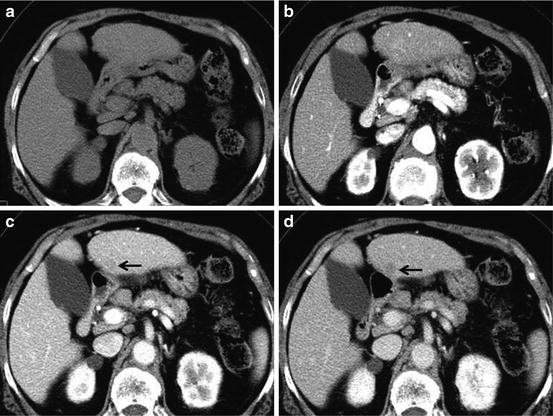
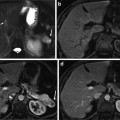
Fig. 6
Early HCC. Unenhanced CT (a), arterial phase (b), portal-venous phase (c), and equilibrium phase (d) of the CT show iso-density, iso-density, washout with hypodensity (arrow) and washout with hypodensity (arrow), respectively
It may be difficult to differentiate early HCC from other benign lesions, such as RN and DN. US-assisted biopsy of the lesion can be used to differentiate neoplastic lesions from non-neoplastic lesions.
(b)
Well-differentiated hepatocellular carcinoma (well-differentiated HCC).
On pathology, microscopic invasion of stroma and portal tracts is the primary diagnostic feature to differentiate well-differentiated HCC from DNs [46]. The diagnosis of well-differentiated HCC can be difficult, commonly requiring examination by several imaging modalities [47, 48]. Well-differentiated HCC has relatively low malignant potential and rarely invades vessels or metastasis to other sites [49]. Fatty changes of tumor tissue were occasionally observed (Fig. 7). Minimal enhancement of the tumor is substantially seen in well-differentiated HCC. Even though HCC is usually considered to be a hypervascular tumor, well-differentiated tumors can be hypovascular tumor.
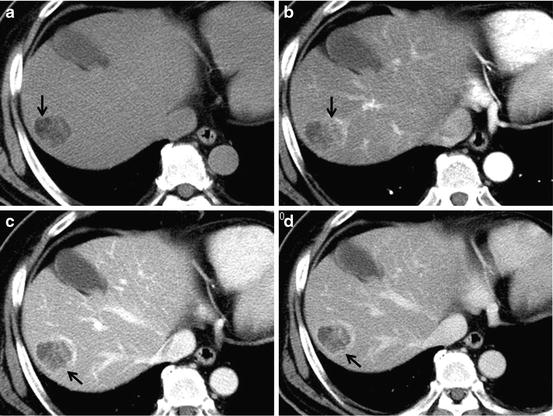
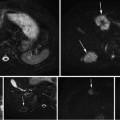
Fig. 7
Well-differentiated HCC. Unenhanced CT (a), arterial phase (b), portal-venous phase (c), and equilibrium phase (d) of the CT show hypodensity with fat deposit (arrow), hyper-density (arterial enhancement; arrow) with hypodensity (fat component), washout with ring enhancement (capsule; arrow) and washout with ring enhancement (capsule; arrow), respectively
(c)
Moderately differentiated hepatocellular carcinoma (moderately differentiated HCC).
Dynamic CT substantially reveals a basket pattern which means hypervascularity of moderately differentiated HCCs (Fig. 8). A peak of enhancement is usually seen at the arterial phase followed by a rapid decrease of enhancement at the portal-venous and equilibrium phases, because moderately differentiated HCC has greater arterial blood supply. Lesions larger than 3 cm are often heterogeneous, with mosaic or mixed pattern arising from intratumoral necrosis, hemorrhage, fatty deposit, and interstitial fibrosis. The appearance of HCC on CT depends on tumor size and histologic tumor grades.
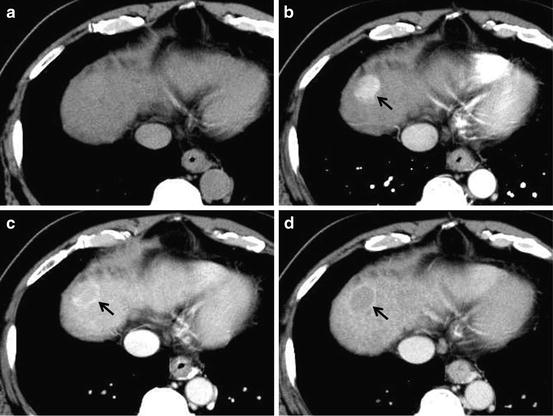
Fig. 8
Moderately differentiated HCC. Unenhanced CT (a), arterial phase (b), portal-venous phase (c), and equilibrium phase (d) of the CT show iso-density, hyper-density (arterial enhancement; arrow), slight washout with ring enhancement (capsule; arrow) and clear washout with ring enhancement (capsule; arrow), respectively
(d)
Poorly differentiated hepatocellular carcinoma (poorly differentiated HCC).
In poorly differentiated HCC, gradually increasing enhancement over time is substantially seen (Fig. 9). Asayama et al. state that the arterial blood supply of poorly differentiated HCC is lower than that of moderately differentiated HCC by CT during hepatic angiography. Therefore, the arterial blood supply decreases as the histologic grade progresses in the late stage of HCC development. The enhancement of poorly differentiated HCC shows greater arterial vascularization than that of well-differentiated HCC. The presence of arterial hypervascularization of the poorly differentiated HCCs and some of the moderately differentiated HCCs indicates that lesions with this contrast enhancement pattern are most likely an advanced-to-late stage.
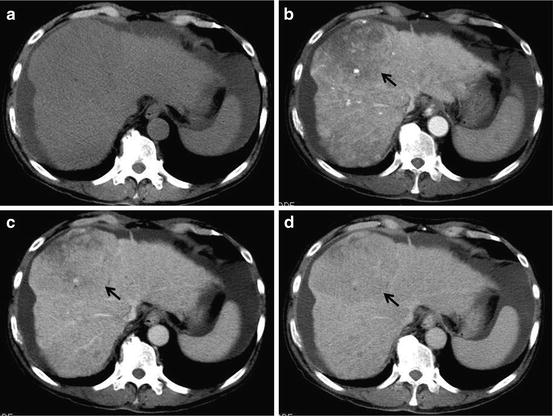
Fig. 9
Poorly differentiated HCC. Unenhanced CT (a), arterial phase (b), portal-venous phase (c), and equilibrium phase (d) of the CT show almost iso-density, indistinct hypodensity (hypovascular enhancement; arrow), washout (arrow) without ring enhancement and washout (arrow) without ring enhancement, respectively. Ascites is seen at the subphrenic space
Cirrhosis
CT Features of Liver Cirrhosis
Liver cirrhosis (LC) is one of the most important factors in hepatocarcinogenesis. Liver cirrhosis demonstrates less contrast enhancement of the liver than normal liver and sometimes shows inhomogeneous enhancement because of regeneration, fibrosis, and the altered portal-venous flow (Fig. 10). In addition, collateral vessels, such as paraumbilical vein, splenorenal shunt, and esophageal varices, are seen due to portal hypertension. Ascites is also seen in patients with liver cirrhosis.
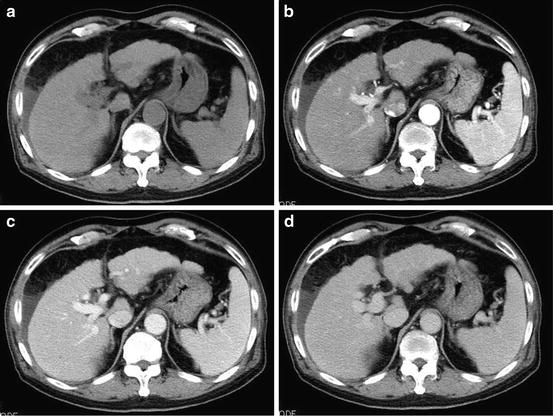
Fig. 10
Liver cirrhosis. Unenhanced CT (a), arterial phase (b), portal-venous phase (c), and equilibrium phase (d) of the CT show peripheral irregularity of the liver, splenomegaly, and ascites at the subphrenic space. No tumor is seen in the liver
MDCT Findings of Hepatocellular Carcinoma
The CT appearance of HCC depends on tumor size and histologic grade. Small HCC is defined as nodules smaller than 2–3 cm in size, whereas lesions larger than 3 cm in size are often heterogeneous with a mosaic or mixed pattern arising from a necrosis, fibrosis, fatty degeneration, and hemorrhage [50].
A characteristic enhancement pattern consisting of hyperenhancement in the arterial phase and washout in the portal-venous or equilibrium phase is associated with high specificity (nearly 100 %) for the diagnosis of HCC. But dynamic CT with extracellular CM has some diagnostic limitations related to tumor size. Hepatic nodules larger than 1 cm in diameter show high accuracy of hypervascular HCCs in a cirrhotic liver, although it is difficult to diagnose subcentimeter HCCs [36]. Therefore, the confirmation by biopsy is sometimes required for questionable hepatic nodules to determine the diagnosis. Thus, the key characteristics of HCC on CT are hypervascularity in the arterial phase scans, washout in the portal and equilibrium phase studies, a pseudocapsule, and a mosaic pattern. Both calcifications and intralesional fat may be appreciated.
There is insufficient diagnostic performance for the early detection of both small and early HCCs even with state-of-the-art CT. Gadoxetic acid disodium (gadolinium ethoxybenzyl diethylenetriaminepentaacetic acid, Gd-EOB-DTPA; PRIMOVISTⓇ Bayer Schering Pharma AG, Berlin, Germany) is a hepatocyte-specific MR contrast agent. Gd-EOB-DTPA-enhanced MRI is a promising examination to diagnose small HCC [51] and depicts early HCCs, such as well-differentiated HCC, in the early stage of hepatocarcinogenesis, because Gd-EOB-DTPA has the properties of an extracellular gadolinium chelate, as well as being a hepatocyte-targeting agent. Gd-EOB-DTPA-enhanced MRI enables hepatocyte-phase imaging to start 10–20 min postinjection. Therefore, additional dynamic imaging modality, such as Gd-EOB-DTPA-enhanced MRI, is recommended, when liver dynamic CT shows indeterminable result in the diagnostic process of HCCs [36].
Characteristic Features of Hepatocellular Carcinoma on Dynamic CT
Related posts:
Stay updated, free articles. Join our Telegram channel

Full access? Get Clinical Tree


