Fig. 10.1
MRI (left), MWF (middle) and Luxol fast blue myelin stain of post-mortem tissue (right) (figure from Laule et al. 2006)
The number of myelin water imaging studies of patients is small, as the specialized acquisition and analysis required to calculate myelin water maps are not routinely available on commercial scanners and must be implemented locally.
In cross-sectional studies of patients with MS, the MWF and the mean of the T2 relaxation time distribution (<T2>) are significantly altered in lesions and the normal-appearing white matter (Laule et al. 2004; Vavasour et al. 1998; Whittall et al. 2002). The MWF changes are mainly due to myelin loss, as confirmed by pathology studies using LFB (Moore et al. 2000), whereas increases in T2 of the intermediate component (and by extension, <T2>) have been proposed as a marker of inflammation and oedema (Stanisz et al. 2004; Webb et al. 2003). In a study of MS lesions, myelin water imaging did not show the expected differences in myelin water content between T1-hypointense and T1-isointense lesions (Vavasour et al. 2007).
Serial studies of the evolution of changes in the MWF of MS lesions and NAWM are extremely limited. Levesque et al. (2008) found the MWF in lesions to be abnormal but too variable to show the trends over time expected in association with the acute demyelination and remyelination in Gd-enhancing lesions. In two patients with MS, Vavasour et al. (2009) found changes in MWF consistent with remyelination in two lesions, one of which showed evidence of recovery over time and one of which did not.
10.2.2.2 MWF Advantages and Disadvantages
An important advantage of MW imaging is that it provides theoretical specificity for myelin. Quantitatively, unmyelinated tissue shows a logical MWF of zero, and in post-mortem MS brains, the correlation between MWF and LFB was moderately strong (R2 = 0.67) (Laule et al. 2006).
Disadvantages of MW imaging include the fact that the acquisitions are long, having a typical scan time of approximately 25 min for a single slice, and require custom acquisition and analysis software not provided on commercial scanners. Another general issue with MW imaging is that the signal to noise ratio of the data is low and the conversion of the multi-echo data to produce a spectrum of T2 values, usually performed using a non-negative least squares (NNLS) technique, is underdetermined. Typically, 32 data points (echoes) are processed to produce estimates of the relative amount of water at 120 T2 times. This can result in unstable fits, and therefore data smoothing (regularization) is required. This, coupled with the relatively course sampling of echo times (TE spacing of 10 ms) in the range of MW, makes the reliable estimation of the MWF in vivo difficult (Laule et al. 2004). In fact, much of the ex vivo experimental work that established the multi-exponential nature of white matter relaxation utilized thousands of very closely spaced echoes (Menon et al. 1992 ). Other potential complications are that MW imaging may not distinguish intact myelin and myelin debris (Webb et al. 2003) and that changes in the rate of exchange of water between compartments can alter the apparent MWF (Levesque et al. 2006). The latter phenomenon may underlie the fact that MWF can vary by a factor of two in regions with the same myelin content but different microanatomy of myelin (Dula et al. 2010).
10.2.2.3 Magnetization Transfer
The signal acquired in conventional MRI originates primarily from the hydrogen nuclei of water that are freely tumbling. Hydrogen nuclei bound to macromolecules have highly restricted motion and have T2 relaxation times that are orders of magnitude too short to contribute directly to the MRI signal. However, these bound or semi-solid protons can affect the observed signal indirectly by magnetization transfer (for a review, see Henkelman et al. 2001 and van Buchem and Tofts 2000).
Magnetization transfer (MT) refers to the MR phenomenon in which spins in two or more distinct environments exchange their magnetization via cross relaxation and/or chemical exchange. The simplest and most extensively used MT tissue model is a two-pool system in which protons are considered to be either in a highly mobile liquid state (water) or in a semi-solid macromolecular state of relatively restricted motion, such as large lipids (Wolff and Balaban 1989). The difference in mobility of the water and the semi-solids results in T2 relaxation times of >10 ms for the water and <100 μs for the semi-solids. Experimentally, selectively saturating the semi-solid component and measuring the reduction in the liquid component, undergoing exchange, enables observation of the MT effect. To isolate the MT effect, acquisitions are often performed with and without semi-solid saturation pulses and ratio or percent difference images (so-called MTR images) are calculated (Fig. 10.2). The resulting semi-quantitative images reflect a combination of sequence and relaxation parameters in addition to MT (Pike 1996; Pike et al. 1992). Detailed information about these spin populations can also be calculated using a variety of off-resonance saturation pulses and an appropriate model of MT in tissue, so-called quantitative magnetization transfer imaging (QMTI) (Henkelman et al. 1993; Morrison et al. 1995). The technique of Sled and Pike yields the relative size of the restricted proton pool (F), the first-order forward magnetization exchange rate (kf), as well as most relaxation parameters of the free and restricted pools (R1f and T2f, and T2r) (Sled and Pike 2001).
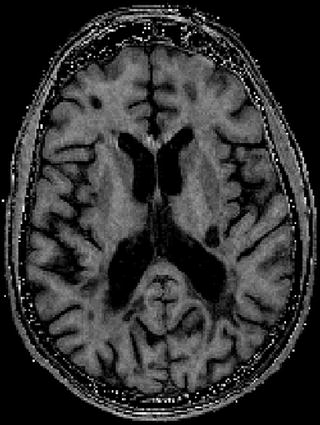
Fig. 10.2
MTR image. Note the high MTR in white matter, low MTR in grey matter and absent MTR in CSF. Lesions show variable MTR depending on their myelin content
MT occurs in most biological tissues that have significant interacting liquid and semi-solid constituents. However, in brain white matter, magnetization transfer is dominated by interactions between water and the macromolecular components of myelin, in particular the hydroxyl and amino moieties of cholesterol and glycocerebrosides on the myelin surface (Fralix et al. 1991; Kucharczyk et al. 1994). Thus, while MT measurements cannot provide absolute specificity to the molecular constituents of tissue, there is strong and convergent evidence to support the interpretation of MT changes in white matter as reflecting changes in myelin content.
The onset of T1 shortening seen on T1-weighted images during the early phases of myelination corresponds temporally and spatially to changes in magnetization transfer. Thus, it appears that the T1 shortening on spin echo images with myelin maturation results, in part, from a strong magnetization transfer interaction with myelin. The amount of magnetization transfer in the brain increases during myelination and parallels myelination as determined by histology (Engelbrecht et al. 1998). Destruction of myelin results in decreased magnetization transfer (Dousset et al. 1992). In a study of fixed post-mortem brain samples, Schmierer et al. (2007) showed a strong correlation between the relative size of the restricted pool and the myelin lipid content observed with the Luxol fast blue (LFB) stain. In a follow-up study, the same authors showed there was also a correlation in unfixed post-mortem tissue (Schmierer et al. 2008).
In vivo imaging studies have also contributed to the validation of MT as a marker for myelin. Logical variations have been reported in the QMTI parameters of white matter of healthy controls (Sled et al. 2004), and densely myelinated white matter fibre tracts are distinguishable in maps of the restricted pool fraction (Yarnykh and Yuan 2004).
In multiple sclerosis (MS), of the restricted pool size has been observed to decrease substantially in chronic lesions (Davies et al. 2004; Levesque et al. 2005; Sled and Pike 2001; Tofts et al. 2005), while small but significant decreases in F in the normal-appearing white matter (NAWM) have been reported (Davies et al. 2004; Narayanan et al. 2006). The impact of MS pathology on the T2 of the restricted pool (T2r) is still a matter for discussion, as both decreases (Tofts et al. 2005) and increases (Davies et al. 2004) have been reported in the lesions of patients with MS. In a study combining QMTI and myelin water imaging in 9 controls and 19 MS patients (Tofts et al. 2005), Tofts et al. reported significantly decreased restricted pool and myelin water fractions in lesions and significantly decreased restricted pool fraction in NAWM. These authors concluded that, while pathology affects each measure differently (potentially explained by the presence of inflammation and axonal loss), the restricted pool fraction and the myelin water fraction both reflect demyelination to some extent.
Despite the growing number of studies of MS employing these two quantitative techniques, there has been limited work on one of the most dynamic phases of the disease, acute gadolinium-enhancing lesions. The MT ratio (MTR), which combines the entire MT effect into a single parameter, has been shown to decrease with acute demyelination and to increase with remyelination in an animal model of demyelination (Deloire-Grassin et al. 2000). In acute gadolinium-enhancing (Gd+) lesions of MS patients, the MTR has been observed to decrease acutely, followed by variable recovery over subsequent months (Chen et al. 2007; Dousset et al. 1998; Lai et al. 1997; Richert et al. 2001). Preliminary data show changes in MTR in acute lesions, in fact, correlate extremely well with quantitative measurements of macromolecular content (Levesque et al. 2008), and the correlation of increases in the MTR of acute Gd-enhancing lesions has been validated by post-mortem examination of an MS patient who died 6 months after MRI examination (Chen et al. 2007).
10.2.2.4 MT Imaging Advantages and Disadvantages
MT contrast is now a well-established mainstream imaging method with most manufacturers providing basic MT imaging capabilities on their scanners. MTR imaging can be performed in under 15 min with whole brain coverage, high spatial resolution and excellent within-site reproducibility. QMTI measurements, while more complex than MTR and still in the realm of custom acquisition and analysis, provide much more detailed information about the size and characteristics of the liquid and semi-solid constituents of tissue. Although the MT effect is not specific to myelin, post-mortem studies of MS brains have shown a correlation between semi-solid pool size and myelin content similar to that reported for myelin water imaging, and animal studies have indicated that the correlation of MTR with myelin content may be more reliable than that of myelin water imaging (Dula et al. 2010). With regard to the longer scan times and limited coverage associated with first generation QMTI, new approaches are now emerging that enable whole brain, high-resolution, QMTI to be performed in under 30 min (Gloor et al. 2008).
10.2.2.5 Diffusion Tensor Imaging
Diffusion tensor imaging (DTI) uses magnetic field gradients applied in different directions to measure the extent to which the diffusion of water has a directional preference. Water molecules in pure water diffuse randomly and have an equal probability of motion in all directions. The probability distribution function describing this is spherical, and the diffusion is described as isotropic. Water molecules in tissue that has an oriented microstructure diffuse preferentially along the axis of the oriented structure and may be restricted in the axis perpendicular to the structure. In white matter tracts, for example, water is hindered in its diffusion perpendicular to the fibres and has a greater probability of motion along the tracts. The probability distribution function corresponding to this is ellipsoidal and can be characterized by a vector describing the long axis (apparent diffusion coefficient, ADC, parallel) and two orthogonal vectors describing the short axes (ADC perpendicular or radial). The more restricted the motion is, the more elongated the ellipse becomes, and the more anisotropic the diffusion. The relative size of the long axis of the ellipse to its short axis can be used to quantify the anisotropy in terms of fractional anisotropy (FA).
DTI is most commonly acquired using fast imaging techniques, such as single-shot echo planar imaging (EPI), to minimize problems associated with the technique’s inherent sensitivity to motion. Diffusion encoding is typically achieved using magnetic field gradient pulses to dephase diffusing spins while leaving stationary ones unaffected. To calculate a diffusion tensor, a minimum of six diffusion encodings must be performed with gradients encoding different diffusion directions. DTI acquisition and analysis is now available on most commercial MRI scanners, and basic whole brain data sets can be acquired with isotropic resolution, on the order of a few millimetres, in a few minutes.
Myelin, the axonal membrane, microtubules and microfilaments within axons all are highly oriented structures that could hinder water diffusion and contribute to fractional anisotropy. It has been shown that microtubules and microfilaments are not significant contributors (Beaulieu and Allen 1994). Myelin contributes to some extent. However, myelin is not essential for diffusion anisotropy, as nerves which are normally unmyelinated show anisotropy that is, in some cases, comparable to that of myelinated nerves (Beaulieu and Allen 1994), and diffusion is only decreased by ∼20% in the myelin-deficient rat (Gulani et al. 2001; Tyszka et al. 2006). Thus, it appears that the axonal membrane is the major source of anisotropy.
In MS lesions, the perpendicular component of the ellipsoid describing diffusion anisotropy increases and fractional anisotropy decreases. The extent to which this reflects demyelination of intact axons is, however, unclear, as MS lesions are known to be associated with oedema and axonal injury, which also could be associated with increased diffusion perpendicular to fibre orientation and decreased FA.
10.2.2.6 DTI Advantages and Disadvantages
The use of DTI to assess myelination also has other disadvantages. Aside from the fact that the axonal membrane (and not myelin) is the primary determinant of anisotropy, crossing, branching and bending of fibres within a voxel reduce the anisotropy independent of myelination. Thus, it is possible that loss of axons in one of two tracts that have crossing fibres within a voxel could result in an increase rather than a decrease of anisotropy. This explanation has been proposed to explain paradoxical behaviour of FA in certain pathological situations (Oouchi et al. 2007). Since EPI is typically employed in DTI, geometric distortions and signal loss in areas of magnetic field inhomogeneities are another problem.
10.2.3 PET Markers of Myelin
It is also possible to assess myelin in vivo using positron emission tomography (PET) and tracers such as 1,4-bis(p-aminostyryl)-2-methoxy benzene (BMB) and PIB (Stankoff et al. 2006, 2011) (Fig. 10.3). These tracers crosses the blood–brain barrier and bind to myelin in a dose-dependent and reversible manner, enabling the detection of demyelinating lesions in experimental models of demyelination and dysmyelination and post-mortem in the brains of patients with multiple sclerosis. PIB is already being used in humans for the study of Alzheimer’s disease and is under development as a potential brain myelin imaging technique for use in humans.
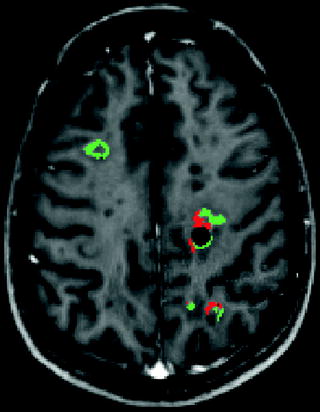
Fig. 10.3
Voxel-based analysis of changes in MTR between two time points. Significant increases in MTR consistent with remyelination are shown in green. Significant decreases in MTR consistent with demyelination are shown in red (after Chen et al. 2007)
10.2.4 Conclusions
A variety of techniques are available that offer relative specificity for myelin and the possibility to assess demyelination and remyelination in vivo. Multi-component T2 relaxometry may be the most specific but has low signal to noise ratio and is not widely available. MTR imaging is a practical alternative, albeit less specific than fully quantitative MT imaging. Diffusion tensor imaging is theoretically less specific but FA is generally modulated by myelination. Positron emission tomography is still in the very early stages of development.
10.3 Clinical Applications
Off all the techniques used for assessing myelin, by far the greatest experience has been with MTR. In addition to brain, a number of studies have focused on the optic nerve because of its unique ability to provide pathophysiological correlates of demyelination and remyelination.
10.3.1 Imaging Demyelination and Remyelination in the Optic Nerve
Optic neuritis occurs when an acute inflammatory-demyelinating lesions affects the optic nerve and is a frequent presenting symptom or relapse event that occurs at the onset or during the relapsing–remitting phase. It is possible to characterize the functional effects of optic neuritis using quantitative measures of vision: standard and low contrast acuity, visual fields and colour vision. Furthermore, the electrophysiological consequences of the lesion can be evaluated using the visual evoked potential (VEP), and abnormalities of latency can be used to infer the presence of demyelination or remyelination. Finally, imaging of the retinal nerve fibre layer (RNFL) using optic coherence tomography (OCT) provides a measure of axonal loss that occurs as a consequence of the inflammatory-demyelinating episode (Trip et al. 2005).
In such a context, imaging the symptomatic optic nerve lesion directly enables investigation of the relationship between the lesion morphology per se and function (quantitative vision measures), nerve conduction (VEP) and axonal damage (OCT). Specifically, identifying a relationship between a quantitative imaging measure from the lesion and the latency of the VEP would provide supportive evidence that the imaging measure reflects myelination: a prolonged well-formed P100 response suggests demyelination, and subsequent shortening of the latency towards normal suggests remyelination.
10.3.1.1 MRI of the Optic Nerve in Optic Neuritis
MRI of the optic nerve is technically challenging because of its small size, motion during image acquisition, chemical shift artefacts from orbital fat and CSF signal in the nerve sheath. Nevertheless, the symptomatic lesion is detectable in over 95% of people with acute optic neuritis as a region of high signal on T2-weighted fat-suppressed images (Fisher et al. 2006). The acute lesion displays gadolinium enhancement reflecting inflammation, and its presence is associated with more severe visual loss and conduction block in comparison with the post-inflammatory non-enhancing lesion state (Gass et al. 1996).
Other MR imaging measures that have been obtained in the optic nerve include cross-sectional area (a measure of atrophy), diffusion and magnetisation transfer ratio (MTR). Of these, MTR has emerged as the most promising potential marker of demyelination and remyelination in optic nerve.
10.3.1.2 Optic Nerve MTR Studies in Optic Neuritis
Thorpe et al. (1995) investigated the optic nerves of 20 patients with optic neuritis using MT imaging and correlated the imaging findings with clinical and VEP measures. MTR was measured from a 2D gradient echo sequence. There was a significant correlation between MTR reduction and prolonged whole (r = −0.554, p < 0.01) and central field (p < 0.05) VEP latency.
Inglese et al. (2002) obtained conventional and MTR images from the optic nerves in 30 patients with MS as well as 18 controls and 10 patients with Lebers Hereditary Optic Neuropathy (LHON). In MS subject eyes, three subgroups were investigated: clinically unaffected, affected with good recovery of vision and affected with incomplete or no visual recovery. Reduced optic nerve volume and MTR was found in MS eyes with incomplete or no visual recovery and in LHON eyes, whereas such reductions were not observed in MS-unaffected or good recovery eyes. There was no significant correlation between optic nerve MTR and VEP latency.
Hickman et al. (2004) performed a serial clinical and imaging follow-up study of 21 of 29 patients who presented with acute optic neuritis. The follow-up period was 1 year, and 3D gradient echo MTR scans were obtained upon each visit along with conventional MRI, VEPs and visual function assessments. Whole nerve and lesion MTR measures were investigated. The initial MTR (during the acute episode) was not significantly different between affected and control nerves (47.3 pu vs. 47.9 pu), but in the affected nerve it decreased to a nadir of 44.2 pu after ∼240 days before partially recovering (45.1 pu at 1 year). For each 0.01 increase in the time-averaged lesion to normal-appearing nerve MTR ratio, the logMAR visual acuity recovery improved by 0.03 (95% CI, 0.002, 0.08, p = 0.02). The time-averaged VEP central field latency was shorter by 6.1 ms (95% CI 1.5, 10.7, p = 0.012) per 1 pu rise in time-averaged diseased optic nerve MTR. The investigators proposed that the early fall in diseased optic nerve MTR is consistent with demyelination and Wallerian degeneration of transected axons. A later nadir of MTR was evident when compared with studies of multiple sclerosis brain lesions (see elsewhere in this chapter), and this may have been due to slow clearance of myelin debris. Remyelination may have contributed to the non-significant increase in MTR seen between nadir and 1 year of follow-up.
Trip et al. (2005) studied optic nerve MTR in a cohort of 25 patients with previous optic neuritis; in many of whom, there was incomplete recovery of vision. The patients were also studied with OCT and VEPs and also had detailed assessments of visual function. Lesion MTR was significantly correlated with both central (r = −0.53, p = 0.008) and whole field (r = −0.40, p = 0.05) VEP latency. Whole nerve MTR was correlated with central VEP latency (r = 0.45, p = 0.03). No significant correlations were observed between optic nerve MTR measures and visual function, VEP amplitude or lesion length. However, OCT-measured RNFL thickness was significantly correlated with both whole nerve (r = 0.50, p = 0.01) and lesion (r = 0.44, p = 0.03) MTR. In this poorer visual outcome cohort, there was considerable axonal—as well as myelin—loss (Trip et al. 2005).
10.3.2 Imaging Demyelination and Remyelination in Brain
With the evidence from MR-pathology studies and optic nerve imaging suggesting that reduced MTR and T1 hypointensity are associated with demyelination and/or axonal loss, the next section reviews studies that have investigated these measures serially in new and evolving MS brain lesions and considers their potential as measures of demyelination and remyelination in such lesions
10.3.2.1 MTR Changes in NAWM Before a Lesion Appears
In a longitudinal study of newly appearing T2-weighted lesions, Pike et al. (2000) found that MTR decreased steadily in pre-lesional NAWM for months to years before lesion appearance on MRI. In order to explore the time course of pre-lesional MTR changes, Filippi performed a 3-month longitudinal serial study where ten patients were scanned every 4 weeks; 48 new enhancing lesions that arose out of NAWM were identified (Filippi et al. 1998). Three months before enhancement, the mean MTR in the corresponding NAWM was significantly lower than the mean MTR in NAWM outside enhancing areas; the MTR thenceforth continued to decrease prior to the appearance of the enhancing lesion. In similar studies of lesion evolution, Fazekas found a significant decrease of the MTR 4 months before lesion enhancement in 12 patients with 44 enhancing lesions (Fazekas et al. 2002). Goodkin, in a serial study of 22 patients who developed 129 enhancing lesions over 12 months, found differences in pre-lesional contralateral NAWM several months prior to the lesion appearing (Goodkin et al. 1998). Richert et al. in 2001 co-registered the regions of interest of 185 new contrast-enhancing lesions to the MTR image set to determine the mean lesion MTR on each monthly exam. The lesion MTR was reduced compared with MTR of NAWM as early as 12 months prior to enhancement (Richert et al. 2001).
Related posts:
 Immune Modulation and Repair Following Neural Stem Cell Transplantation
 Effects of Current Medical Therapies on Reparative and Neuroprotective Functions in Multiple Sclerosis
 Development of Oligodendrocytes in the Vertebrate CNS
 A Peripheral Alternative to Central Nervous System Myelin Repair
 Exogenous Cell Myelin Repair and Neuroprotection in Multiple Sclerosis
 Axonal Protection with Sodium Channel Blocking Agents in Models of Multiple Sclerosis
Stay updated, free articles. Join our Telegram channel

Full access? Get Clinical Tree


