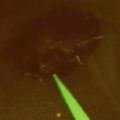
Fig. 2.1
The PDE camera was fixed 50 mm away from the sample (white arrows). Yellow arrowhead: the filter paper (0.6 mm thick, 6-mm dia.) to which 20 μL of ICG solution was instilled
1.
The evaluation of the ICG fluorescence intensity (FI) in various concentrations of ICG solutions
We prepared the original ICG solution (25 mg, with 10-mL distilled water), with saline, with distilled water, and with plasma. We used filter paper (0.6 mm thick, 6-mm dia.) to which 20 μL of ICG solution was instilled (Fig. 2.1). We prepared ICG solutions with the following concentration ratios: 2, 4, 8, 16, 32, 64, 128, 256, 512, 1,024, and 2,048 times (Fig. 2.2). The FI of the saline and distilled water after adding the 2.0 g/dL bovine albumin was used throughout the experiment.
Fig. 2.2
ICG solutions with concentration ratios (human plasma)
We evaluated the histogram of each sample using image analysis software after the histogram was captured by a personal computer. We also examined the absorbance of the ICG solutions by spectrophotometry.
2.
The fluorescence properties of ICG under changes of temperature, pH, and light conditions
Based on the results of a preliminary experiment (data not shown), we used ICG solution diluted by 100 times the original ICG solution with 2 g/dL bovine albumin. First, under the same imaging conditions, we evaluated the FI with variations in temperature, pH status, and the light/dark condition as follows: (a) at room temperature (RT) under light from a fluorescent lamp for 24 h (the RT/light condition), (b) at RT in a completely dark darkroom (the RT/dark condition), (c) at 4 °C under fluorescent lamp light for 24 h (cold/light condition), and (d) at 4 °C in the darkroom (cold/dark condition). We assessed the FI in each condition up to 56 days at 7-day intervals.
We next examined the FI of the samples at the same concentrations from 10 to 50 °C. Lastly, we examined the FI of samples at the same concentrations from pH 3.0 to pH 11.0.
Four samples in each experimental group were prepared under the same condition, and the average FI value of the four samples was evaluated throughout the experiment.
2.2.2 Preliminary Study of the Clinical Applications of Fluorescence Imaging Using the Optimal Concentration of ICG Solution
Based on the results of the above experiments, we examined the ICG FI after a subcutaneous injection of 0.4 mL of a 100-fold dilution of the original ICG solution into the palm side of the forearm of a consenting breast cancer patient with lymphedema. We also injected the ICG original solution into the back of the hand on the same side.
2.3 Results
Our measurements of the absorbance provided by the various dilution series, saline, distilled water, and plasma dilution showed the correct hyperbolic pattern, which demonstrated that the ICG diluting procedure in this experiment was acceptable (Fig. 2.3). We were able to observe the ICG fluorescence in both saline and distilled water, although these samples showed very low fluorescence intensity compared to that of the plasma (Fig. 2.4). The maximum FI of the plasma was in the vicinity of the original ICG solution diluted 80-fold from 90-fold (Fig. 2.5).
Fig. 2.3
Concentration-absorption curves for saline, distilled water, and human plasma
Fig. 2.4
ICG fluorescence images of the same intensity (32× dilution)
Fig. 2.5
Density-intensity curve of human plasma. The maximum FI of the plasma was in the vicinity of the original ICG solution diluted 80-fold from 90-fold (red bar)
However, in saline and in distilled water, there were variations in the FI, and it was not clear what the appropriate ICG concentration was for maximum brightness (Fig. 2.6). We therefore added bovine albumin (2 g/dL) to the original ICG solution. We were then able to obtain the maximum brightness in the vicinity of the original ICG solution diluted 90-fold from 100-fold ICG solution. The FI of the plasma was not changed by adding bovine albumin (Fig. 2.7).
Fig. 2.6
Density-intensity curves of three samples. In the saline and distilled water, it was not clear what the appropriate ICG concentration was for maximum brightness (red and blue lines)
Fig. 2.7
Density-intensity curve of three samples with added bovine albumin. The maximum brightness was in the vicinity of the original ICG solution diluted 90-fold from 100-fold ICG solution (red bar)
With the subcutaneous injection of a 100-fold dilution of the original ICG solution in a breast cancer patient with postoperative lymphedema, the FI did not decline (Fig. 2.8).
 ICG Fluorescent Image-Guided Surgery in Head and Neck Cancer
 Regional Lymph Node Dissection Assisted by Indocyanine Green Fluorescence Lymphography and Angiography for Stage III Melanoma
 Fluorescence Imaging for Intraoperative Identification of Pancreatic Leak
 Intraoperative Detection of Hepatocellular Carcinoma Using Indocyanine Green Fluorescence Imaging
 Indocyanine Green Fluorescent Lymphography and Microsurgical Lymphaticovenous Anastomosis
 Principle and Development of ICG Method


Related posts:
ICG Fluorescent Image-Guided Surgery in Head and Neck Cancer
Regional Lymph Node Dissection Assisted by Indocyanine Green Fluorescence Lymphography and Angiography for Stage III Melanoma
Fluorescence Imaging for Intraoperative Identification of Pancreatic Leak
Intraoperative Detection of Hepatocellular Carcinoma Using Indocyanine Green Fluorescence Imaging
Indocyanine Green Fluorescent Lymphography and Microsurgical Lymphaticovenous Anastomosis
Principle and Development of ICG Method
Stay updated, free articles. Join our Telegram channel
Full access? Get Clinical Tree
