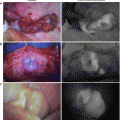
Fig. 32.1
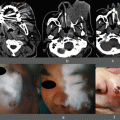
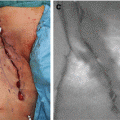
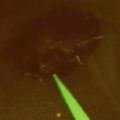
Representative images of ICG fluorescence. (a) The center two panels show gross appearance (left) and ICG fluorescent image (right) of resected HCC specimen. (b) Left three panels are ICG-high (IH) group which fluorescence was detected on ≧50 % of the cut surface. The right three panels show ICG low which fluorescence was detected on <50 % of the cut surface
32.3 ICG Pharmacokinetics
Various drugs and substrates are taken into hepatocytes by the influx transporters, metabolized by detoxifying enzymes, and are subsequently excreted to bile canaliculi or blood circulation by the efflux transporters (Fig. 32.2) [6, 26, 34]. ICG is an organic anion, in which molecular formula and molecular weight are C43H47N2NaO6S2 and 775 Da, and is taken up exclusively by the liver and rapidly excreted to bile canaliculi without biotransformation [3, 22]. The rate of uptake of ICG is correlated with hepatic blood flow, and its rate of excretion correlates with hepatic function and biliary excretion [4, 28]. In addition, ICG has a characteristic maximum absorption peak of 805 nm in the near-infrared light region, which allows direct measurement of hepatic tissue ICG concentration using NIR [28]. Thus, the reasons why the HCC tissues raise ICG fluorescence visualized by NIR camera may result from some alterations of the hepatic metabolic processes abovementioned.
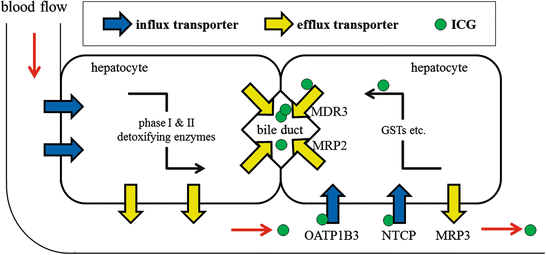

Fig. 32.2
A schema of hepatic metabolism of xenobitics and ICG. Blue arrows, influx transporters; yellow arrows, efflux transporters; green circle, ICG; ICG, indocyanine green; OATP1B3, organic anion-transporting polypeptide 1B3; NTCP, Na + −taurocholate cotransporting polypeptide; MRP, multidrug resistance-associated protein; MDR3, multidrug resistance p-glycoprotein-3; GST, glutathione S-transferase
32.4 ICG Fluorography and Magnetic Resonance Imaging
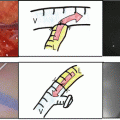
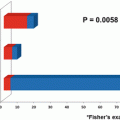
Gadolinium ethoxybenzyl diethylenetriamine pentaacetic acid (EOB), a magnetic resonance imaging (MRI) contrast medium, is known to be taken up into hepatocytes but not into typical hepatocellular carcinoma cells. However, some HCCs show higher EOB-MRI intensity levels, at the hepatobiliary phase, compared to adjacent noncancerous parenchyma. It is reported that such phenomena are derived from the expression levels of hepatic influx transporter, organic anion-transporting polypeptide 1B3 (OATP1B3), and efflux transporters including multidrug resistance-associated protein (MRP) 2 and 3 [16, 30]. We incidentally noticed that such high EOB HCCs had high ICG fluorescent levels (Fig. 32.3a). In our study [27], 19 of 22 HCCs (86.4 %) were detected as typical hypointense masses under hepatobiliary phase of EOB-MRI. The other three HCCs were detected as hyperintense masses compared to the surrounding liver parenchyma. All three EOB-accumulated HCCs were categorized into ICG-high (IH) group. Overall, relative intensity (tumor-to-surrounding parenchyma) under hepatobiliary phase of EOB-MRI in IH group was significantly higher than that in ICG-low (IL) group (Fig. 32.3b). Moreover, it is reported recently that EOB-MRI is a useful method to evaluate the liver function correlating with ICG retention test [24]. Therefore, we suspect that EOB dynamics and ICG accumulation pattern may have common mechanisms reflecting transporters’ expression in HCC.
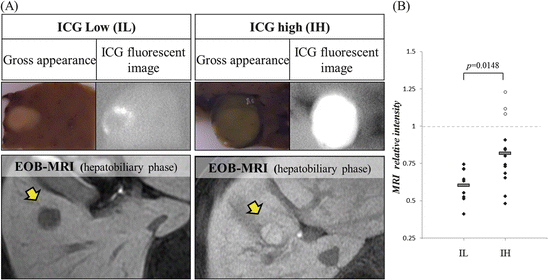

Fig. 32.3
Relationship between ICG fluorescent imaging and EOB-MR imaging. (a) The left panel shows the typical rim emission pattern HCC which represented low intensity relative to the surrounding parenchyma at hepatobiliary phase of EOB-MRI. The right panels show the typical uniform emission pattern HCC which represented high intensity relative to the surrounding parenchyma at hepatobiliary phase of EOB-MRI. Macroscopically, these EOB-high HCCs are usually greenish (so-called green hepatoma). (b) Relative MRI intensity of HCC compared to adjacent noncancerous parenchyma in hepatobiliary phase of EOB-MRI was measured in IL (ICG-low) and IH (ICG-high) group
32.5 Expression of Hepatic Transporters in HCC
We analyzed the intratumoral expression levels of transporters using an immunoblot analysis in 20 and immunohistochemistry in 40 resected HCC tissues, with OATP1B3 and sodium-taurocholate transport protein (NTCP) as influx transporters and multidrug resistance p-glycoprotein-3 (MDR3), MRP2, and MRP3 as efflux transporters. OATP1B3 protein levels were significantly higher in the IH group and MDR3 protein levels, an exporter to bile canaliculi, were significantly higher in the IH group [27]. NTCP and MRP2 tended to be higher in IH group, but did not reach the statistical significance. Conversely, MRP3 seemed to diminish in IH HCCs (Fig. 32.4). Ishizawa et al. [13] also reported that OATP1B3 and NTCP are responsible for ICG accumulation in HCC tissues.
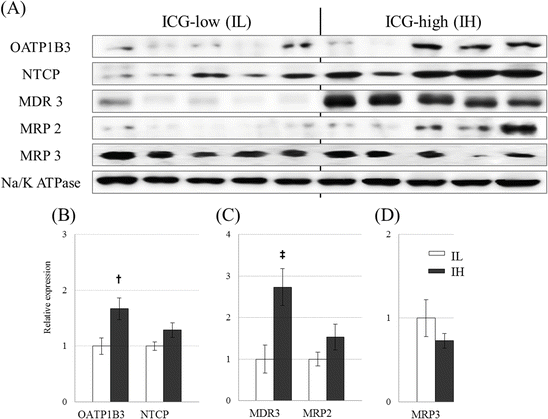

Fig. 32.4
Immunoblot analysis of hepatic transporter expression: Panel (a) shows a typical immunoblot analysis of hepatic transporters. Panels (b), (c), and (d) show the densitometric quantification results of influx transporters (OATP1B3 and NTCP), canalicular efflux transporters (MDR3 and MRP2), and the sinusoidal efflux transporter MRP3, using Na+/K+ ATPase as an internal standard, respectively. Statistical analysis was performed using the Mann–Whitney U test; †, p < 0.05, ‡, p <0.01 significant difference between the IL (left white bars) and IH (right black bars) groups
32.5.1 Influx Transporter
Hepatic influx transporters export various endogenous and exogenous substrates from the basolateral membrane side into hepatocyte. OATP1B3 is an organic anion transporter, encoded by the solute carrier family 21A8 (SLC21A8), localizing in the sinusoidal side of the plasma membrane. OATP1B3 have broad substrate specificity and accept a number of therapeutic drugs [29] concomitant with transporting of endogenous substrates, including bile acids, thyroid hormones, prostaglandins, and bilirubin glucuronide [9].
We analyzed OATP1B3 immunostaining in 40 HCC specimens and revealed that high OATP1B3 expressions were significantly correlated with high ICG fluorescence [27]. Although OATP1B3 exists predominantly in the liver, several cancers of the other organ origin express this influx transporter [10, 37], indicating the modulation of the sensitivity to anticancer reagents. In some articles, it is reported that OATP1B3 is one of the targets for anticancer therapy and is thought to be a possible prognostic factor of cancers [18] including HCCs [36].
NTCP, sodium-taurocholate cotransporting polypeptide, is a member of the solute carrier family 10 (SLC10), the major bile acid transporter in human hepatocytes, that localizes to the basolateral hepatocyte membrane [35]. This has been shown to also transport some xenobiotics in a Na+-dependent manner [11] and transport indocyanine green [3]. Although its expression is known to be reduced in hepatocellular carcinoma [38], some HCC may use this transporter as the ICG export system [13].
It is reasonable to assume that the high expression of these transporters induces abundant intracellular ICG accumulation in a short time after ICG administration. However, the intraoperative fluorography was performed usually several days after intravenous ICG injection, and ICG deposition were scarcely seen in intracellular space but mainly seen in extracellular structures such as pseudo-glands (Fig. 32.5). Thus, high expression of influx transporter is one of the necessary conditions, but the other mechanism is also needed for ICG accumulation in HCCs.
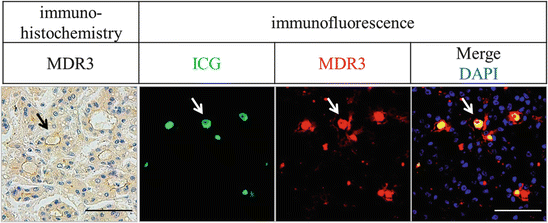

Fig. 32.5
Immunohistochemical and immunofluorescent images of the MDR3 protein and accumulated ICG. Left panels show MDR3 immunohistochemical staining image. In the right three panels, green and red colors indicate ICG deposits and MDR3 fluorescent staining, respectively. Nuclei are shown in blue with DAPI staining. These panels show representative figures of HCC with pseudo-glandular structures (arrows). The scale bar shows 100 μm
32.5.2 Efflux Transporter
Hepatic excretions of the endogenous and exogenous substrates were regulated mainly by ATP-binding cassette (ABC) transporters. Until now, 48 members of the ABC transporter family have been isolated and identified [7]. The ABC transporter efflux activity is driven by the energy derived from the hydrolysis of ATP to adenosine diphosphate (ADP) to transport substrates across the cellular membrane [1]. MDR3, also known as ABCB4, is reported to regulate ICG excretion [17]. We demonstrated that MDR3 expression was positively correlated to ICG deposition in hepatocellular carcinoma tissues.
Generally, efflux transporters facilitate the clearance of intracellular substrate from hepatocyte. In normal hepatocyte with normal bile duct formation, ICG which metabolized in the hepatocyte are exported to apical-sided canaliculi leading to the excretion into the intestine and subsequently ICG disappearance from the liver. Therefore, we thought at first that high MDR3 expression is contradictory to the accumulation of ICG in HCC tissues. To uncover this contradiction, we performed fluorescent microscope analysis. We found that ICG was condensed inside the bile canaliculi and MDR3 high expression was observed around these spaces (Fig. 32.5). It is well known that HCCs frequently have pseudo-glands and anomalous bile canaliculi which do not connect to the main bile duct that is dead end. A conceivable reason for the abovementioned discrepancy is that excreted ICG into the blind-end canaliculi through MDR3 would cause the deposition of ICG.
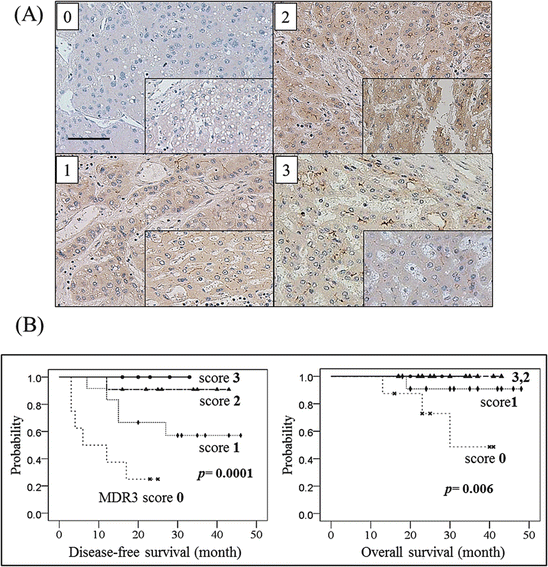
MDR3 is also known as a flippase and/or floppase of membranous phospholipids [2, 33], and the loss of its mouse homologous gene, MDR2, has been shown to induce hepatocarcinogenesis in mice [15]. Since we speculated that MDR3 expression in HCC tissues would influence the prognosis, we examined MDR3 immunostaining and investigated the relationship to HCC outcomes. To evaluate the expression of transporters with immunohistochemistry, 40 specimens were scored and divided into four categories as follows: score 0, negative or minimal; score 1, positive to a lesser extent than the adjacent liver parenchyma; score 2, positive to the same extent as the adjacent liver parenchyma; and score 3, positive to a higher extent than the adjacent liver parenchyma (Fig. 32.6a). MDR3 immunostaining analysis revealed that eight specimens were negative (score 0) for the expression of MDR3. The tumor size of MDR3-negative HCC was significantly larger than that of MDR3-positive HCC, and serum a-fetoprotein (AFP) levels were significantly higher in MDR3-negative HCC than in MDR3-positive HCC [27]. The MDR3 score correlated with disease-free survival (DFS) and overall survival (OS) rates following hepatectomy. Patients with MDR3-negative HCC (score 0) had significantly worse DFS and slightly worse OS rates than those with MDR3-positive HCC (Fig. 32.6b).

