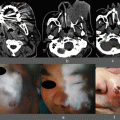
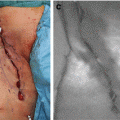
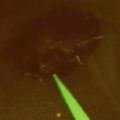
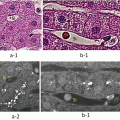
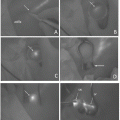
Fig. 29.1
ICG fluorescence imaging for primary HCC. Gross appearance (left) and intraoperative ICG fluorescence imaging (right) of liver surfaces. Fluorescence imaging by using a commercially available near-infrared (NIR) camera system (a) Photodynamic Eye (PDE; Hamamatsu Photonics K.K., Hamamatsu, Japan) and (b) HyperEye Medical System (HEMS, Mizuho Co., Tokyo, Japan)
Table 29.1
HCC detection using ICG fluorescence imaging
Author | Year | Number of patients | Time between injection and surgery (days) | HCC detection rate by intraoperative imaging (%) | HCC detection rate by ex vivo imaging (%) | Newly detected lesions | Newly detected HCC |
|---|---|---|---|---|---|---|---|
Gotoh | 2009 | 10 | 1–8 | 100 (10/10) | 100 (10/10) | 8 | 4 |
Ishizawa | 2009 | 37 | 1–7 | 51 (21/41) | 100 (63/63) | 13 | 8 |
Morita | 2011 | 58 | 3–28 | 62 (47/76) | 96 (73/76) | 35 | 6 |
Ishizawa | 2013 | 170 | 1–52 | NA | 99 (273/276) | 37 | 21 |
Following resection and sectioning, all liver tumors are examined using ICG fluorescence imaging ex vivo. The detection rate is reported to be almost 100 % [10, 12–14]. Ishizawa et al. reported that, in false-negative cases of ICG fluorescence imaging, the interval between the intravenous injection of ICG and surgery is exceptionally long compared with that seen in the remaining identified patients [14]. On the other hand, they found that the signal intensity of the noncancerous liver parenchyma was higher especially in patients with advanced cirrhosis who had received the ICG injection within 24 h before surgery [12]. A previously performed study in rats showed an optimal cancer-to-liver contrast in the group where ICG was administered at 72 h prior to surgery [16]. Further studies are needed to determine the optimal interval between ICG injection and surgery for obtaining good cancer-to-liver contrast.
29.4 Correlation Between the ICG Fluorescence Pattern and HCC Differentiation
The fluorescence patterns observed under NIR are classified into three groups: total fluorescent type, partial fluorescent type, and rim fluorescent type (Fig. 29.2). Several studies have reported a significant correlation between HCC differentiation and the fluorescence pattern [13, 14]. Combining these studies, a total of 346 patients were included (total type (n = 150), partial type (n = 145), and rim type (n = 51)). Among the rim fluorescent-type patients, three cases (6 %) were classified as well-differentiated carcinoma, and 22 cases (43 %) were classified as poorly differentiated carcinoma. On the other hand, in the other fluorescent-type groups (total and partial), 85 cases (29 %) involved well-differentiated carcinoma, and five cases (2 %) involved poorly differentiated carcinoma. These results suggest that the rate of the rim fluorescent type is significantly lower among cases of well-differentiated carcinoma and higher among cases of poorly differentiated carcinoma compared to that of the other fluorescent types. It is hypothesized that the mechanisms of ICG accumulation in HCC nodules are associated with ICG transporter expression levels. Ishizawa et al. reported the expression of Na+/taurocholate cotransporting polypeptide (NTCP) and organic anion-transporting polypeptide 8 (OATP8), the major uptake transporters for ICG [17], in the cancerous tissues of HCC lesions showing total and partial fluorescence patterns, but not lesions showing rim-type fluorescence, according to a gene expression and immunostaining analysis [14]. These results suggest that, in differentiated HCC tissues, the portal uptake function is preserved, whereas the biliary excretion of ICG is likely impaired. It has also been suggested that most poorly differentiated HCCs exhibit rim-type fluorescence on ICG fluorescence images as a result of an impaired portal uptake function in cancerous tissues. However, further research is needed to confirm the mechanism and pattern of ICG accumulation in HCC nodules.
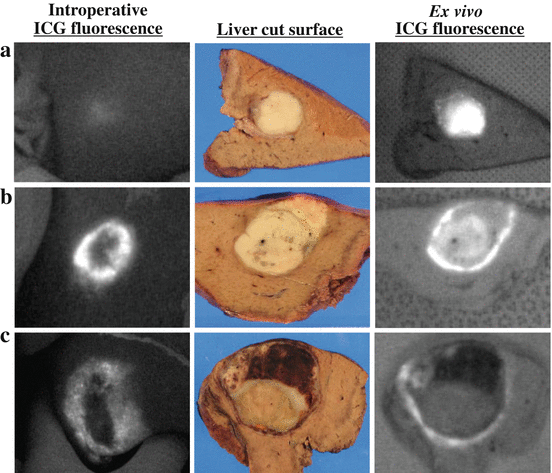

Fig. 29.2
ICG fluorescence patterns of HCC. Intraoperative ICG fluorescence imaging (left), gross appearance (middle), and postoperative ICG fluorescence imaging (right) of liver cut surfaces. (a) Total fluorescence type. (b) Partial fluorescence type. (c) Rim fluorescence type
29.5 Newly Detected Lesions on ICG Fluorescence Imaging
ICG fluorescence imaging technique can be used to achieve the enhanced detection of small HCC nodules undetectable with conventional detection methods, including preoperative CT, intraoperative ultrasound (IOUS), palpation, and visual inspection (Fig. 29.3). Previously published studies of newly detected HCC nodules are also summarized in Table 29.1 [10, 12–14]. The detection rate of new HCC lesions on intraoperative ICG fluorescence imaging is reported to be 10–40 %. Despite recent advances in preoperative imaging modalities, this technique detected new HCC nodules in 40 % of the patients in our preliminary study. Because most small HCC nodules (<10 mm in diameter) are pathologically well differentiated [18], lack typical imaging patterns for HCC, and are not always hypervascular [19], it is sometimes very difficult to diagnose these lesions as HCC preoperatively. In fact, all of the new HCC nodules detected in our study were very small (3–6 mm), and most of them were diagnosed as well-differentiated HCC. Sahani et al. reported that one of the main limitations of IOUS is the hampered detection of superficial and small tumors [20]. ICG fluorescence imaging performs well in cases of superficial and small tumors, although it is unable to visualize deeper tumors. Therefore, intraoperative ICG fluorescence imaging should be viewed as a complementary adjuvant to conventional imaging techniques for the preoperative and intraoperative detection of HCC.


Fig. 29.3


Newly detected HCC under ICG fluorescence imaging. (a) New single HCC (thin arrow) was detected in a different hepatic segment from main tumor. (b) Small newly HCCs (thick arrows) were detected around the main tumor. (c) Tiny newly HCCs (arrowheads) were scattered around the main tumor
Stay updated, free articles. Join our Telegram channel

Full access? Get Clinical Tree


