K-Space Revisited: An Informal View
Mark Doyle
An air of mystery surrounds k-space and treatments of it tend to either require advanced mathematical knowledge or else are too brief in nature. Here we will consider k-space in a relaxed, informal manner to engender familiarity, at the expense of comprehensive coverage. Please be aware that some of the illustrations are intended to be of a light-hearted nature (not strictly factual).
NON-MAGNETIC RESONANCE IMAGING EXAMPLE
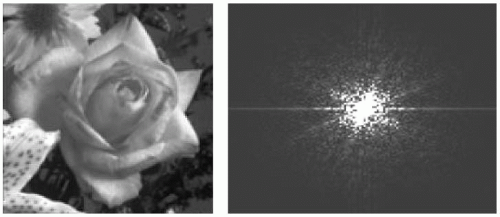
Perhaps the greatest difficulty involves relating k-space to the magnetic resonance imaging (MRI) sequence. However, k-space is not, by any means, exclusive to MRI. Let us consider a picture of some flowers. Every image, from whatever source, can be represented in the k-space format (see Fig. 34-1). For our working definition of k-space, we shall consider it to be the result of performing the mathematical operation of the Fourier transformation (FT) on an image.
FOURIER THEORY
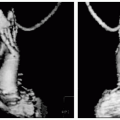
Fourier theory simply indicates that every signal waveform can be represented as a sum of sine and cosine waves. The conceptual difficulty here often involves relating a photograph, for example, of flowers, to a signal waveform. We can regard the flower picture as a signal, with intensity variations spread over two dimensions. To see this more clearly, we can tip the image over to visualize the intensity of the two-dimensional (2D) signal distribution (see Fig. 34-2). As we keep tipping the image we eventually see it in a sideview, clearly showing it to be a signal intensity waveform, although of a complex nature.
When viewed as a normal image, these intensity waveforms are represented as pixel intensities in a photograph or on a monitor screen. Obviously, the signal intensity view is not commonly seen. However, we now have an increased awareness of the relationship between an image and its signal content. Note that “image” features are still discernible in the “signal intensity” representation.
Given that the flower picture is a really a 2D signal waveform, let us concentrate on one line from the picture. Fourier theory says that this line “signal” can be represented by a series of sine and cosine waves. To consider what that means, let us explore a simpler example: a single sine wave. When we describe it, we consider it in terms of amplitude and frequency. In the case of a single sine wave it has parameters of frequency 1 cycle, and amplitude 1 (arbitrary units). The Fourier theory states that this single sine wave can be represented by a sum of sine and cosine waves! This is not such a big conceptual leap, because, by inspection, it already is a sine wave (see Fig. 34-3, top panel). However, let us continue and ask what does the Fourier transform of this sine wave look like? We can describe the Fourier transform signal as a single spike, centered on position 1, with an amplitude of 64. It is hard to imagine, but we are making great progress.
Flushed with this success, let us consider a sine wave with more cycles (see Fig. 34-3, middle panel). As we describe it, we note that it has parameters of frequency 10 cycles, and amplitude 1. Again, we ask what does the Fourier transform look like? As we describe it, it has a single spike at position 10, with amplitude 64. Moving, rapidly ahead, we consider yet another, higher frequency sine wave, that is, one with even more cycles (see Fig. 34-3, lower panel). As we describe it, it has parameters of frequency 20 cycles, and amplitude 1. In this case the Fourier transform is again a single spike, this time centered at position 20, with amplitude 64.
INTERPRETATION
By these multiple illustrations we see what is happening: a sine wave can be described by the number of
cycles (oscillations over its length) and its amplitude. Alternatively, to save us the effort of counting these cycles, we could perform a Fourier transform, which directly tells us how many cycles there were in the original sine wave, which is represented by a spike of signal at the number corresponding to the frequency content. However, we note that a sine wave of amplitude 1 generated a Fourier spike of amplitude 64. This apparent discrepancy is because there is a linear scaling factor that connects the two.
cycles (oscillations over its length) and its amplitude. Alternatively, to save us the effort of counting these cycles, we could perform a Fourier transform, which directly tells us how many cycles there were in the original sine wave, which is represented by a spike of signal at the number corresponding to the frequency content. However, we note that a sine wave of amplitude 1 generated a Fourier spike of amplitude 64. This apparent discrepancy is because there is a linear scaling factor that connects the two.
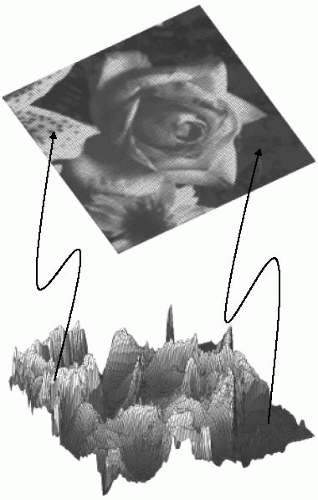 FIGURE 34-2 The top view is the familiar view of the flower picture, where signal is conventionally represented as bright and dark pixels. By tipping the image on its side, we see the signal intensity variations distributed over the two-dimensional (2D) plane. In this 3D view, it is apparent that the flower picture is really a 2D plot of signal intensity. |
MULTIPLE SINE WAVES
Now, let us step it up a notch: consider two sine waves: amplitude 1 for each; frequencies 1 and 10 cycles (see Fig. 34-4


Stay updated, free articles. Join our Telegram channel

Full access? Get Clinical Tree


