, Anna Yanai3, Vazgen Khankaldyyan3, Walter E. Laug3, Jeff Boden4, Keith Webster4, Yiwen Li5 and Rong Wen5
(1)
Analytical Imaging Core, Diabetes Research Institute, Miami Institute for Human Genomics, University of Miami, Miami, FL, USA
(2)
UM/Sylvester Comprehensive Cancer Center, Miller School of Medicine, University of Miami, Miami, FL, USA
(3)
Division of Hematology/Oncology, Department of Pediatrics, Children’s Hospital Los Angeles, USC Keck School of Medicine, Los Angeles, CA, USA
(4)
Molecular and Cellular Pharmacology and Vascular Biology Institute, Miller School of Medicine, University of Miami, Miami, FL, USA
(5)
Bascom Palmer Eye Institute, Miller School of Medicine, University of Miami, Miami, FL, USA
Abstract
Blood vessels are critical to normal mammalian development, tissue repair, and growth and treatment of cancer. Mouse research models enable mechanistic studies of blood vessels. We detail how to perfuse mice with fluorescent tomato lectin or the lipophilic fluorophore DiI. We provide details on how to image fluorescently labeled blood vessels.
Key words
Blood vesselsAngiogenesisFluorescent lectinDiIConfocal microscopeAn erratum to this chapter can be found at http://dx.doi.org/10.1007/978-1-60761-847-8_18
1 Introduction
Inhibiting tumor growth with anti-angiogenic therapies has received much interest because of the work by Judah Folkman [1]. Blood vessels, and blood flow, can now be visualized in vivo at depths to ~1 mm in mouse tissues using intravital microscopy with expensive multiphoton excitation laser microscopes (see refs. 2–6). Not having a multiphoton excitation laser, and because our tumors were implanted several millimeters deep in mouse brains, we have adopted an alternative approach of quantifying tumor growth by in vivo bioluminescence and MicroMRI imaging, and then performing visible and near-infrared confocal microscopic imaging of tumors in hemi-sectioned mouse brains. We were inspired to use a 10× objective lens for this project, by the work of R.M. Zucker with low-magnification confocal microscopy of mouse and rat fetuses [7–9]. We used fluorescent tomato lectin for our work, but note that Debbage and colleagues have obtained excellent staining of blood vessels, both by perfusion and in tissue sections, using any of several other lectins [10–12].
2 Materials
Female athymic nude mice (nu/nu, albino outbred stock from NCI), 6–8 weeks of age (Harlan, Indianapolis, IN).
U87MG human glioblastoma cell line (ATCC, Manassas, VA).
hrLuc-DsRed2-sr39tk HSV TK tribrid gene (Ray et al. [20]; S.S. Gambhir, pers. comm.).
RPMI with 10 % FBS in 5 % CO2 (GIBCO™ Invitrogen Corp., Carlsbad, CA).
Fluorescein-conjugated tomato lectin (Vector Laboratories, Burlingame, CA).
Biotin-conjugated tomato lectin (Vector Laboratories, Burlingame, CA).
Alexa Fluor® 647-streptavidin (Molecular Probes, Inc., Eugene, OR).
Glass bottom culture dishes, P35G-0-14-C or P35GC-1.5-14-C (Mattek Corp., Ashland, MA).
Leica TCS SP1 confocal microscope optics mounted on a Leica DMIRBE inverted microscope; LCS and LCS Lite confocal microscope acquisition and analysis software (Leica Microsystems, Exton, PA and Heidelberg, Germany). 2009 (U Miami): Leica SP5 spectral confocal DMI6000 inverted microscope or Zeiss LSM510/UV confocal Axiovert 200M inverted microscope.
Antigen Unmasking Solution (Vector Laboratories, Burlingame, CA).
Anti-PECAM-1 (M-20) (Santa Cruz Biotechnology, Santa Cruz, CA).
Anti-Smooth Muscle Actin Clone 1A4 (DakoCytomation, Carpenteria, CA).
Cy3-conjugated AffiniPure Donkey Anti-Goat IgG (Jackson ImmunoResearch Laboratories, Inc., West Grove, PA).
Fluorescein (FITC)-conjugated AffiniPure Donkey Anti-Rabbit IgG (Jackson ImmunoResearch Laboratories, Inc., West Grove, PA).
Purified rat anti-mouse CD31 (PECAM-1) monoclonal antibody (BD Pharmingen, San Diego, CA).
Biotinylated anti-rat IgG (VECTOR Laboratories, Burlingame, CA).
Hoechst 33342, H3570 (Invitrogen/Molecular Probes), 10 mg/mL stock solution, diluted to 100 μg/mL in distilled H2O, used at 0.1 μg/mL (live cell experiments) or 10 mg/mL in PBS (hemi-sectioned brain nuclear labeling).
Leica Microsystems (Bannockburn, IL) DMRXA fluorescence microscope (see text for additional details).
Pathscan Enabler III (in 2008 version IV) (Meyer Instrument, Houston, TX).
Polaroid SprintScan 4000+ (Polaroid Corp., Cambridge, MA).
MetaMorph Imaging System 6.25 (Universal Imaging Corp., Downingtown, PA).
Adobe Photoshop CS (Adobe Systems Inc., San Jose, CA).
3 Methods
The methods described below outline animal injection, sacrifice, brain confocal imaging, and immunofluorescent analysis of tissue sections. The tribrid reporter gene is described in Ray et al. [20],. Details of other methods can be found in other publications [13, 14, 19, 21–26]. Athymic nude (nu/nu) immunocompromised female mice, 6–8 weeks of age (Harlan, Indianapolis, IN), are used as the recipients of human tumor cells.
3.1 Tribrid Reporter Gene
A multipurpose reporter gene was introduced into the U87MG glioblastoma cell line by lentivirus transduction [22]. The hrLuc-RFP-TK tribrid gene [20, 27], courtesy of Sam Gambhir, UCLA (now at Stanford University), is a triple fusion of human codon-optimized Renilla luciferase (hrLuc), DsRed2 red fluorescent protein (RFP) (BD Clontech) and mutant sr39tk herpes simplex virus type 1 thymidine kinase (TK) (Ray et al. [20] for the precursor Rluc-sr39tk hybrid gene fusion article). Note that Ray et al. [20] report on an improved tribrid vector that replaces the DsRed2 RFP with a monomeric DsRed derivative (mRFP1, Campbell et al. [28]) and R.Y. Tsien’s lab has made spectral and brightness improvements to mRFP1 in their fruity fluorescent protein series of papers [29, 30].
Rluc enables whole animal in vivo bioluminescence imaging with a Xenogen 3D IVIS® imaging system for quantitation of tumor cell mass following native coelenterazine injection (collaboration with Mike Rosol and Maya Otto-Duessel, CHLA). In this and related studies, tumor size was also estimated by T1- or T2-weighted or contrast enhanced (tumor tissue edema) MicroMRI using either a custom mouse coil on a clinical MRI machine (GE Medical Systems 1.5 Tesla MRI) or on a 7 Tesla Bruker MicroMRI (collaboration with Rex Moats, Harvey Pollack and Maya Otto-Duessel, CHLA). MRI cross-section area correlates well with histology area [22, 31].
The DsRed2 red fluorescent protein (RFP) enables whole mount confocal microscopy and fluorescence stereomicroscope (Leica MZ FL III) of split brains, fluorescence microscopy of tissue sections by DsRed2 fluorescence or anti-DsRed immunofluorescence or immunohistochemistry with a compound microscope (Leica DM RXA), and flow cytometry (BD Biosciences FACSCalibur) of trypsinized brain. The tumor cells are labeled with the tribrid hrLuc-RFP-TK fusion triple reporter because we wanted to reserve the more sensitive firefly luciferase (Fluc) in vivo reporter for therapeutic stem cell tracking [22, 29, 32, 33].
The TK gene product uses a ganciclovir substrate, which the herpes simplex virus mutant sr39tk thymidine kinase converts to a toxic product, and as a PET reporter (MicroPET collaboration with Xiaoyuan (Shawn) Chen, USC PET Imaging Science Center).
3.2 Intracranial Xenograft Tumor Implantation
Mice were orthotopically injected with 105 U87 glioblastoma cells. Mice were anesthetized using ketamine (Ketajet 100 mg/kg) and xylazine (Xyla-ject 10 mg/kg) and 1 × 10⁵ U87 MG glioblastoma cells in 1 μL of serum free medium were inoculated in 20 min stereotactically in the defined location of the caudate/putamen (0.5 mm anterior to the bregma, 2.0 mm lateral to the midline) using a 10 μL Hamilton syringe (Reno, NA) advanced to a depth of 3.3 mm from the cortical surface. The slow rate of 100,000 cells in 1 μL in 20 min was necessary for the tumor cells to remain deep in the brain tissue. Rapid infusion, or rapid drawback of the injection needle, can result in the tumor cells becoming dispersed along the needle track and rapid growth along the track and along the surface of the mouse brain (S. Yamada, V. Khankaldyyan, W. Laug, R. Moats, I. Gonzalez-Gomez, unpublished MicroMRI and histology data). A full stereotaxis rig maximizes consistency of the xenograft model (M. Rosol, M. Jensen, pers. comm.).
3.3 Tomato Lectin Intravital Labeling of Blood Vessels (Vascular Casting)
We used either 1 mg/mL fluorescein (isothiocyanate) conjugated tomato (Lycopersicon esculentum) lectin (Vector Laboratories), or Alexa Fluor®-streptavidin (Molecular Probes) mixed immediately before use with biotin-conjugated tomato lectin (Vector Laboratories). Tumor-bearing mice were anesthetized and injected by cardiac puncture using a 28 gauge needle with 200 μL of fluorescent tomato lectin in PBS. Two minutes later, the mice were perfused with PBS intracardially to flush out red blood cells. Best results are obtained after maximally flushing out the red blood cells. An alternative to PBS perfusion (not used in the current work) is freshly prepared 4 % paraformaldehyde in PBS. This has the advantage of making the tumor tissue stiffer for hemi-sectioning, but has the disadvantage of increasing tissue auto-fluorescence, greatly increasing red blood cell auto-fluorescence, and disruption of some antigenic epitopes used for later immunofluorescence or immunohistochemistry. An alternative to cardiac puncture is tail vein injection. For lectin staining of brain microvessels, we obtained more consistent labeling with cardiac puncture. We have on occasion harvested other organs (liver, spleen, kidney/adrenal gland, lungs) from mice in this study (A. Yanai and V. Khankaldyyan) or from neuroblastoma orthotopic implantation or tail vein injection metastasis models (Chantrain et al. [34]; Y. DeClerck, C. Chantrain, K. Bajou, L. Sarte, S. Jodele, pers. comm.) after cardiac or tail vein injections. Cardiac puncture has a clear advantage for brain microvessel labeling, due to the “straight shot” from the aorta to the carotid arteries and brain blood vessels. Tail vein injection works somewhat better for the other organs, for those mice that have good tail veins and available injection sites following repetitive injections of chemotherapies or bioluminescent substrates. The neuroblastoma group has also evaluated Texas Red®-streptavidin tomato lectin for microvessel imaging with similar performance to those reported here (DeClerck et al. and McNamara, unpublished). Animal protocols were performed with CHLA animal care committee and biosafety committee approval. We anticipate future experiments that will obtain similar or superior data with fluorescent nanocrystals (aka quantum dots), i.e., QD655-streptavidin and/or QD705 streptavidin (Quantum Dot Corp., http://www.qdots.com) or Evitag720-streptavidin (Evident Technologies, http://www.evidenttech.com), as has been published for blood (Larson et al. [3]) and lymph node (Kim et al. [35]) imaging in live animals [35].
3.4 Brain Excision and Hemi-sectioning
For confocal imaging, brains were excised and sectioned in half (horizontal section). Horizontal sectioning was chosen because the U87MG-tribrid gene transfected human glioblastoma tumor cells were orthotopically injected in the middle of the mouse brain [21, 22, 26, 31]. The hemi-section was made with a scalpel, the cut being from the olfactory bulb to cerebellum, approximately bisecting the orthotopic implanted tumor. This is the same plane as one of the axes of the MicroMRI 3D scans [31], and is also used for histological sections by fluorescence immunohistochemistry and standard immunohistochemistry with either light microscopy (see below) or 35 mm film/Pathscan microscope slide scanner and image analysis [21, 34]. The brain halves were placed in cold PBS on ice, transported to the confocal microscope, transferred to a uncoated #0 or #1.5 coverglass 35 mm glass bottom dish (P35G-0-14-C, or P35GC-1.5-14-C, Mattek Corp., http://www.glassbottomdishes.com/gbcustomerpriceweb.pdf). Following confocal imaging, the brain hemi-sections were put back on ice, transported back to the wet lab, fixed, sectioned and then individual sections were processed for H&E histology, immunofluorescence and immunohistochemistry. In collaboration with Dr. Christine Brown, Renate Starr and Professor Michael Jensen, we have imaged Hoechst 33342 dye nuclear counterstaining of hemi-sectioned mouse brains, at the Light Microscopy Core of City of Hope National Medical Center. Brain nuclei were imaged on a Zeiss LSM 510 NLO confocal/multiphoton microscope in PBS with Hoechst 33342 at 10 μg/mL for 15 min, transferred to an imaging dish with PBS, and imaged using 750 nm, ~80 MHz, ~100 femtosecond pulses with a Zeiss 10×/0.5 NA lens. On the same microscope we have performed live cell experiments with Hoechst 33342 at 0.1 μg/mL in bicarbonate free, phenol red free, tissue culture medium. This concentration was chosen because higher concentrations of Hoechst are known to inhibit normal cell behavior [37]. When using Hoechst dyes, it is important to dilute the 10 mg/mL stock solution 100-fold in water because diluting in PBS results in formation of dye precipitates.
3.5 Confocal Microscopy
Details of the CHLA confocal microscope hardware can be found in the Appendix. The Leica SP1 confocal spectrophotometry hardware has been described [38, 39]. This and other spectral confocal microscopes is also available [40], where the CHLA system is system L4.
Most Images were acquired with Leica TCS SP1 confocal optics, equipped with air-cooled Argon ion (457, 476, 488, and 514 nm laser lines, ~2 mW power at 488 nm at the specimen plane), air-cooled Krypton ion laser (568 nm, ~2 mW power) and HeNe laser (633 nm, ~2 mW) mounted on a Leica DM IRBE inverted fluorescence microscope. The Argon and Krypton ion lasers operational lifetime is low if run at full power (maximum power knob setting of 4 o’clock on laser front panel); we routinely operated both at 12 o’clock power settings (mW power shown above for 100 % AOTF settings); when idle, the laser power was set to the minimum (knob setting 8 o’clock). Laser power was attenuated with the Leica SP1 AOTF. The Leica confocal microscope is maintained under an annual service contract with the manufacturer (Leica Microsystems, Exton, PA). In addition to an annual preventive maintenance visit by the manufacturer’s field service engineer, the image core manager performs periodic performance tests and arranges service visits as needed (testing details available from GM). Confocal system performance data, during the time period of image acquisition for this study, was published as system L4 [40].
Three reflection/fluorescence and one transmitted light (through the condenser) photomultiplier tubes (PMTs) are present on our SP1 confocal microscope. For fluorescence, the PMT offset were adjusted such that a positive intensity value was read out even with no light reaching the detector. Typical PMT gains were in the 700–900 settings range (maximum 1,250). A Leica RSP500 or TD488/568/633 triple dichroic mirror was used in the scanhead to reflect laser excitation to the microscope and pass emission photons to the PMTs. The SP1 optical head uses a prism spectral dispersion element with wavelength selection slits in front of each PMT. The SP1 is controlled from Leica LCS 2.5 on a Pentium 400 MHz computer. Confocal images were acquired with no filter cube in place. The Leica DM IRBE microscope stand is equipped Leica A, I3 and N2.1 longpass filter cubes, for DAPI, fluorescein/GFP/Alexa488, Cy3/DsRed, respectively, excited with a 50 W Hg lamp for visual inspection (a 100 W Hg voltage stabilized lamp would be a better choice for standard microscopy, since the Leica 50 W Hg lamp flickers). Information on filter cubes can be found in Ploem and Walter [41]. We occasionally acquired brightfield or Nomarski differential interference contrast (DIC) images with the laser line(s) from the objective lens and specimen being detected through the microscope condenser and a transmitted light path PMT that was positioned adjacent to the microscope transmitted light path, and switchable with a Leica knob. The transmitted light images were not confocal because that light path does not include a pinhole to reject out of focus light; the transmitted light images were in register with the confocal fluorescence. The laser illumination transmitted light DIC images do exhibit optical sectioning because of the intrinsic characteristics of DIC, but the images are not particularly good as the Leica optics exhibit significant shading, the contrast range of the 8-bit images are small, and the thickness of the hemi-sectioned mouse brains scatter much of the light.
Most brain images were acquired with a Leica 10×/0.40 NA HC Plan Apo Ph1 dry objective lens (Leica SP1 confocal microscope). Some images were acquired with a 10×/0.4 NA HC Plan Apo IMM lens, using water immersion, without significant improvement in image quality. We have tested a Leica N Plan 5×/0.12 NA, N Plan 2.5×/0.07 NA, and Plan Fluotar 1.3/0.04 NA objective lenses, for the unfixed hemi-sectioned brain application, but have been whelmed by the fluorescence brightness and contrast. These lenses may perform better using completely transparent, low-scattering, tissue with bright fluorescent markers, such as Zucker’s 1:1 benzyl benzoate–benzyl alcohol (BABB) clearing solution [8] or methyl salicylate clearing solution of brains perfused with red fluorescent latex vascular casts (S. Yamada, CHLA). BABB or methyl salicylate clearing of brain tissue requires ~1 week time after transfer to absolute ethanol, and leaves the tissue fragile with respect to later handling. By contrast, our unfixed brain hemi-section imaging adds a few hours delay between the time the mouse is sacrificed and when the tissue is ready for histological processing.
The confocal pinhole size was routinely set to either 1.0 or 1.5 Airy units when using the 10×/0.40 NA dry objective lens. At 1.0 Airy units, this lens has a theoretical XY resolution of 488 nm and Z resolution of 2,630 nm, with a working distance of 2,200 μm. (The deepest into a fluorescent specimen we have ever imaged was 836 μm with a methyl salicylate cleared red fluorescent latex mouse brain vascular cast.) Opening the pinhole from 1.0 to 1.5 Airy units results in the collection of more photons from the specimen from a thicker optical section. The image capture settings were 1,000 × 1,000 μm field of view (512 × 512 pixels), medium scan speed, 2 or 3 Kalman frame averaging. A Z step size of 2 μm (slightly oversampling in Z) was used to make the XY and Z pixel dimensions equal as a convenience for later image analysis and display (“orthogonal dimensions”). Our Leica SP1 confocal microscope is equipped with a Leica high speed, high resolution galvonometer based focus motor (“galvo-Z”). The galvo-Z enables high speed XZ scanning (at appropriate zoom) at the same speed as standard XY image scanning. The galvo-Z has a step size of ~0.040 μm, range of 160 μm and a mass limit of 90 g. For the purposes of this study, we used the Leica DMIRBE microscope internal focus motor, which has a nominal step size of ~0.100 μm.
Basic Leica SP1 microscope operations are described in a Web document by John Runions at the Haseloff lab (http://www.plantsci.cam.ac.uk/Haseloff/JohnRunions/Confocal_instructions/Confocal_instructions(old)/Confocal.pdf). The Haseloff SP1 system is on an upright microscope and uses different lasers than the CHLA system.
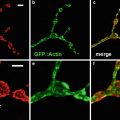
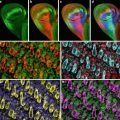
Mouse skin blood vessels were imaged by sacrificing the mouse pinching the skin and cutting the skin scissors. For this work, an approximately 25 mm piece of skin (with white hair), was imaged in a 25 mm Mattek glass bottom dish (P35G-1.5-20-C, http://www.glassbottomdishes.com) with a thin layer of PBS to improve optical contact to the coverglass. Tile scans were acquired with a Leica SP5/DMI6000 inverted confocal microscope (University of Miami). DiI perfused mouse skin blood vessels were acquired with a 561 nm laser, 10×/0.4 NA objective lens, 512 × 512 pixel images with 8 × 6 tile scan Z-series of 21 planes using 10 μm step size (200 μm thick). Non-confocal RGB transmitted light tile scans were acquired on the Leica SP5 microscope using 458, 561 and 633 nm laser lines for blue, green and red channels, respectively, using three scan track sequential frame mode (3× longer time than a single scan track). Because hemoglobin is the major absorbing molecule, in the red blood cells of the mouse that did not perfuse with DiI, we could have used any of the laser lines between 458 and 561 nm for the blue and green channels by applying a cyan lookup table, plus the 633 nm laser line for the red channel. This would have reduced scan time by one third (e.g., 90 min to 60 min for a 21 plane Z-series, 8 × 6 tile scan). For anyone performing transmitted light laser scanning diaminobenzidine and hematoxylin (DAB&H) tissue section slides, we recommend either the 405 or 458 nm laser line for DAB (blue channel) and 633 nm laser line for hematoxylin (green and red channels). Transmitted light laser scanning of hematoxylin and eosin (H&E) slides can performed with transmitted light 633 nm for hematoxylin, and either 488, 496, or 514 nm for eosin, with confocal fluorescence (520–560 nm) and/or non-confocal transmitted light detection (green and blue channel).
3.6 Immunofluo-rescence and Histological Processing of Tissue Sections
After brains were removed, bisected through the tumor, and imaged on the confocal microscope, they were processed, half for paraffin embedding (Zinc Fixative followed by 10 % formalin fixation) and half for frozen sections (4 % paraformaldehyde followed by 16 h in 30 % sucrose). Tissue for frozen sections were snap frozen in OCT embedding medium and maintained at −80 °C until sectioned. Hematoxylin and eosin stained sections were examined to note extent of tumor growth.
Immunofluorescence for CD31 and αSMA was performed on Zinc fixed paraffin-embedded sections. Five micrometer sections were mounted on Superfrost/Plus glass slides. After baking at 60 °C overnight, the slides were deparaffinized in xylene and rehydrated. For antigen retrieval, sections were boiled 12 min in Antigen Unmasking Solution (Vector Laboratories, Burlingame, CA). The sections were stained using anti-PECAM-1 (M-20) (Santa Cruz Biotechnology, Santa Cruz, CA) 1:100 and/or anti-Smooth Muscle Actin Clone 1A4 (DakoCytomation) 1:100 and incubated overnight at 4 °C. The secondary antibodies: Cy3-conjugated AffiniPure Donkey Anti-Goat IgG (Jackson ImmunoResearch Laboratories, Inc., West Grove, PA) (1:200) and Fluorescein (FITC)-conjugated AffiniPure Donkey Anti-Rabbit IgG (Jackson ImmunoResearch Laboratories, Inc., West Grove, PA) (1:200). Frozen sections were stained with purified rat anti-mouse CD31 (PECAM-1) monoclonal antibody (BD Pharmingen) 1:75 Biotinylated anti-rat IgG (VECTOR Laboratories, Burlingame, CA).
3.7 Immunofluo-rescence Microscopy of Tissue Sections
Tissue immunofluorescence images were acquired with a Leica Microsystems (Bannockburn, IL) DMRXA fluorescence microscope, Sutter Instrument Company (Novato, CA) LS 300 Xenon arc lamp with 1 m liquid light guide, Life Imaging Services (Reinach, Switzerland) LLG-DMRXA quartz lens coupler, Chroma Technology Corp. (Rockingham, VT) HQ filter sets for fluorescein (set 41001), Cy3 (41007a), and Cy5.5 (41022). The microscope was also equipped with a 61000v2 DAPI/Ffluorescein/Cy3 triple pass filter set for viewing specimens by eye, and was equipped with additional filter sets for other applications. The DMRXA was equipped with a Leica optovar with 1× (lensless), 1.25× and 1.6× magnifications. Images were acquired using 100 % light to an Applied Spectral Imaging Inc. (Carlsbad, CA) SKY™ SD-300/VDS-1300 spectral imager, 12-bit digital CCD camera, using EasyFISH software. The camera was usually binned 2 × 2 to improve the signal to noise ratio, and decrease image exposure time, of the fluorescence images. All images were saved in 16-bit/channel quantitative EasyFISH file format, and in standard 24-bit TIFF format. For microvessel density measurements, slides were scanned at low power (HC Plan 10×/0.4 lens) to identify areas of highest vascularity. Ten to 20 high-powered (HC Plan 20×/0.7 lens) fields were then selected randomly within these areas, and microvessel densities were calculated based on the number of CD31/biotinylated tomato lectin positive structures. Microvessel counting was performed by multiple blinded observers in conjunction with a pathologist. A pericyte-positive vessel was defined as a CD31-positive vessel surrounded by at least one cell staining positive for α SMA.
For whole-section tumor area quantitation, H&E or immunohistology slides were acquired with a Pathscan adapter (Meyer Instruments) on a Polaroid SprintScan 4000Plus 35 mm slide scanner [23, 42]. See ref. 21 for examples of Pathscanned U87MG orthotopic tumor implantation model mouse brain tissue sections.
3.8 LCSLite Software for Viewing Leica Confocal Microscope Datasets
Leica Microsystems generously granted us permission to include the LCSLite software on the book CD (also available for free download from ftp://ftp.llt.de/softlib/LCSLite/ and the newer Leica LAS AF Lite is available for free download at ftp://ftp.llt.de/softlib/LAS_AF_Lite/). LCSLite operates in Microsoft Windows. The oldest version of LCSLite, v2.0.0871, runs under Windows NT, 2000 and XP. The newer 2.50.1347a and 2.61.1537 only run on Windows NT and XP. Windows Administrator privileges are required for installation. For best results, install on a computer with a dual monitor display and identical monitors. After running LCSLite (or LCS if you are a Leica confocal customer), by default the two channels in the demonstration datasets will open as green and red. Right clicking on the image window will bring up a menu from which you can turn on the LUT control. Clicking on the LUT slider allows you to change to gray or other lookup table color schemes. We recommend grayscale. Positioning the cursor over a LUT slider (but not clicking) results in thumbs being displayed along the top and bottom of the LUT—these allow you to adjust the contrast of a LUT channel. We suggest pulling the upper thumb down to increase the brightness of the DsRed2 channel. The overlay button can be used to display the combined colors.
Leica confocal microscope images are saved in tagged image file format (TIFF) with Z-plane and channel information as part of the filename. For our demonstration datasets, channel 0 (ch00) is PMT1 (fluorescein) and channel 1 (ch01) is DsRed2. Individual TIFF files can be opened in Adobe Photoshop CS, NIH Image, ImageJ, MetaMorph and other image analysis software packages. For ImageJ, we recommend the MBF ImageJ bundle (http://www.macbiophotonics.ca/downloads.htm). For MetaMorph 6.25, we typically copy each channel set to its own subfolder, then use the Image Browser to open each channel as a separate stack. Some images were processed with Adobe Photoshop CS or MetaMorph 6.25 for publications.
3.9 Perfusion with DiI
The DiI labeling method [13] can also be applied to visualize blood vessels in the lungs or other tissues with the following procedure. An animal is killed by CO2 overdose or sodium phenobarbital overdose (120 mg/kg, i.p) and then placed on a perfusion stage, positioned on its back. The trachea is exposed and cannulated with a blunt needle of #21-G. Cardiac perfusion is carried out as described (Li et al. [13]), but starts from the right ventricle instead of the left one and drains by cutting the descending aorta instead of the right atrium. The DiI solution is 3 mL with 30 μl of DiI stock solution. After perfusion, lungs are fixed with 4 % paraformaldehyde through the #21-G needle by connecting it to a small reservoir through a line under 20 mm H2O intrapulmonary pressure (by raising the reservoir to 20 mm above the animal level) for 5–10 min. The lungs then are removed and submerged in 4 % paraformldehyde for 1 h. Tissue can be viewed directly under a fluorescence microscope to examine the surface vasculature. Thick vibratome sections (100 μm) are recommended to view vasculatures deeper than 100 μm from the tissue surface.
If perfusion fails with either tomato lectin or DiI, you can obtain useful information by transmitted light imaging, using hemoglobin absorption of the red blood cells, as your primary contrast. This is described in Subheading 3.5. The images will not be confocal optical sections, but you can still obtain useful information. We have successfully used RGB transmitted light mode Z-series tile scanning to acquire 200 μm thick Z-series from excised mouse skin.
When perfusing sacrificed mice, we encourage harvesting additional tissues and sharing them with colleagues interested in specific organs or tissues. You can contact your veterinarian about tissue sharing.
4 Results
Fluorescent labeled tomato lectin perfused blood vessels and DsRed2 fluorescent protein expressing tumor cells in hemi-sectioned mouse brains are readily visible by eye with a 10× objective lens and appropriate optics. The orthotopically implanted U87MG-DsRed2 human glioblastoma cell line tumors were typically imaged when 1–4 mm diameter. Foreknowledge of size was based on MicroMRI, Xenogen in vivo imaging data, and/or growth curves of the tumor model. Fluorescein-tomato lectin perfused blood vessels appear neon green to the eye when viewed through a Leica I3 (longpass green fluorescence) filter set; the DsRed2 tumor mass is opaque orange and the surrounding brain tissue is weakly green fluorescent. With the N2.1 filter set, DsRed2 tumors are bright orange-red, Texas Red-streptavidin–biotin-tomato lectin appears red (and is used with nonfluorescent tumors); Alexa Fluor® 647-streptavidin–biotin-tomato lectin vessels are crimson-red, normal brain tissue is dimmer orange. For tissue sections we often stain nuclei with both DAPI and To-Pro-3 since our confocal microscope does not have a UV laser for DAPI excitation; the former fluorophore is blue-white with the Leica A UV excitation/visible longpass emission filter set while To-Pro-3 is crimson-red with the N2.1 set and can be imaged by the confocal optics with the 568 and/or 633 nm laser lines; likewise, LysoTracker Red can be imaged with either the I3 or N2.1 filter sets and with 568 or 488 nm laser excitation. In the future, there may be value in perfusing vessels with both fluorescent-tomato lectin and cell permeable counterstains such as DAPI or Hoechst 33342/33258, SYTO dyes, LysoTracker, etc.
Choice of laser line(s), laser power(s), confocal beamsplitter (i.e., RSP500 vs. TD488/568/633), pinhole size, detector settings, and Z-step size, and Z-range (Z-series depth range) need to be optimized for each specimen type. If necessary, sequential scanning, i.e., with the Ar488 laser line with RSP500 beamsplitter (or RSP525, which often works better for green dyes), followed by HeNe633 with TD488/561/633 for NIR imaging, can be used. Sequential scanning may optimize fluorophore excitation and collection of emission photons but trades off by requiring longer exposure times. On the SP1 this is somewhat mitigated by keeping the spectral detection band passes the same, using PMT1 for short wavelength and PMT2 or 3 for long wavelength. With our visible light confocal microscope, fluorescent tomato lectin and DsRed2 tumor cell masses, freshly excised mouse brains that had been perfused to flush most of the red blood cells, could be imaged to a depth of between 100 and 150 μm. Other organs, i.e., liver, spleen, kidney, could be usefully imaged to a maximum depth of 60–100 μm. Two confocal microscope datasets of ex vivo brain tumor cells orthotopically implanted in a mouse brain are included with the book CD, along with the Leica LCSLite confocal software image viewer. The datasets were consecutive Z-series of 258 and 178 μm with 1 mm × 1 mm field of view. The Leica SP1/DMIRBE settings were: pinhole 1.0, Argon ion 488 nm laser line was used (12 o’clock laser power knob, 69 % AOTF), RSP500 reflection shortpass dichroic beamsplitter, PMT gains ~780, PMT1 wavelength range 502–537 nm, and PMT2 range 579–710 nm. The Leica LCS confocal acquisition software (not the free LCSLite software) includes cytofluorogram and spectral deconvolution processing options. We opted not to use these, but instead to use a relatively narrow PMT1 virtual band pass of 35 nm to acquire the fluorescein-tomato lectin images, and a well separated PMT2 band pass of 130 nm for the DsRed2 fluorescence.
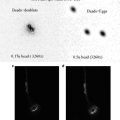
The accompanying DVD has a confocal dataset and the free Leica LCS Lite visualization software. The g60m07 top 01 data is a 258 μm Z-series, with maximum projections of fluorescein tomato lectin of blood vessels (Fig. 1) and DsRed2 fluorescence of human U87MG glioblastoma cells expressing hrLuc-RFP-TK tribrid fusion proteins (Fig. 2). Color overlays of maximum, average and triple view orthogonal projections, plus the entire Z series is on the CD. The CD also includes a movie (AVI format) of each channel, plus color overlay of the Z-series (false colored for better visualization) and a 360 rotating view. For comparison with classic histology, a Pathscan histology slide scan is also on the CD.


Fig. 1
Fluorescein tomato lectin in vivo labeling of blood vessels in human glioblastoma orthotopic implantation model. Maximum projection image of 1,000 × 1,000 × 253 μm volume Z-series (same volume as Fig. 2). Z-series starts from just inside the cut surface of a hemi-sectioned mouse brain. 100 μm scale bar
Fig. 2
DsRed2 red fluorescent protein expression detected in hrLuc-RFP-TK tribrid gene fusion vector transfected human glioblastoma cells previously orthotopically injected into a mouse brain. Maximum projection image of 1,000 × 1,000 × 253 μm volume Z-series (same volume as Fig. 1). Z-series starts from just inside the cut surface of a hemi-sectioned mouse brain. 100 μm scale bar
DiI perfusion of the lungs is describe in Methods (Subheading 3.9) and is adapted from [13]. DiI (lowest purity Sigma-Aldrich product) is less expensive than fluorescent tomato lectin. DiI is a member of a family of lipophilic carbocyanine fluorophores that are available in other excitation and/or emission colors: DiA, DiO, DiI, DiD, and DiR. The Di_ family have relatively broad excitation and emission spectra compared to many immunofluorescence fluorophores, e.g., Alexa Fluor 488 or Cy3, or to quantum dots, such as eFluor 605NC (eBiosciences, licensed from Evident Technologies) or QD625 (Invitrogen/Molecular Probes). The Di_ family is also characterized by different lipid lengths, which result in preferential localization to plasma membrane or mitochondria and endoplasmic reticulum. At University of Miami, we now use DiI nearly exclusively for blood vessel painting. We have not (yet) done so, but expect to be able to combine DiI blood vessel painting with immunofluorescence by using digitonin as a tissue permeabilizing agent—instead of Triton X-100 or saponin—based on the results of Matsubayashi et al. [43].
Related posts:
 Confocal Imaging of Fluorescently Labeled Proteins in the Drosophila Larval Neuromuscular Junction
 Reflecting on Confocal Microscopy: A Personal Perspective
 Imaging Tools for Analysis of the Ureteric Tree in the Developing Mouse Kidney
 Live Confocal Analysis of Mutant- and Drug-Treated Drosophila Embryos
 Evaluating Confocal Microscopy System Performance
 Laser Scanning Confocal Microscopy: History, Applications, and Related Optical Sectioning Techniques
Stay updated, free articles. Join our Telegram channel

Full access? Get Clinical Tree


