Fig. 5.1
(a–d) Factors determining early tissue enhancement. The lower parts of a–d show what occurs at the level of the capillary and the interstitial space after intravenous bolus injection; the upper parts graphically display the changes in signal intensity (SI) in a time-intensity curve. (a) The time interval between the intravenous bolus injection and arrival of the bolus in the capillary is determined by the injection rate, the heart rate, cardiac output, the localization of the lesion in the body, and the local capillary resistance (tissue perfusion). (b) The enhancement rate during the first pass of the contrast agent is determined by number of vessels (tissue vascularization), local capillary resistance (tissue perfusion), and capillary permeability. Tissues with high vascularization, perfusion, and capillary permeability (X) will enhance earlier and faster than tissues with a lower number of vessels, higher capillary resistance, and lower capillary permeability (Y). (c) After the first pass of the bolus, the SI increases further until the concentration of the gadolinium (Gd) contrast medium in the blood and the interstitial space of the tissue are equal. In tissues with a small (S) interstitial space, this equilibrium is reached earlier than in tissues with a larger (L) interstitial space. (d) As the arterial concentration of the contrast medium decreases, the SI drops, while the Gd is progressively washed out from the interstitial space. This process occurs faster in tissues with a small (S) interstitial space than in tissues with a large (L) interstitial space
5.1.2 Imaging Techniques
To study the early enhancement characteristics of a lesion with DCE-MRI, several factors have to be taken into account: type of sequence, selection and orientation of the imaging plane, number of slices, temporal resolution of the dynamic sequence, and spatial resolution of the images.
5.1.2.1 Sequence Parameters
As a rule, dynamic contrast-enhanced imaging has to be performed within the first 3 min after contrast injection: in this period of early intravascular and interstitial distribution, and large concentration gradients between these two compartments, important physiological information on tissue vascularization, perfusion, capillary permeability, and interstitial composition can be obtained. Due to the short distribution half-life of all water-soluble contrast agents and extravascular leakage of about 50 % of the contrast agent during the first pass, most of this information is not available after a few recirculations, when capillary and interstitial space concentrations reach equilibrium [1, 4–7].
In ideal circumstances, a multi-slice sequence, covering the whole lesion, with a moderate spatial resolution and high temporal resolution, should be used (e.g., 192 × 192 matrix; 2 mm in-plane resolution for each image in one multi-slice series with eight parallel slices, repeated every 1.6 s lasting for 2–3 min). Alternatively, a single-slice sequence through the most representative part of the lesion can be performed. Imaging with a high temporal resolution (e.g., for multi-slice DCE-MRI: one series of images per 3 s or less; for single-slice DCE-MRI one image per 3 s or less) is preferable in order to obtain at least three or four images or series of images during the first pass, but this is at the cost of spatial resolution and number of slices.
For single-slice DCE-MRI, fast or ultrafast MRI sequences using gradient echos such as turbo FLASH (Siemens; Erlangen, Germany), turbo field echo (TFE; Philips, Best, The Netherlands), inversion recovery (IR) prepared fast GRASS, and fast (multiplanar) spoiled GRASS [F(M)SPGR; General Electric, Milwaukee, USA] permit study of the earliest contrast enhancement kinetics with a sufficiently high temporal and satisfactory spatial resolution by rapid acquisition in the order of 1–3 s per image [34–36]. These so-called snapshot-imaging techniques are based on a gradient-echo sequence with a very short repetition and echo time (less than 10 ms). The present generation of MR units permit multi-slice snapshot dynamic studies with a temporal resolution of less than 3 s per image series and a matrix of at least 128 × 128 [2, 14, 31–33, 37, 38]. Frequently used multi-slice MRI sequences are TWIST (Siemens; Erlangen, Germany), 4D-THRIVE (Philips, Best, The Netherlands), and 3D-TRICKS [General Electric, Milwaukee, USA]
In dynamic MRI, the use of more than one average per acquisition should be avoided, as this decreases temporal resolution. Imaging with two (or more) averages per acquisition instead of one would lead to a loss of important temporal physiological information, which is now available on two (or more) images, obtained in the same time interval. Although fat saturation might be useful, e.g., by use of a selective-preparation radiofrequency pulse, in practice this is not done, as fat is adequately suppressed by most postprocessing techniques, e.g., in subtraction and first-pass images.
5.1.2.2 Selection of the Imaging Plane
The main disadvantage of the single-slice snapshot dynamic technique is that after bolus injection only one dynamic examination can be performed in the same patient (the examination cannot be repeated before all contrast is excreted from the body, i.e., at least 12 h) and that images for analysis are usually obtained at only one level [2, 41]. It is presumed that this section represents the contrast enhancement behavior of the entire lesion. Nevertheless, significant variations in enhancement have been described in different regions within musculoskeletal lesions [25]. Due to this nonuniform contrast enhancement, the single-slice technique is subject to sampling error. To minimize this inevitable sampling error, the different components of the lesion should be thoroughly evaluated on the precontrast T1- and T2-weighted images, to find an imaging plane which includes most components of the lesion. This preselection may provide a representative imaging plane in small and uniformly enhancing lesions. Nevertheless, the nonuniform contrast enhancement must be considered an important motivation for the use of multi-slice techniques that permit sampling the entire lesion [25, 41]. Inclusion of an artery in the imaging plane is useful to evaluate differences in time of onset of enhancement in various parts of the lesion, compared with the time of arrival of the bolus. Muscle tissue should be used as reference tissue for comparison with the lesion.
5.1.2.3 Imaging Procedure
In practice, one test snapshot image (single-slice DCE-MRI) or series of images (multi-slice DCE-MRI) should be obtained after preselection of a representative imaging plane. If the lesion and the regional artery are displayed well on this test image(s), the dynamic snapshot sequence can be started simultaneously with the bolus injection. During all acquisitions of the dynamic study, the transmitter and receiver gains should be held constant. Overall, the dynamic study should last for at least 3 min after bolus injection. The whole procedure lengthens the MR examination for about 5–10 min [2, 40]. To obtain high concentrations of contrast medium during the first pass, the bolus injection should be performed at an injection rate of 3–5 ml/s in the right antecubital vein, which is easily accessible and nearer to the heart than the left one: this causes less dilution of the bolus. To empty the contrast medium completely from the infusion line, the bolus should be followed immediately by a saline flush of about 20 ml at the same injection rate. At this rapid injection rates, no serious side effects have been observed [2, 14, 33, 38, 42]. As reproducibility is dependent on the injection rate and on the patient’s cardiovascular status, use of a power injector is preferable whenever repeat examinations are considered; e.g., for monitoring the effect of chemotherapy, a dynamic study should be performed before biopsy, during chemotherapy, and just before surgery [2, 14, 38, 43–45].
5.1.3 Evaluation and Postprocessing Techniques
After performing a dynamic study, a large number of images (up to 180) have to be evaluated qualitatively and/or quantitatively. Evaluation of a series of images obtained with dynamic contrast-enhanced MRI can be performed in different ways. Each technique has its own advantages and disadvantages.
5.1.3.1 Native Review Method
A simple, fast, but subjective, qualitative method is the “native review method,” in which an observer examines contrast enhancement sequentially on all images of the dynamic sequence. This can be done by viewing all images in “cine mode” on a console or simply by printing all images on a film and reviewing them one by one on a viewing box (Fig. 5.2). With this method, detection of small areas of enhancement or of areas with discrete enhancement may be difficult. Moreover, delineation of enhancing areas from fat and hemorrhage may be very difficult (Fig. 5.3). Therefore, it is preferable that the physiological information behind the dynamic MR images is extracted by postprocessing.


Fig. 5.2
Evaluation and postprocessing of a dynamic study with the “native review” and the “subtraction” method. In the native review method (top), the observer examines contrast enhancement sequentially on all images of the dynamic sequence. In the subtraction method (bottom), contrast enhancement is easily detected, as the first image (i.e., before bolus injection) is subtracted from all subsequent images of the dynamic study. In this way, only enhancing areas will be displayed on subtraction
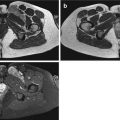
Fig. 5.3
(a–c) Indication of biopsy site on subtraction images. A 50-year-old woman with large soft tissue mass of the upper arm. Histological diagnosis of myxofibrosarcoma. (a) The coronal contrast-enhanced, spin-echo T1-weighted image (TR 600 ms, TE 20 ms) shows a soft tissue mass, predominantly of high signal intensity. There is an area of low signal intensity in the central part. (b) On the axial turbo spin-echo T2-weighted image (TR 3,873 ms, TE 150 ms), the mass has an inhomogeneous appearance and consists of areas of high and very high signal intensity. (c) Fast gradient-echo, dynamic contrast-enhanced subtraction image (turbo field echo; 0.5 T; TR 15 ms, TE 6.8 ms, TI 741 ms, flip angle 30°) reveals that only the periphery of the tumor shows (early) enhancement, whereas the central part lacks enhancement due to recent hemorrhage and necrosis. The solid areas at the periphery (arrows) should be attacked selectively to obtain a representative biopsy
5.1.3.2 Subtraction Method
A readily available qualitative method is the “subtraction method,” in which the first image of the single-slice DCE sequence or the first series of images of the multi-slice DCE-MRI sequence (i.e., before contrast injection) are subtracted from all subsequent images of the dynamic study [9, 30, 37] (Fig. 5.2). In this way, all (especially discrete, early, and small) enhancing areas are easily detected, and high signals from fat and hemorrhage are nullified (Figs. 5.3 and 5.4). Subtraction images are evaluated in cine mode on a console. Using this method, it is easy to evaluate the time interval between the onset of arterial and tumoral enhancement and to detect the most “active” parts in tumors, e.g., in order to indicate the best site for biopsy or to determine the degree of response to preoperative chemotherapy qualitatively [9, 30, 37] (Fig. 5.3). However, late-enhancing tissues such as fat and connective tissue may be hardly recognizable on early subtraction images (Fig. 5.3).

Fig. 5.4
(a–e) Detection of recurrent tumor. A 40-year-old woman with recurrence of a previously surgically treated synovial sarcoma around the knee. (a) Axial spin-echo T1-weighted image (TR 600 ms, TE 20 ms) at the level of the patella reveals a subcutaneous area of low signal intensity (arrow) abutting the femoral cortical bone. Differentiation of recurrent tumor tissue from granulation tissue is not possible. (b) Axial turbo spin-echo T2-weighted image (TR 4,587 ms, TE 150 ms) at the same level shows low signal intensity, which makes the possibility of local recurrence less likely. (c) Static contrast-enhanced, spin-echo T1-weighted image with fat-selective presaturation shows inhomogeneous enhancement of this area. It is not possible to discriminate between postoperative changes and recurrent tumor. (d) Subtracted, dynamic contrast-enhanced, gradient-echo image (turbo field echo; 0.5 T; TR 15 ms, TE 6.8 ms, TI 741 ms, flip angle 30°) at the same level, obtained 11 s after enhancement of the popliteal artery (arrowhead), shows intense enhancement of an area (arrow) that proved to be recurrent tumor after resection. Onset of tumoral enhancement was already visible on the subtraction image, obtained 3 s after arrival of the bolus in the artery. Notice the improved delineation of the lesion due to the nullified surrounding fat. (e) Corresponding time-intensity curves of artery (1), muscle (2), and recurrent tumor (3). The slope of the curve representing tumor parallels the arterial curve, indicating very high vascularization, perfusion, and capillary permeability. The early plateau phase is indicative of a small interstitial space in the tumor
5.1.3.3 Region-of-Interest Method
Another operator-dependent and more time-consuming but quantitative method is the region-of-interest (ROI) method [13, 19–21, 33]. In this method, signal intensities (SI) in one or more circular or freely determined ROIs are measured and plotted against time in a time-intensity curve (TIC; Figs. 5.4, 5.5, 5.6, and 5.7). Most often, ROIs encircling the whole lesion and the quickest-enhancing area are evaluated [13, 19–21, 33] (Fig. 5.8). An ROI positioned in a feeding artery (to see arterial input) and in a muscle (as reference tissue) should always be used to compare with the lesion. The area enhancing fastest can often be delineated easily after review of the native or subtraction images or from other postprocessing methods. Several types of TICs have been described [8, 31]. These TICs provide a graphic display of the early pharmacokinetics of the contrast agent during and immediately after the first pass (Figs. 5.1, 5.5, and 5.8). From these curves, quantitative information can be obtained: time of onset of enhancement (T start), slope (enhancement rate during the first pass, FP), maximum enhancement (E max), time to peak or maximum enhancement, and eventually negative slope (i.e., washout rate; Figs. 5.5 and 5.8). The time of onset of enhancement in a lesion (T start) can be measured relative to arterial enhancement. The difference in time between local arterial enhancement and tissue enhancement is mainly determined by tissue perfusion and thus indirectly by the local capillary resistance [33, 46]. The slope represents the maximum enhancement rate during the first pass and is mainly determined by tissue vascularization (i.e., number of vessels) and perfusion [2, 8]. However, capillary permeability may also play an important role [47]. During the first pass, approximately 50 % of the contrast agent (or even more in pathological tissues) enters the interstitial space [1, 4–7]. After the first pass, the concentration gradient and diffusion rate of the contrast agent drop immediately. The change in signal intensity is now mainly determined by the capillary permeability and the composition of the interstitial space (Fig. 5.1c). In tissues with a small interstitial space, a rapid equilibrium and even a washout of contrast will occur, whereas in tissues with a larger interstitial space, a further wash-in will still be going on (Fig. 5.1d) [8].


Fig. 5.5
Time-intensity curve (TIC). In a TIC, the temporal change of the signal intensity in a region of interest (ROI; or pixel) is plotted against time. At T start, when the bolus enters the ROI, the signal intensity rises above the baseline signal intensity (SIbase). The steepest slope represents the highest enhancement rate during the first pass (wash-in rate) and is mainly determined by tissue vascularization, perfusion, and capillary permeability. At T max, the time of maximum enhancement, capillary and interstitial concentrations reach equilibrium. The time period between the end of the first pass and the maximum enhancement is mainly determined by the volume of the interstitial space. The washout rate can be calculated from the negative slope of the curve. (a.u. arbitrary units, T time interval between SIend and SIprior)
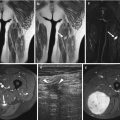
Fig. 5.6
(a–h) Fig. 5.6 g, h. Differentiation of capillary (high-flow) from cavernous (slow-flow) hemangioma with dynamic MRI. (a) On the T2-weighted spin-echo image of the right lower leg in a 10-year-old girl, the hemangioma is visible as a high signal intensity mass against the fibula (arrow). (b) The T2-weighted image of the left thigh in a 14-year-old boy shows a soft tissue lesion with a high signal intensity, corresponding to a large hemangioma (arrows). The spin-echo images do not allow differentiation of highly and slowly perfused hemangiomas. (c, d) On the TIC, the capillary hemangioma (c) has a high first-pass enhancement, indicating high perfusion, whereas the cavernous hemangioma (d) has a slow perfusion. (e) On the first-pass image (turbo FLASH; 1.5 T; TR 9 ms, TE 4 ms, TI 200 ms, flip angle 8°), the capillary hemangioma (arrow) appears as bright as the major arteries (arrowheads) due to high perfusion. (f) The cavernous hemangioma appears dark on the first-pass image due to slow perfusion (arrowheads). (g) A photomicrograph of the capillary hemangioma shows numerous capillaries in the highly perfused hemangioma (factor VIII stain, specific for endothelial cells). (h) A photomicrograph of the cavernous hemangioma shows numerous red blood cells in the large lumina of the cavernous vessels, indicative of slow perfusion (H&E)
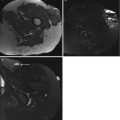
Fig. 5.7
(a–f) Tissue characterization with dynamic MRI. T2-weighted image (a, c, e) and TIC (b, d, f) in a 23-year-old woman with chronic osteomyelitis and a soft tissue abscess in the left thigh (a, b), in a 23-year-old woman with posttraumatic myonecrosis of the left deltoid muscle (c, d), and in a 77-year-old man with a myxofibrosarcoma of the left quadriceps muscle (e, f). Dynamic MRI does not allow differentiation of benign and malignant lesions, as some highly vascularized and perfused benign lesions [such as granulation tissue at the periphery of an abscess (b) or of posttraumatic myonecrosis (d)] have slope values in the same range as malignant tumors, such as undifferentiated pleomorphic sarcoma (formerly known as malignant fibrous histiocytoma) (f). All three lesions show an early and fast enhancement at the periphery, where the most “active” part of the lesion is located
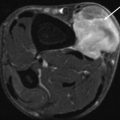
Fig. 5.8
(a–f) Monitoring chemotherapy with dynamic MRI. A 51-year-old man with inflammatory myxofibrosarcoma of the soft tissues in the cubital fossa before (a–d) and after (e, f) isolated perfusion with tumor necrosis factor-alpha. Histological response was good. (a) Sagittal turbo spin-echo T2-weighted image (TR 3,873 ms, TE 150 ms) before treatment shows a lobulated mass with a predominantly high signal intensity. (b) Fast, dynamic gradient-echo, gadolinium–diethyltriamine pentaacetic acid (DTPA)-enhanced subtraction image (turbo field echo; 0.5 T; TR 15 ms, TE 6.8 ms, TI 741 ms, flip angle 30°) acquired 3 s after arrival of the bolus of contrast medium in the artery (arrow). Early peripheral enhancement of the tumor is clearly shown (arrowhead). (c) TIC of the whole tumor (1), a fast-enhancing nodule within the tumor (2), and the brachial muscle (3). (d) TIC of the brachial artery (1), a peripheral, very fast, and early-enhancing tumor nodule, with early washout (2), and a central, more slowly enhancing area within the tumor (3). Note that the curve of the peripheral tumor nodule (2) parallels the arterial curve (1), indicating a very high vascularization, perfusion, and capillary permeability. (e) After therapy, there is an inhomogeneous residual mass with high signal intensity areas on the turbo spin-echo T2-weighted images. The degree of response to chemotherapy cannot be assessed on spin-echo images. (f) The dynamic contrast-enhanced gradient-echo images show delayed onset of enhancement of the tumor relative to the artery and to the first examination. No focal areas of early enhancement consistent with viable tumor can be seen. The corresponding TICs now show gradual enhancement of the whole tumor (2) relative to the artery (1), with absence of an early plateau phase or early washout, indicating decreased vascularization, perfusion, and capillary permeability. Histological response to chemotherapy was good
The main advantage of the ROI method is that quantitative data are available and that the early pharmacokinetics of the contrast agent in the lesion are visually displayed in a TIC (Figs. 5.1, 5.5, 5.6, 5.7, and 5.8). The ROI method has, however, some disadvantages: it is operator dependent, and only the selected regions are studied. Moreover, it is a time-consuming procedure, especially when several areas have to be investigated (Fig. 5.8). To overcome the main disadvantages of the ROI method, several groups of investigators have tried to develop fast, operator-independent postprocessing techniques that evaluate the physiological information on a pixel-by-pixel basis [2, 14, 16, 31, 48].
5.1.3.4 First-Pass Images
Another, rapid, largely operator-independent postprocessing technique that creates “first-pass images” focuses on the maximum enhancement rate during the first pass of the contrast agent, by calculating the first-pass slope value on a pixel-by-pixel basis, according to the equation (Fig. 5.9) [2, 14, 32, 33]:

 In this equation, SIbaseline represents the mean signal intensity in a pixel before arrival of the bolus; t is the time interval between the acquisition of two consecutive images with the largest change in signal intensity in a pixel (i.e., from SIprior to SIend) and corresponds to the temporal resolution of the dynamic sequence. By displaying the steepest slope value of all pixels with a grayscale value identical to the fastest enhancement rate, this method simultaneously provides quantitative and qualitative information in a new parametric image, the first-pass image (Figs. 5.6 and 5.10). In this way, the operator-dependent selection of different ROIs with the subsequent time-consuming calculation of the slope value from the TIC can be avoided. It was shown by radiological–pathological and angiographic correlation that these images depict tissue (micro) vascularization and perfusion very well [2]. However, a visual display of the early pharmacokinetics of the contrast agent, as observed on a TIC, obtained with the ROI method, is not available with this method (Fig. 5.6).

Fig. 5.9
First-pass images: postprocessing procedure. For each pixel of the dynamic image, the steepest slope of the TIC is calculated. This value represents the highest enhancement rate during the first pass. Subsequently, a single new image with the same matrix can be composed. The value of each pixel in this image is equal to the spatially corresponding first-pass slope value. This parametric image is therefore called the first-pass image [64, 65, 67]
Fig. 5.10
(a, b) Monitoring chemotherapy with first-pass images. (a) The coronal contrast-enhanced T1-weighted image shows inhomogeneous enhancement in a large myxofibrosarcoma after two cycles of chemotherapy. The degree of response cannot be assessed on the spin-echo images. (b) The first-pass image (turbo FLASH; 1.5 T; TR 9 ms, TE 4 ms, T1 200 ms, flip angle 8°) shows high first-pass enhancement rates in the arteries (arrowheads) and at the periphery of the tumor. Histologically, these fast-enhancing areas corresponded to residual viable tumor
A variant of this postprocessing method, “spatial mapping of instantaneous enhancement rates,” applies an exponential-fitting algorithm on a pixel-by-pixel basis to allow derivation of the initial slope of the TIC, in order to create parametric “slope images” [49]. Nowadays, many software packages create other parametric images in gray or color scale, displaying on a pixel-by-pixel base the physiologic information available from the TIC, such as the initial and delayed rate of contrast agent accumulation, the maximum enhancement, and the initial area under the contrast agent concentration–time curve (IAUC), which integrates the concentration of contrast agent observed in the tissue of interest over time [48, 72]. When normalized to surrounding normal tissue, IAUC has been demonstrated to parallel parameters of vessel permeability obtained using more complex mathematical modeling. One disadvantage of using IAUC is that the parameter represents a conglomerate of physiologic processes, including blood flow, blood volume, endothelial permeability, and the volume of the extravascular–extracellular space (EES). As a result, modeled parameters have the capacity to provide more physiologically meaningful information.
5.1.3.5 Pharmacokinetic Modeling Techniques
Quantitative approaches have the ability to produce measurements that reflect the physiologic and anatomic structure of the tumor microvasculature, blood flow, blood volume, endothelial permeability, and the volume of the extravascular–extracellular space. This is of great value for improving the characterization of tumors before treatment and for detecting the effects of new therapies on tumor vascular function. Quantitative approaches also offer the potential for development of more precise and reproducible measures, independent of scanner acquisition and tissue type. Such measures might then be used to guide treatment in individual patients or as surrogate markers of therapeutic efficacy in multicenter drug trials.
Quantitative assessment of the dynamic contrast enhancement can be performed with modeling techniques, which are usually based on a two-compartmental pharmacokinetic model with plasma space and extravascular–extracellular space (EES) [70–74]. After performing a baseline T1 mapping and acquisition of the DCE MR perfusion images, signal intensity data are converted to gadolinium concentration. Then the vascular input function is determined and the pharmacokinetic modeling can be done. With pharmacokinetic modeling of DCE MR perfusion data, several metrics are commonly derived: the transfer constant (k trans ), the fractional volume of the extravascular–extracellular space (v e), the rate constant (kep, where kep = k trans/v e), and the fractional volume of the plasma space (vp) [72, 73].
The most frequently used metric in DCE MR perfusion is k trans, which describes the transendothelial transport of low-molecular-weight contrast media in tissues: blood perfusion, transport of contrast agent across vessel walls (depending on capillary permeability), and diffusion of contrast medium in the interstitial space. It can have different interpretations depending on blood flow and permeability. When there is very high permeability (e.g., in synovial sarcoma), the flux of gadolinium-based contrast agent is limited only by flow, and thus k trans mainly reflects blood flow. In situations in which there is very low permeability (e.g., in fibrotic scar tissue and muscle), the gadolinium-based contrast agent cannot leak easily into the extravascular–extracellular space, and thus k trans mainly reflects permeability [74]. However, in many tissues and tumors, both blood flow and capillary permeability determine the value of k trans.
After transport across the vessel wall, the contrast medium also begins to diffuse into tissue compartments further removed from the vasculature, including areas of necrosis and fibrosis. Over a period typically lasting several minutes to hours, the contrast agent diffuses back into the vasculature (described by the rate constant kep) from which it is excreted by the kidneys. When capillary permeability is very high and the EES is small (e.g., in high-grade malignant soft tissue tumors with high cell density and small interstitial space), the return of contrast medium is typically quick, resulting in fast washout, even within the first 2 min. Contrast medium elimination from very slow exchange tissues, such as fibrosis or necrosis, occurs slowly, explaining the persistent delayed enhancement characteristic of some tumors [72].
5.1.3.6 Practical Guidelines
In practice, review of the native images, or preferentially of subtracted images, in cine mode, quickly provides information on the vascularization and perfusion of the lesion (e.g., to help characterize a lesion, to indicate the best site for biopsy, or to detect residual nests of viable tumor; Figs. 5.3, 5.4, 5.11, 5.12, and 5.13). TICs can be obtained by delineating the whole lesion, the fastest-enhancing area, a feeding artery, and a reference tissue (e.g., muscle; Figs. 5.4, 5.6, 5.7, and 5.13). These curves provide graphic information on perfusion, the wash-in rate, and eventually the washout rate. They can be used to calculate the steepest slope and to monitor chemotherapy. First-pass images and other pixel-by-pixel postprocessing techniques such as subtraction can be performed to evaluate all physiological information in one or only a few images (Figs. 5.4, 5.6, 5.10, 5.11, 5.12, and 5.13).

Fig. 5.11
(a–c) Monitoring chemotherapy with dynamic MRI. A 23-year-old woman with soft tissue metastasis of an osteosarcoma in the thigh before (a) and after (b, c) treatment with isolated limb perfusion with tumor necrosis factor-alpha. Histological response to chemotherapy was poor. (a) Axial turbo spin-echo T2-weighted image (TR 4,598 ms, TE 150 ms) shows inhomogeneous mass with areas of intermediate and high signal intensity. (b) Axial turbo spin-echo T2-weighted image (TR 4,590 ms, TE 150 ms) after therapy displays a large heterogeneous mass, mainly composed of high signal intensity areas with fluid levels compatible with hemorrhage and/or necrosis. However, the degree of response cannot be assessed on the spin-echo images. (c) Early dynamic gadolinium-enhanced, gradient-echo subtraction image (turbo field echo; 0.5 T; TR 15 ms, TE 6.8 ms, TI 741 ms, flip angle 30°) shows rapidly progressive enhancing areas (arrowheads) at the periphery of the mass, starting within 3 s after arterial enhancement (arrow). These early-enhancing foci corresponded to areas of highly cellular, residual viable tumor. The central part of the tumor lacked enhancement, corresponding to necrosis