Fig. 7.1
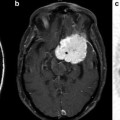
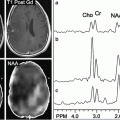
Example case of parametric dipole localization of somatosensory stimuli to the right lip (RLip) and right index finger (RD2). Multiple stimulus trials are performed for each site and cortical magnetic fields are recorded. The trials are averaged and a single dipole is reconstructed for each site using the least-square fit method. The resulting dipoles are then displayed on a coregistered, T1-weighted post-gadolinium coronal MR slice
Two major problems exist in dipole-fitting procedures. First, due to nonlinear optimization, there are problems of local minima when more than two dipole parameters are estimated. This problem is usually manifested by sensitivity to initialization and some subjectivity is involved in evaluating the validity of solutions. A second, more difficult problem in parametric methods is that these methods often require a priori knowledge of the number of dipoles. This information about model order is not known, especially in complex brain mapping conditions. While parametric dipole methods are ideal for point or focal sources, they perform poorly for distributed clusters of sources. Nevertheless, many studies to date using MEG have used dipole-fitting procedures to make inferences about cortical activity, especially those arising from primary cortical regions (e.g., visual, auditory, and somatosensory cortex).
Tomographic imaging is an alternative approach to the inverse problem. These methods impose constraints on source locations based on anatomical and physiological information that can be derived from information obtained with other imaging modalities. Anatomical MRI provides excellent spatial resolution of head and brain anatomy, and fMRI techniques provide ameasure of summated neural activation based on associated hemodynamic changes. This information can be used to improve solutions to the inverse problem. If we assume that the dominant sources in an MEG recording are the transmembrane and intracellular currents in the apical dendrites of the cortical pyramidal cells, then source image can be constrained to the cortex, which can be extracted from a coregistered volume MRI of the subject’s head. By tessellating the cortex into disjoint regions and representing sources in each region by an equivalent current dipole, the forward model relating the sources and the measurements can be written as a linear model with additive noise. Such a formulation transforms the inverse problem into a linear imaging method since it now involves the estimation of electrical activity at discrete locations over a finely sampled reconstruction grid based on discrete measurements. Nevertheless, this imaging problem, although linear, is also highly ill-posed because of the limited number of sensor measurements available in comparison to the number of elements used in the tesselation grid. Various solutions have been proposed for solving the tomographic imaging problem, but because there are many more unknowns to estimate simultaneously (source amplitude and time-courses) than there is sensor data, this problem also remains underdetermined.
Instead of simultaneous estimation of all sources, a popular alternative is to scan the brain and estimate source amplitude at each source location independently. It can be shown that such scanning methods are closely related to whole-brain tomographic methods, and the most popular scanning algorithms are adaptive spatial filtering techniques, more commonly referred to as “adaptive beamformers” or just “beamformers” [11]. Adaptive beamformers have been shown to be quite simple to implement and are powerful techniques for characterizing cortical oscillations. Although they are robust in dealing with moderately correlated sources, one major problem with adaptive beamformers is that they are extremely sensitive to the presence of strongly correlated sources. In the case of auditory and language studies, since auditory cortices are largely synchronous in their activity across the two hemisphere, these algorithms tend to perform poorly for auditory evoked datasets. Many modifications have been proposed for reducing the influence of correlated sources 12–14].
Adaptive spatial filters are particularly suited for time–frequency analyses of oscillatory activity, where coherent activity is assumed to be less of a problem across multiple frequency bands. Time–frequency analysis enables examination of the location, timing, and frequency band of induced oscillatory activity. Research tools such as NUTMEG (http://nutmeg.berkeley.edu) or Fieldtrip (fieldtrip.fcdonders.nl) can be used to perform five-dimensional imaging from MEG data. One may then observe the spatiotemporal patterns of oscillatory power fluctuations across the entire cortical mantle in relation to specific stimuli such as visual stimuli or speech production or motor tasks (see Fig. 7.2 below) [12, 15].


Fig. 7.2
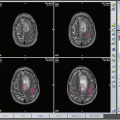
Shown above are the grand average reconstruction results for left index finger movement. The functional maps are superimposed on the MNI template brain and are statistically thresholded at p < 0.05 (corrected for multiple comparisons). In each panel, the crosshairs mark the spatiotemporal peak for the reconstructed source, with the corresponding spectrogram shown below it. The functional map plotted on the MRI corresponds to the time–frequency window highlighted on the spectrogram
Algorithms have also been proposed for simultaneous estimation of all source amplitudes. These solutions require that brain sources be specified either implicitly or explicitly in the form of probability distributions. In these cases the solutions often require a Bayesian inference procedure for estimating some aspect of the posterior distribution given the data and the priors. Recently, we showed that the many seemingly disparate algorithms for tomographic source imaging can be unified. Using a hierarchical Bayesian modeling framework with a general form of prior distribution (called Gaussian scale mixture) and two different types of inferential procedures, we also found that these algorithms are in some cases equivalent [16]. These insights allow the development of novel algorithms to incorporate and improve upon prior efforts in this enterprise.
Recent algorithms have shown that significant improvements in performance can be achieved by modern Bayesian inference methods that allow for accurate reconstructions of a large number of sources from typical configurations of MEG sensors [16–18]. Figure 7.3 shows source reconstructions of auditory evoked responses using one such novel algorithm, as well as reconstructions from popular benchmark algorithms for comparisons that highlight their poorer spatial resolution and sensitivity to correlated sources and noise.
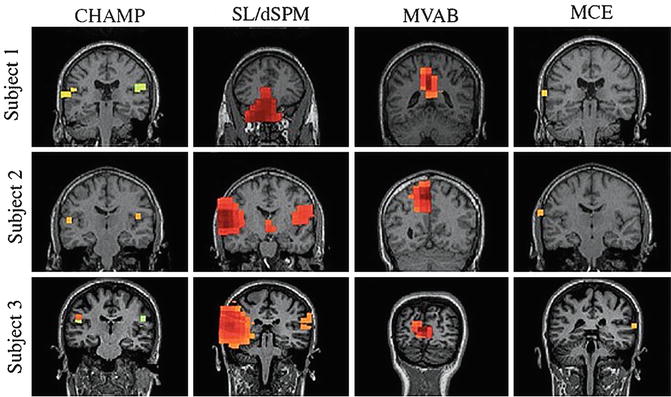

Fig. 7.3
Source reconstructions of auditory responses for three patients using four different algorithms. Champagne (CHAMP) is designed to estimate the number and location of a sparse set of flexible dipoles that adequately explain sensor data while also successfully reconstructing highly correlated sources. Standardized low-resolution brain electromagnetic tomography (SL) and dynamic statistical parametric mapping (dSPM) can localize the dipole but their area of activation is much more diffuse. Minimum variance adaptive beamforming (MVAB) is dependent on prior assumptions about source distribution and has difficulty reconstructing correlated brain activity such as bilateral auditory inputs. Minimum current estimation (MCE) produces focal estimates of dipoles, but with additional spurious peaks and bilateral activations outside of auditory cortical areas
Even though significant breakthroughs have occurred in the source reconstruction algorithm development effort, an enduring problem in MEG- and EEG-based imaging is that the brain’s response to sensory or cognitive events is small when compared to the numerous sources of noise, artifact (biological and nonbiological), and interference from spontaneous brain activity. Other sources of noise include Gaussian thermal noise and Gaussian electrical noise, both of which originate from the MEG or EEG sensors themselves. Background room interference from power lines and electronic equipment can also be problematic, as can biological noise such as heartbeat, eye blink, or other muscle artifact. Ongoing brain activity itself, including the drowsy-state alpha (~10 Hz) rhythm can drown out evoked brain sources.
All existing methods for brain source localization in MEG and EEG are hampered by these sources of noise. For example, the magnitude of the stimulus-evoked auditory cortical sources are on the same order as the noise on a single trial, so 75–200 averaged trials are typically needed to clearly resolve the sources. This requirement for repetition limits the type of research questions that can be asked and is prohibitive for examining processes such as learning that can occur over fewer trials. On a practical level, the multiple trials are time consuming, and it is difficult for a subject to hold still or pay attention throughout the experiment.
Noise in MEG and EEG data is typically reduced by a variety of preprocessing algorithms before being fed into source localization algorithms. One simple form of preprocessing is to filter out frequency bands not containing a brain signal of interest. Additionally and more recently, independent component analysis (ICA) has been used to remove artifactual components such as eye blinks [19, 20]. More sophisticated techniques have also recently been developed using graphical models [19]. Consequently, algorithms for source localization from MEG and EEG data typically use a two stage procedure—the first for noise/interference removal and the second for source localization. More recently algorithms that integrate interference suppression with source reconstructions have also been proposed and allow for robust source reconstruction [17, 18, 21].
Temporal and Spatial Resolution of MEG Imaging
Since MEG data can be acquired at a sub-millisecond timescale, temporal resolution of MEG imaging is only limited by the sampling rate (typically ~1 kHz). In principle, cortical oscillations can be observed up to 500 Hz. In contrast, determining the spatial resolution of MEG imaging is challenging because it is highly dependent on the reconstruction algorithm chosen, as well as variety of factors such as signal-to-noise and interference ratio, model formulation, forward-model accuracy, coregistration errors, and accuracy of priors. In general, the spatial resolution of MEG reconstruction is not limited by sensor spacing, because many adaptive methods can perform better than estimated based on spatial sampling criteria. For instance, while sensor spacing in many axial gradiometer systems is 2.2 cm, reconstruction accuracy can in some cases be as small as 3 mm. In general, coregistration errors alone can account for 3 mm of error in localization information for dipole-fitting procedures. While tomographic imaging algorithms, such as minimum-norm methods, have poor spatial resolution (on the order of a few centimeters), the spatial resolution of adaptive spatial filtering methods and tomographic reconstruction methods based on machine learning techniques are difficult to compute because these estimates depend on the data itself, as well as other factors such as data quality. As a rule of thumb, for typical datasets, these newer methods can reconstruct tens-to-hundreds of sources at about 5 mm distances (assuming time–frequency separation and detectability). This estimate can be considered an approximate spatial resolution for MEG, keeping in mind that under certain circumstances the spatial resolution can be even greater.
A common myth, related to the spatial resolution of MEG, is its lack of sensitivity to gyral crown activity and relative insensitivity to deep sources. While it is a fact that for single spherical volume conductor models MEG sensors are insensitive to radially pointing dipoles, this does not necessarily translate to gyral sources. It has been shown that, using realistic volume conductor models (such as boundary-element methods or multiple local-sphere models), some sensitivity to radial sources can be recovered, and that there is no predominant loss of sensitivity to gyral sources [22]. Furthermore, while there is a significant drop in sensitivity to deeper sources because their contributions will fall by approximately the square of the distance to the sensors. However, mid-brain sources present two additional problems. First, they may not have dipolar organization due to their architecture, although dipole approximation may not be inaccurate given the distance to the sensors. Second, the uncertainties in the lead-field increase for deep brain sources, making them more difficult to reconstruct. In general, recovery of deep sources is an issue of the signal-to-noise ratio. If high signal-to-noise ratio data are recorded, there is no inherent problem in recovery of deep sources with some of the newer Bayesian reconstruction methods.
Current Applications in Preoperative Neurosurgery
Epilepsy Surgery
Epileptic foci in patients with intractable epilepsy often lack obvious anatomic correlates. Accurate localization of the epileptogenic zone is essential for seizure-free outcomes after resection. Precise localization of normal functional areas is also critical when the surgical corridor is adjacent to eloquent cortices. The decision on the extent and location of cortical resection for epileptic foci can be difficult and therefore a multimodal approach is preferred. Decisions on the extent of resection outside of the actual lesion must take into account the balance between preventing postoperative neurological deficits and minimizing the volume of residual epileptogenic tissue. MEG is particularly useful for both patients with non-lesional epilepsy and those with large lesions [23–26], including mesial temporal lobe epilepsy [27].
Single epileptic spikes are defined as having duration of less than 70 ms. Localization of the epileptogenic zone involves manual identification of real interictal spikes from the averaged sensor data and subsequent calculation of the location and orientation of the associated ECD [8, 28–30]. One study with 455 patients demonstrated a sensitivity of 70 % for identifying abnormal interictal activity [28] and several studies have also shown MEG localization of interictal spikes can lead to favorable surgical outcomes [27, 31–33]. One disadvantage of this interictal spike localization approach is that it introduces a large amount of subjectivity from the manual visual inspection for interictal spikes (whether it is a real spike or non-epileptic origin).
Using an adaptive spatial filtering method, power changes in frequency bands associated with epileptic activity may be investigated and possibly provide a more accurate and objective methodology for preoperative evaluation with MEG. Epileptic spikes are primarily evident in the alpha, beta, and gamma frequency bands of MEG recordings (Fig. 7.4). Guggisberg et al. describe a unique algorithm using an adaptive spatial filtering method that isolates real epileptiform activity from these high frequency bands [34]. This technique initially involves manual identification of interictal spikes for MEG recordings followed by automated localization of the sources of the spike-locked power changes in the beta and gamma bands using an adaptive spatial filtering method. Transient increases seen in the beta and gamma power bands that were time-locked to interictal epileptic spikes may be used to reliably localize epileptogenic foci. While still subjective, the average power changes in the frequency bands offer an alternative localization method more robust than ECD models of single spikes. Furthermore, patients need to have a sufficient amount of interictal spikes in their recordings for effective preoperative evaluation.
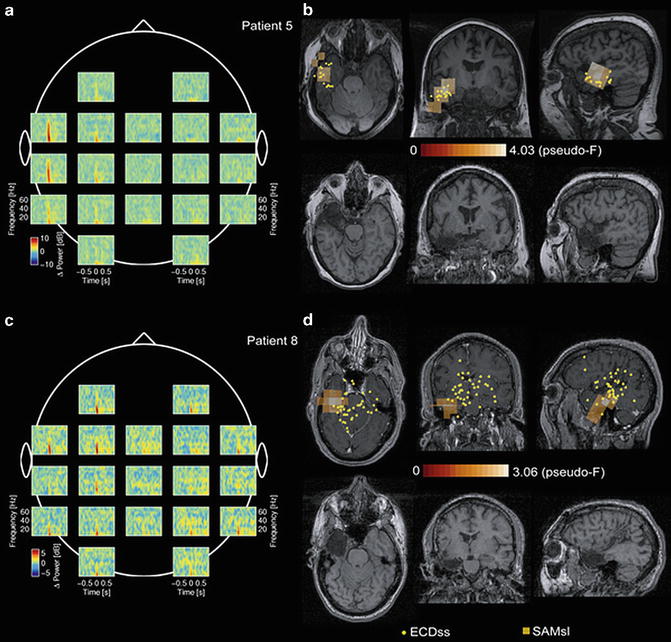

Fig. 7.4
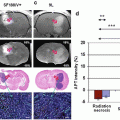
MEG results in two typical patients. (a, c) Short-time Fourier transforms reveal transient power increases time-locked to the peak of interictal epileptic spikes at 0 s in a broad frequency band ranging from delta to gamma rhythms, with high-frequency changes being more focal than low-frequency changes. (b, d) An adaptive spatial filter localizes spike-locked beta and gamma power increases (squares in upper row) to the zone that was later surgically resected (lower row), and, in case of patient 5, to the area of clusters of corresponding ECD (yellow dots). ECDs refers to equivalent current dipoles of single spikes; SpkFilt, spike-locked dual-state synthetic aperture magnetometry
Distinguishing whether generalized epileptiform discharges are from primary or secondary bilateral sources is an important decision-making factor for epilepsy surgery. Secondary bilateral synchrony is described as the rapid bilateral spread of epileptic activity from a focal cortical area of electrical abnormality. We demonstrated the usefulness of MSI in the evaluation of 16 patients with suspected secondary bilateral synchrony [35]. In this approach, interictal spikes were manually identified from MEG sensor recordings and the corresponding dipoles were fitted and visualized by MSI. This analysis revealed a unilateral, focal area of interictal spiking in the majority of patients and supported the decision to pursue resection in half of the patients.
While solitary anatomic lesions are highly prognostic of favorable seizure-free outcomes, the presence of multiple lesions can make decision-making highly complicated especially when scalp EEG is not well localizing. MSI has been applied successfully for localization in patients with multiple cerebral cavernous malformations [36]. One report found that MEG was useful in guiding the extended lesionectomy of surrounding abnormal cortex in cavernous malformations [37]. Similar results have been described for seizure localization in tuberous sclerosis patients with multiple tubers [38]. Overall, MSI is an important adjunct in presurgical decision-making for epilepsy surgery, especially when there was discordance between scalp EEG and anatomic findings on MRI.
Functional Mapping for Preoperative Planning for Tumors
Gliomas often infiltrate eloquent brain areas, and it is essential to consider their proximity in the presurgical planning for patients with brain tumors. Mass lesions can frequently distort normal neuroanatomy, which makes the identification of eloquent cortices inaccurate with normal neuroanatomical landmarks. MEG offers an added dimension for functional mapping in these patients [39–41]. This modality has been used for localization of the sensorimotor cortex along the central sulcus [42–45] as well as mapping the primary auditory [46, 47] and visual cortices [48].
The primary motor cortex and the sensory cortex are located on the anterior and posterior wall of the central sulcus, respectively. Identifying the hand region [42, 43, 49–51] and the mouth region [51, 52] of the primary sensorimotor cortex has been useful for presurgical evaluation, and also confirmed with intracranial direct cortical stimulation mapping.
Motor-evoked fields can be recorded by time-locking the MEG signal corresponding to movement [53], and single ECD fitting of the corresponding evoked field generated from the average sensor data [43, 49, 51, 52, 54]. Using this approach, Schiffbauer et al. compared MSI to intraoperative mapping in tumor patients receiving painless tactile somatosensory stimulation to the lip, hand, and foot and found that both approaches had a favorable degree of quantitative correlation [51]. Similarly, a favorable degree of quantitative correlation was also seen from utilizing dipole fitting with MEG versus fMRI [54]. Confirmed with ECOG, dipole fitting of evoked magnetic fields to median nerve stimulation proved to be superior to fMRI for 15 patients in identifying the sensorimotor cortex [43]. Following dipole fitting of the mouth motor cortex, ECS sites were usually anterior and lateral to MEG localization of the lip somatosensory cortex [52].
The use of MEG spatial filtering holds promise for a more robust method for mapping the motor cortex in presurgical patients [42, 50, 55]. The use of a spatial filter beamformer while subjects performed a self-paced index finger movement can generate high resolution imaging of the spatiotemporal patterns of premotor and motor cortex activity [55]. Peaks of the tomographic distribution of beta-band event-related desynchronization sources reliably localized the hand motor cortex in a group of 66 patients, which was confirmed with ECS [50] (Fig. 7.5).
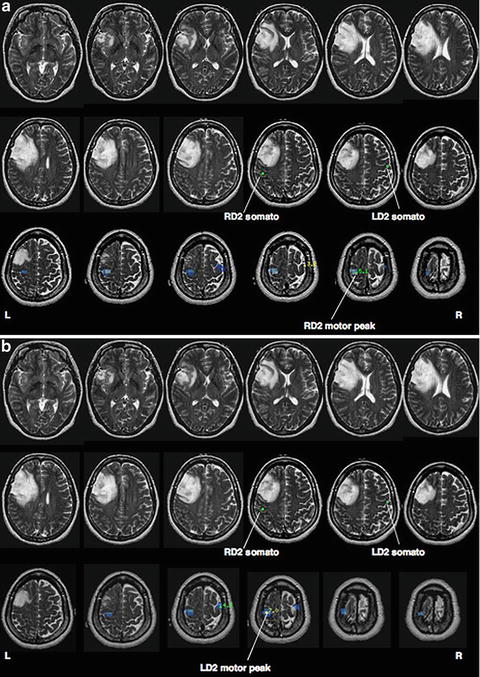

Fig. 7.5
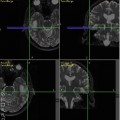
(a) Localization of β-band desynchronization preceding right index finger flexion for a subject with a frontal tumor. The location of hand motor cortex relative to a single dipole localization of hand somatosensory cortex is also shown. (b) Localization of β-band desynchronization due to left index finger flexion in the same subject, showing contralateral hand motor cortical activation in the right hemisphere
In pediatric patients as well, the pre-movement motor field component in average brain response was localized. In this case, motor field time-locked to electromyography onset was successfully localized to areas corresponding to the hand region in 95 % of cases (n = 10), which was confirmed with ECOG [42]. Furthermore, displacement of the sensorimotor cortex by space-occupying brain lesions does not seem to interfere with localization of the hand motor cortex [42, 50].
Future Applications
Lateralization of Language Function
Identification of a patient’s dominant hemisphere is crucial when the surgical site is located near presumed language cortex. Traditionally, hemispheric language dominance is evaluated by the Wada test, which is an invasive procedure. Furthermore, crossflow of amobarbital to the contralateral hemisphere through the circle of Willis can make results inaccurate. MEG offers a noninvasive and potentially a more accurate alternative for determining hemispheric dominance.
Using MEG, language laterality can be measured by determining the asymmetry of equivalent dipole sources between both hemispheres [56]. Using this approach, MSI and Wada tests were concordant in determining dominant hemisphere in 86 % of a group of 35 patients with high sensitivity and specificity [57]. Dipole sources of the late auditory evoked field components in both hemispheres can be determined while subjects undergo a recognition task for spoken words or listening to synthesized vowel sounds [56, 58]. The laterality of increased suppression of MEG activity in the 8–50 Hz range in the inferior frontal gyrus regions corresponded to the dominant hemisphere and was consistent with the Wada test among 95 % of the patients [59].
Stay updated, free articles. Join our Telegram channel

Full access? Get Clinical Tree


