Transport system
References
Divalent metal transporter (DMT1, also known as NRAMP-2 or DCT-1)
Transferrin–transferrin receptor system
Voltage-gated calcium channels
(44)
Store-operated calcium channels
(201)
Choline transporter
(202)
Homeric purinoreceptor
After reaching the brain or more precisely the interstitial fluid, manganese can enter neurons via calcium channels (30, 31). Furthermore, the transferrin–transferrin receptor system (32), the divalent metal transporter (DMT1) (33), and the dopamine transporter (DAT) (12) may be involved in neuronal uptake of manganese. In the absence of strongly elevated manganese levels, astrocytes serve as the major storage site and homeostatic regulator in the brain (34, 35). About 80% of the normal brain manganese is associated with cardiac astrocyte-specific GS (15). Intracellular Mn2+ is sequestered by the Ca2+ uniporter of the mitochondria, where over 97% of the Mn2+ is bound to membrane and matrix proteins (36). Mn2+ is transported out of the mitochondria via a very slow Na(+)-independent efflux mechanism (37).
Throughout the brain, manganese is heterogeneously distributed. In normal rats, manganese concentrations in increasing order have been observed in the cortex, striatum, hippocampus, and cerebellum ranging from 7.2 to 10.9 μmol/kg wet weight of tissue (10, 38). Mn2+ ions are axonally transported (39) and—similar to Ca2+—they are released into the synaptic cleft upon reaching a synapse and taken up by Ca2+ channels on the post-synaptic membrane (40, 41).
While the influx of manganese into the brain is at least partially mediated by carriers, no such way has been found for its efflux from the brain. Perfusion studies have shown that the rate of manganese efflux is consistent with its estimated diffusion rate (42), so that repeated exposure to manganese leads to an accumulation over time. The half-life time of manganese in the brain appears to depend on the applied dose. For low-dose exposures a half-life time of 51–74 days was reported for rats (43) and more than 100 days for monkeys (44). On the other hand, the exposure to high doses was found to be accompanied by a shorter persistence in the brain (45).
1.2 Toxicity of Manganese
Although manganese is essential for the normal functioning of a variety of physiological processes, this is only true for concentrations in the nanomolar range. Acute and chronic exposure to high concentrations is toxic and can result in a permanent neurological disorder known as manganism. Reported symptoms in human and nonhuman primates include Parkinson’s disease-like disturbances of motor function such as tremor, rigidity, bradykinesia, and clumsiness as well as cognitive and behavioral dysfunction (29).
At high concentrations manganese rapidly accumulates in myocardial tissues, so that acute manganese intoxication compromises cardiovascular function with the risk of acute heart failure (46). The mechanism of this toxic outcome seems to be related to the interaction of Mn2+ with cardiac calcium channels (8). Acute manganese exposure can also lead to irritation of the eyes, the skin, and the respiratory system (material safety data sheets (MSDS), Sigma-Aldrich). Table 2 summarizes the acute LD50 values for mice and rats for different routes of application, while Table 3 lists the toxic effects observed as a function of local manganese concentration. Tables 4, 5, and 6 demonstrate that MEMRI studies of mice, rats, and nonhuman primates often exceed these thresholds.
Table 2
LD 50 (in μmol/kg) for different routes of MnCl2 (acute exposure)
oral | ip | iv | im | sc | |
|---|---|---|---|---|---|
Mouse | 1.9 | 0.73 | 0.3 | 2 | 1.6 |
Rat | 7.5 | 0.7 | 0.7 | 5.5 |
Table 3
Toxic effects of manganese as a function of local concentration
Mn 2+ /μM | Effects | References |
|---|---|---|
10 | Alteration of electrocardiogram | (89) |
10 | No observed cytotoxicity in cell culture | (78) |
30 | Depression of the contractile function of the isolated heart | (91) |
100 | No significant alteration in neuronal cell culture | (98) |
100 | Death by cardiac arrest | (8) |
200 | Cardiac ventricular fibrillation | (89) |
500 | Increase of F2-isoprostanes in neuronal cell cultures | (98) |
>800 | Astrogliosis | (99) |
900a | Depression of visually evoked potentials | (161) |
1000 | Significant cytotoxicity in cell culture | (78) |
>1600 | Neuronal death | (99) |
>2700b | Death of retinal ganglion cells | (170) |
Table 4
MEMRI protocols for studies of mice
Admin. | Mn2+/μmol/kg #Local injection/μmol | Solution/mM | Volume (infusion/μL/min) | References |
|---|---|---|---|---|
iv | 45.5–884.3 | 120 | 0.4–7.4 mL/kg (4.2) | (121) |
40 | 100 | 0.4 mL/kg (3.3) | (159) | |
ip | 101.0–404.2 | 30 | 3.4–13.5 mL/kg | (206) |
333.5 | 100 | 3.3 mL/kg | (162) | |
200 | 4 | 50 mL/kg | (122) | |
sc | 1000 | 100 | 10 mL/kg | (126) |
160 | 320 | 0.5 mL/kg | (169) | |
ivc | 0.00125–0.0125# | 5–50 | 0.25 μL | (129) |
ic | 0.005# | 5 | 10 μL | (188) |
io | 0.8–1.8# | 800 | 1–2 μL | (168) |
0.06# | 120 | 0.5 μL (0.5) | (177) | |
0.05# | 200 | 0.25 μL | (161) | |
1# | 1000 | 1 μL (0.2) | (181) | |
0.0125# | 25 | 0.5 μL (0.1) | (171) | |
in | 0.7# | 10 | 7 μL | (160) |
15.6# | 3900 | 4 μL | (168) |
Table 5
MEMRI protocols for studies of rats
Admin. | Mn2+/μmol/kg #Local injection/μmol | Solution/mM | Volume (infusion/μL/min) | References |
|---|---|---|---|---|
iv | 2 × 450a–1 × 910b | 100 | 4.5–9.1 mL/kg (0.021) | (95) |
884.3 | 64 | 2 mL (0.03) | (109) | |
158.9–1399 | 120 | 1.3–11.7 mL/kg (0.0375) | ||
ip | 6 × 150 3 × 300c | 100 | 1.5 mL/kg 3.0 mL/kg | (95) |
ivc | 0.45# | 30 | 15 μL (0.25) | (110) |
ic | 1.25–2.5# | 25–50d | 25–50 μL | (123) |
0.002–0.012# | 10–60 | 0.2 μL | (110) | |
0.008# | 100 | 80 nL (0.5) | (99) | |
0.012–0.06# | 60 | 0.2–1.0 μL | (185) | |
0.2# | 1000 | 0.2 μL (0.05) | (187) | |
0.04# | 1000 | 0.04 μL | (186) | |
io | 0.1# | 1000 | 0.1 μL (0.2) | (169) |
0.15–0.30# | 50–100 | 3 μL | (170) | |
in | 10# | 500 | 20 μL | (173) |
10# | 1000 | 10 μL | (174) |
Chronic exposure to manganese is known to cause neurotoxicity. This process is mediated by oxidative damage to neuronal cells, disturbance of mitochondrial activity (47), changes in neurotransmission and glutamate-mediated excitotoxicity. Manganese accumulates in mitochondria, where it inhibits oxidative phosphorylation and leads to reduced ATP levels (48–50). In cell culture, manganese disturbs the function of astrocytes, hampering their ability to provide neurons with substrates for energy and neurotransmitter metabolism (51). Several studies demonstrate altered levels of glutamate (52–58), GABA (49, 56, 59–66), dopamine (49, 55, 67–74), and choline (75), although to a different extent and often with conflicting results. Part of the controversial findings may result from differences in dose, route of application, and duration of exposure (67). For a better comparison, it has been proposed to estimate the internal cumulative dose (ICDMn), which is the total amount of Mn2+ taken up into the circulatory system by the time the endpoint was detected (67). In rodents, ICDMn values of 80–120 μmol/kg affect the motor activity, while values of ICDMn ≥140 μmol/kg lead to alterations of neurotransmitter levels. This evidence confirms that the presence of manganese in the brain parenchyma affects the neurotransmitter metabolism in a dose-dependent manner at concentrations that are commonly used or even exceeded by MEMRI (Tables 4, 5, and 6).
2 Materials
2.1 MnCl2 Preparations
See Table 7.
Table 7
Commercial preparations of MnCl2 (Sigma Aldrich)
Name | Chemical formula | CAS number | Molecular weight | Product number | Purification |
|---|---|---|---|---|---|
Manganese chloride tetrahydrate | MnCl2 · 4H2O | 13446-34-9 | 197.1 g/mol | 63543 | >99% |
Manganese(II) chloride | MnCl2 | 7773-01-5 | 125.84 g/mol | 244589 (powder) 450995 (beads) 416479 (flakes) | >99% 99.999% 97% |
MnCl2 solution | MnCl2 | 7773-01-5 | 1.00 ± 0.01 M | M1787 | Prepared in 18 megohm water |
2.2 Solvents
1.
Deionized water.
2.
Isotonic (0.9%) NaCl solution (DeltaSelect, Pfullingen, Germany).
3.
Glucose solution (5%) (DeltaSelect, Pfullingen, Germany).
2.3 Chemicals for pH Adjustment
1.
Bicine (N,N-bis(2-hydroxyethyl)glycine, C6H13NO4) (Sigma Aldrich, Taufkirchen, Germany).
2.
Sodium hydroxide solution (1 M), NaOH (Sigma Aldrich, Taufkirchen, Germany).
3.
Sodium bicarbonate, NaHCO3 (Sigma Aldrich, Taufkirchen, Germany).
4.
Tris-HCl (10 mM) (Sigma Aldrich, Taufkirchen, Germany).
2.4 Opening of the Blood–Brain Barrier
D-Mannitol solution (C6H14O6, 25%) (Intramed, Port Elizabeth, South Africa).
2.5 Pain Treatment
Novaminsulfon (Metamizole) (Winthrop, Mülheim-Kärlich, Germany).
2.6 Pumps and Cannulae
1.
Syringe pump: Cole-Parmer Instruments, IL, USA; Model 2681 (Harvard Instruments, MA, USA).
2.
Pressure-controlled picospritzer (Parker Hannifin, OH, USA).
3.
Micro-osmotic pumps: Alzet (Durect Corporation, Cupertino, CA, USA).
4.
MRI-compatible intrabrain cannulae (Plastics One, Inc., Roanoke, VA, USA).
3 Methods
3.1 Administration of Manganese
3.1.1 Manganese Solutions
Although manganese can exist in multiple oxidation states, physiological conditions emphasize Mn2+ and Mn3+. Under in vitro conditions, Mn2+ can be oxidized to Mn3+ by superoxide radicals (76). Mn3+ is more reactive and toxic than Mn2+ (47, 62). The failure to detect significant amounts of Mn3+ within the brain mitochondria by X-ray absorption near edge structure (XANES) spectroscopy suggests that Mn3+ only occurs as a transient state (77). Repetitive intraperitoneal exposure of rats to equimolar doses of Mn2+ and Mn3+ using Mn(II)Cl2 and Mn(III)pyrophosphate, respectively, revealed significant higher blood and brain concentrations after Mn3+ than after Mn2+ exposure (62). However, little is known about the distribution and possible interconversion of Mn2+ and Mn3+ in the brain. Because of its lower toxicity and biochemical similarity to Ca2+, only Mn2+ has hitherto been utilized for MEMRI.
In most cases, Mn2+ is administered as an aqueous solution of MnCl2. The salt or the solutions are provided by many manufacturers. Table 7 summarizes products from Sigma Aldrich, Germany. It should be noted that the amount of MnCl2 administered to an animal is often given in mass units. To calculate the corresponding load of Mn2+ in molar units, the different molecular weights of MnCl2 (125.84 g/mol) and MnCl2·4 H2O (197.92 g/mol) have to be taken into account.
In situ perfusion techniques revealed a greater influx rate of 54Mn citrate into the brain than of 54Mn chloride. The use of pH 8.6 buffer-treated MnCl2 which has a higher affinity to transferrin leads to a significantly lower brain manganese concentration in comparison to the use of MnCl2 in Tris-HCl at pH 7.4. Only little is known of how different manganese salts and solvents may affect the MR contrast. So far, MEMRI studies almost exclusively employ MnCl2 dissolved in deionized water, 5% glucose solution, or 0.9% NaCl solution.
For parenteral applications of Mn2+, the injected solution should be biocompatible with the organism or tissue of interest. This refers to parameters such as concentration, chemical characteristics, applied volume, and sterility. For example, the osmolarity of most extracellular body fluids is about 300 mOsM. Because MnCl2 consists of 3 ions, a 100 mM MnCl2 solution would result in an isotonic solution. Manganese solutions in distilled water with a lower (higher) concentration are hypotonic (hypertonic). Although iso-osmolarity should be achieved whenever possible to minimize the occurrence of cell necrosis, minor deviations are less critical for intravenous and intraperitoneal injections, because of the large ratio of the target to the injected volume and the expected rapid mixing. For subcutaneous and intracerebral injections, however, strictly isotonic solutions have to be prepared to avoid pain and tissue damage. For MnCl2 concentrations below 100 mM this condition can be easily achieved by adding sodium chloride. For example, a 10 mM MnCl2 solution that corresponds to 30 mOsM would have to be dissolved in a 270 mOsM solution of NaCl to reach 300 mOsM.
Another aspect is the pH of the solution. Unbuffered aqueous solutions of MnCl2 are slightly acidic. Although this may be compensated by plasma or extracellular physiological buffer systems, the pH should be better controlled by adjustment to values near 7.4 using sodium hydroxide or by preparing manganese solutions with a buffer like bicine or Tris-HCl.
Besides pH and osmolarity the toxicity of manganese depends on the local concentration (Table 3). In cell culture, a direct cytotoxic effect of concentrations as low as 1 mM MnCl2 has been reported, but not for MnCl2 concentrations of 10 μM (78). The lowest possible concentration for MEMRI, however, is limited by the amount of manganese required to yield sufficient contrast in the target region and the tolerable solution volume. Table 8 summarizes the recommended maximum injection volumes for different routes of application. For subcutaneous injections the administration of manganese may be distributed to several locations in order to reduce local concentrations (see Note 1).
Table 8
Recommended maximum injection volumes for mice and rats
Volume/mL | Volume/mL | Volume/mL/kg bw | ||||
|---|---|---|---|---|---|---|
sc | im | icv | ic | ip | iv | |
Mouse (30 g) | 0.5 | 0.03 | 0.01 | 0.01–0.03 | 50 (1.5) | 5.0 (0.15) |
Rat (250 g) | 2.0 | 0.25 | 0.1 | 20 (5.0) | 5.0 (1.25) | |
3.1.2 Routes of Manganese Administration
Delivery of Mn2+ to the central nervous system may be achieved using three different routes: (1) systemic applications with manganese entering the brain via the blood, (2) direct intracerebral or intraventricular injections, and (3) nostril administration. For systemic applications, the common routes are intravenous, intraperitoneal, and subcutaneous injections. In principle, oral applications are also possible, but less well controlled as absorption from the gastrointestinal tract can be influenced by many factors. These include the chemical form (79), the presence of other minerals and dietary constituents (33, 80, 81), and the age of the animal (82–84). Furthermore, adaptive changes to high dietary manganese intake lead to reduced absorption and enhanced hepatic (biliary) or pancreatic excretion of manganese (19, 85–88).
A major advantage of the intravenous application is the fast delivery to the systemic circulation. This is utilized for activity-induced MEMRI where the accumulation of MnCl2 in conjunction with a brief opening of the BBB may be related to brain activity during stimulation. On the other hand, intravenous bolus injections of manganese can lead to a high transient blood concentration and bear the risk of altered heart function. In fact, injections of 0.01 mmol/kg Mn2+ over 30 s in dogs and rabbits caused prolongation of PR and QTc intervals in the electrocardiogram, while 0.2 mmol/kg Mn2+ led to ventricular fibrillation (89). Intravenous infusion of 3.6 μmol/min Mn2+ in rats resulted in a drop in blood pressure (90) and Mn2+ concentration of 30 μM caused immediate depression of the contractile function in isolated, perfused rat hearts (91). Considering a volume of manganese distribution of about 1.16 L/kg (23) this local concentration corresponds to a bolus injection of 0.035 mmol/kg Mn2+. In general, the cardiac side effects can be markedly reduced by slow infusion rates, which lower the transiently high extracellular manganese level in the myocardium. Examples for intravenous injections of MnCl2 are given in Tables 4, 5, and 6. The most often used veins in rodents are the tail vein and the femoral vein with a recommended needle size of 27 G for rats and 30 G for mice.
Only few groups used an arterial route for the administration of manganese (92) without differences from intravenous injections (90). No significant distinctions in temporal and regional T 1 changes were reported for subcutaneous, intraperitoneal, and intravenous injections (93, 94). The best way of administration therefore depends on the desired temporal resolution (e.g., subcutaneous injections significantly delay the peak plasma concentration), the manganese concentration (e.g., intravenous injections allow for higher concentrations, but hold a high risk of heart failure), and other practical considerations (e.g., in mice, intraperitoneal injections are much easier to perform than intravenous injections).
To reduce the acute toxicity of manganese, while retaining its potential as an MRI contrast agent, a fractionated application may be helpful (95). In rats, repeated doses of 0.15 mmol/kg Mn2+ every 48 h yielded a better signal enhancement than a single administration of 0.15 mmol/kg, indicating accumulation of manganese in the brain. A single administration of the cumulative dose revealed a stronger T 1 shortening at the expense of higher acute toxicity.
Only few studies attempted to quantitatively determine the manganese concentration in the brain after systemic administration (45, 96, 97). In rats, 1 day after a single 1.4 mmol/kg Mn2+ injection, the respective brain concentrations were about 0.11 mM in the olfactory bulb and 0.06 mM in the cortex (45), which correspond to a range in which no toxic effects were seen in cell cultures (98). On the other hand, a single subcutaneous injection of 1.8 mmol/kg Mn2+ significantly increased the occurrence of biomarkers for cerebral oxidative damage (98).
A direct and localized injection of manganese into the central nervous system allows for a marked reduction of the total amount of applied manganese (Tables 4, 5, and 6). To minimize possible artifacts due to tissue damage, the manipulation should be as minimally disruptive as possible. This includes a proper choice of the needle size, infusion duration, injection volume, pH value, osmolarity, sterility, and concentration of the manganese solution. For rodents, Hamilton syringes (0.5–2.5 μL) or pressurized controlled picospritzers with a needle size of 32 G and smaller are recommended (99). Examples of recent protocols for intracerebral and intraventricular injections are given in Tables 4, 5, and 6. Although the total manganese burden for the organism is lower than that of a systemic administration, the induction of local cytotoxic effects should be kept in mind (Table 3). Primary cultures of cortical neurons that were exposed to 0.5 mM MnCl2 for 2 h showed significant increases in F2-isoprostanes, which are markers for oxidative stress, while a fivefold lower concentration of 0.1 mM MnCl2 did not cause significant alterations (98). For a range of volumes and concentrations, histological investigations of rats 1 week after MnCl2 injection into the brain revealed thresholds for MnCl2 toxicity at the injection site of 16 nmol for neuronal death and 8 nmol for astrogliosis in a tissue volume of 8–11 μL (99). Notably, most protocols for intracerebral injection exceed these values, so that a reduction of toxic side effects remains an ongoing research goal. One approach may be the use of micro-osmotic pumps that constantly infuse manganese into a targeted brain area for a period of about 48 h (99).
3.2 Magnetic Resonance Imaging
3.2.1 Manganese-Induced Reductions of T1
As with many other MRI contrast agents, Mn2+ ions shorten both the T 1 and T 2 relaxation times of the surrounding water protons. The extent of T 1,2 reduction depends on the local Mn2+ concentration and can be described by
![$${R_i}\big(\big[{\textrm{M}}{{\textrm{n}}^{2 + }}\big]\big) = {R_i}(0) + {r_i} \times \big[{\textrm{M}}{{\textrm{n}}^{2 + }}\big],$$](/wp-content/uploads/2017/02/A184233_1_En_28_Chapter_Equ1.gif)
where R i = 1/T i (i = 1, 2), [Mn2+] is the Mn2+ concentration in mM, R i ([Mn2+]) is the R i at this concentration in s−1, and R i (0) is the native R i without manganese ([Mn2+] = 0).
![$${R_i}\big(\big[{\textrm{M}}{{\textrm{n}}^{2 + }}\big]\big) = {R_i}(0) + {r_i} \times \big[{\textrm{M}}{{\textrm{n}}^{2 + }}\big],$$](/wp-content/uploads/2017/02/A184233_1_En_28_Chapter_Equ1.gif)
([1])
The specific Mn2+ relaxivities r i (i = 1, 2) in s−1 mM−1 have extensively been studied (45, 97, 100–105). In water, the very short rotational correlation time of Mn2+ ensures an almost constant value for r 1 of about 7–8 s−1 mM−1 (100, 103), while r 2 increases with field strength from 40 s−1 mM−1 at 0.47 T to 120 s−1 mM−1 at 9.4 T (100, 103, 104). Under in vivo conditions the intracellular binding of Mn2+ to macromolecules causes a much higher r 1 of about 60 s−1 mM−1 for magnetic fields below 1 T (100, 102, 103). This effect is lost at higher fields of 4.7 T and above, where the in vivo r 1 approaches the value for aqueous Mn2+ (45, 97, 101).
For the range of concentrations used in MEMRI studies and for field strengths greater than 4.7 T where r 1 is similar for intra- and extracellular manganese, the linear proportionality of the R 1 relaxation rate to the manganese concentration may be exploited to estimate the absolute amount of manganese present in tissue (45).
3.2.2 Optimization of T1 Contrast
Due to the paramagnetism of Mn2+ and the fact that the native T 1 relaxation time of tissue water protons is much longer than the T 2 relaxation time, low concentrations of Mn2+ are best visualized by MRI sequences yielding T 1 contrast (45). Thus, the majority of MEMRI studies relies on T 1-weighted images and quantitative maps of T 1 relaxation times.
For a conventional spin echo (or gradient echo) MRI sequence, the signal equation is given by

with ρ 0 the spin density, TR the repetition time, and TE the echo time (for gradient echo MRI R 2 has to be replaced by R 2*). Unfortunately, R 1 and R 2 have opposite effects: while a shortening of T 1 leads to a signal enhancement, a shortening of T2 causes a signal decrease. In order to optimize the contrast, the shortest possible echo time will be the best choice. This depends on experimental parameters such as the receiver bandwidth, desired resolution or matrix size, and maximum gradient strength of the MRI system. If the use of an echo time with TE << T 2 minimizes the effect of the T 2 signal attenuation, then equation [2] simplifies to


([2])

([3])
Using equations [1] and [2], the signal difference of a region before and after manganese application can be described by
![$$\begin{array}{ll}&S(\textrm{TR},[M{n^{2 + }}],{R_1}(0))\\ &\quad= {\rho _0} \cdot \big(\big(1 - {e^{ -{\textrm{TR}} \cdot (r_1 \cdot [M{n^{2 + }}] + {R_1}(0))}}\big) - \big(1 - {e^{ - {\textrm{TR}} \cdot {R_1}(0)}}\big)\big)\end{array}$$](/wp-content/uploads/2017/02/A184233_1_En_28_Chapter_Equ4.gif)
![$$S\big(\textrm{TR},\big[M{n^{2 + }}\big],{R_1}(0)\big) = {\rho _0} \cdot \left(1 {-} {e^{ -{\textrm{TR}} \cdot \big(r_1 \cdot \big[M{n^{2 + }}\big]\big)}}\right) \cdot {e^{ - {\textrm{TR}} \cdot {R_1}(0)}}.$$](/wp-content/uploads/2017/02/A184233_1_En_28_Chapter_Equ5.gif)
![$$\begin{array}{ll}&S(\textrm{TR},[M{n^{2 + }}],{R_1}(0))\\ &\quad= {\rho _0} \cdot \big(\big(1 - {e^{ -{\textrm{TR}} \cdot (r_1 \cdot [M{n^{2 + }}] + {R_1}(0))}}\big) - \big(1 - {e^{ - {\textrm{TR}} \cdot {R_1}(0)}}\big)\big)\end{array}$$](/wp-content/uploads/2017/02/A184233_1_En_28_Chapter_Equ4.gif)
([4])
![$$S\big(\textrm{TR},\big[M{n^{2 + }}\big],{R_1}(0)\big) = {\rho _0} \cdot \left(1 {-} {e^{ -{\textrm{TR}} \cdot \big(r_1 \cdot \big[M{n^{2 + }}\big]\big)}}\right) \cdot {e^{ - {\textrm{TR}} \cdot {R_1}(0)}}.$$](/wp-content/uploads/2017/02/A184233_1_En_28_Chapter_Equ5.gif)
([5])
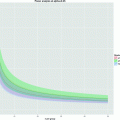
Thus, the TR for maximum signal enhancement becomes a function of the manganese concentration and the native T 1 of the tissue water protons: The higher the local manganese concentration for a given R 1(0), the shorter the TR that gives the best signal difference between pre- and post-contrast conditions and the higher the pre-contrast R 1(0), the shorter the optimal TR and the lower the signal gain by a given manganese concentration (Fig. 1).
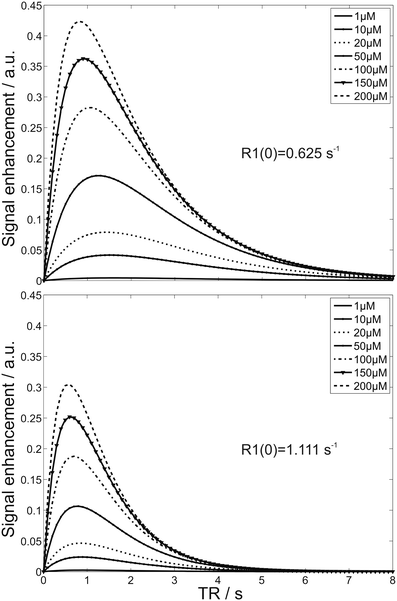

Fig. 1.
Simulated MEMRI signal enhancement as a function of repetition time TR for two different native relaxivities R 1(0) and a wide range of Mn2+ concentrations (assuming TE << T2). For details see text.
However, there is no general answer to this optimization problem as the choice of parameters always needs to reflect the actual scientific question and the experimental setting. The latter not only involves the parameters of a particular MRI sequence, for example, TR and flip angle for FLASH, but also depends on the local T 1 change, the applied amount of Mn2+, and the time point of the measurement relative to the Mn2+ administration (see Note 2).
3.3 MEMRI of Brain Anatomy
After systemic application, manganese accumulates in many tissues including liver, pancreas, kidney, heart, and brain (106, 107). Region-specific enrichments in the brain may be used to delineate the neuroarchitecture in rodents (108–110), nonhuman primates (97, 111–114), birds (115–117), and insects (118, 119).
3.3.1 Time Course of MEMRI Signal After Systemic Mn2+ Administration
MEMRI findings after systemic administration need to consider modulations by the manganese pharmacokinetics and the transfer into the brain. Manganese exhibits a high blood clearance with an elimination half-life time of 1.83 h after intravenous administration in rats (23). Already 5–10 min after the beginning of a manganese infusion in rats, the MRI signals of structures outside the BBB start to increase (109). This process leads to high manganese concentrations in the choroid plexus, pituitary gland, and pineal gland after about 1 h (97, 107, 120). Additional strong signal enhancements can be found in the veins and subarachnoid space (97, 121). After about 2 h, the signal from the parenchyma surrounding the ventricles presents with an increasingly strong signal enhancement, while the signals from the vasculature and subarachnoid space start to decline (97, 109) (Fig. 2). Interestingly, in rats, a Mn2+ infusion rate of about 32 μmol/h resulted in a signal enhancement of the entire CSF between 10 min and 2 h after administration (109), whereas a slightly lower rate of 14 μmol/h Mn2+ failed to yield a signal increase of the CSF in rats and marmosets (97).
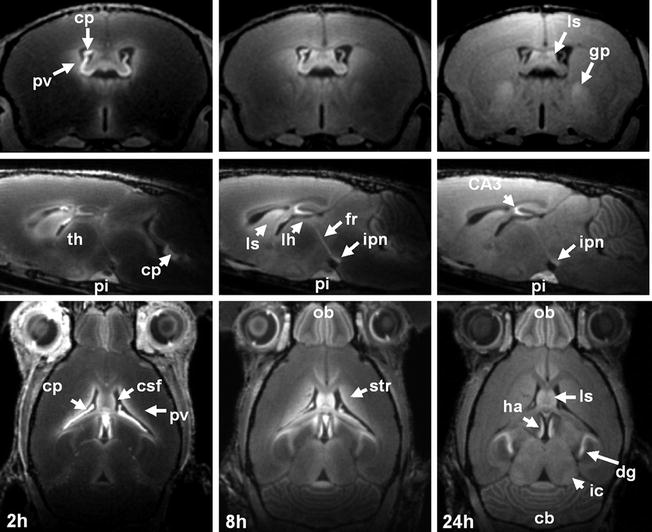

Fig. 2.
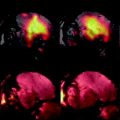
(Top) Axial, (middle) sagittal and (bottom) horizontal MEMRI sections of a mouse brain in vivo 2, 8, and 24 h after intraperitoneal injection of 320 μmol/kg MnCl2 (9.4 T, 100 μm isotropic resolution). Cb, cerebellum; cp, choroid plexus; CSF, cerebrospinal fluid; dg, dental gyrus; fr, fasciculus retroflexus; gp, globus pallidus; ha, habenula; ic, inferior colliculus; ipn, interpeduncular nucleus; lh, lateral habenula; ls, lateral septum; ob, olfactory bulb; pi, pituitary gland; pv, periventricular tissue; str, striatum; th, thalamus.
The initial enhancement of the choroid plexus and the subsequent enhancement of the periventricular tissue indicate that the BCB is the main delivery route of manganese into the brain, at least for a systemic administration at higher than physiological doses. Between 2 and 24 h after administration, manganese distributes into other brain areas accompanied by a gradual MRI signal increase (108, 121). The maximum tissue enhancement is observed about 24 h after application (122) (Fig. 2) and persists for about 24–48 h followed by a slow recovery to pre-contrast baseline over 2–3 weeks (108, 121, 123).
The clearance of manganese from the brain is rather slow. After intravenous infusion of 1.4 mmol/kg MnCl2 in rats, the value of ΔR 1 and the absolute manganese concentration in the brain peaked at day 1 and subsequently declined to near control levels after 28–35 days with an estimated brain half-life time of 11–12 days (from ΔR 1) and 15–24 days (based on manganese concentration as determined by inductively coupled plasma–mass spectrometry) (45). A radioactive 54MnCl2 analysis, however, revealed a threefold longer brain half-life time of 51–74 days (43) indicating a long terminal elimination phase. Moreover, intravenous injection of 54Mn even led to a gradual increase of manganese in some brain areas until day 6 after administration (107). 54Mn studies of rhesus monkeys yielded a half-life time of more than 100 days (44, 124) for very low doses of the radioactive tracer, different from MEMRI, which relies on higher doses. The difference between these two types of studies may indeed be explained by saturation effects of manganese-binding sites (45), which result in a faster clearance rate for high doses. This view is further supported by a study where 54Mn excretion after intramuscular injection was accelerated by increased dietary manganese (125).
For longitudinal MEMRI studies, it is important to consider potentially confounding effects from preceding injections of MnCl2. The presence and time course of a residual signal enhancement strongly depends on the region of interest, the accumulated local amount of manganese, and the sensitivity of the applied MRI sequence. In addition, preceding manganese injections may have caused neurotoxicity with accompanying cellular and/or behavioral abnormalities that may hamper subsequent measurements.
3.3.2 Spatial Distribution of Manganese
Figure 2 shows axial, coronal, and sagittal MEMRI sections of a mouse brain in vivo 24 h after intraperitoneal injection of 0.32 mmol/kg MnCl2. These T 1-weighted images confirm the heterogeneous distribution of manganese in the brain. A closer look at the olfactory system in Fig. 3 reveals a signal enhancement in the glomerular layer and mitral cell layer, which are well separated from the less-enhanced granular layer and even darker external plexiform layer. This pattern can already be observed 2 h after a subcutaneous administration of 0.07 mmol/kg MnCl2 (121). As shown in Fig. 4, the hippocampus presents with a bright signal in the dentate gyrus and CA3 region, whereas CA1 can hardly be separated from the less-enhanced subiculum. In the cerebellum, the granular layer exhibits a pronounced signal enhancement, which becomes even stronger in the layer formed by Purkinje cells (Fig. 5). In the developing cerebellum, a correlation between manganese uptake and granule cell density has been reported (122).
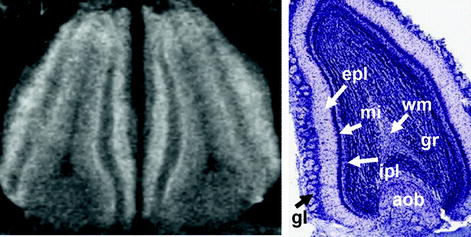
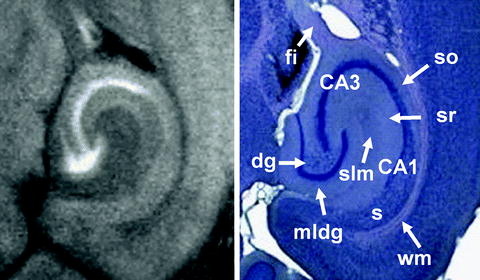
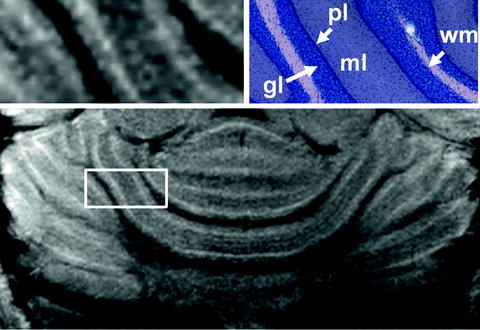

Fig. 3.
(Left) Magnified horizontal MEMRI section of a mouse olfactory bulb in vivo 24 h after intraperitoneal injection of 320 μmol/kg MnCl2 (9.4 T, 30 × 30 × 300 μm3 resolution) and (right) corresponding Nissl stain (http://www.brainmaps.org/). aob, accessory olfactory bulb; epl, external plexiform layer; gl, glomerular layer; gr, granule layer; ipl, inner plexiform layer; mi, mitral cell layer; wm, white matter.

Fig. 4.
(Left) Magnified horizontal MEMRI section of a mouse hippocampal formation in vivo 24 h after intraperitoneal injection of 320 μmol/kg MnCl2 (30 × 30 × 300 μm3 resolution) and (right) corresponding Giemsa stain (http://www.brainmaps.org/). Dg, dental gyrus; fi, fimbria hippocampi; mldg, molecular layer of the dental gyrus; s, subiculum; slm, stratum lacunosum moleculare; so, stratum oriens; sr, stratum radiatum; wm, white matter.

Fig. 5.
(Top) Magnified view and (bottom) overview of a horizontal MEMRI section of a mouse cerebellum in vivo 24 h after intraperitoneal injection of 320 μmol/kg MnCl2 (9.4 T, 30 × 30 × 300 μm3) and (right) corresponding Giemsa stain (http://www.brainmaps.org/). Gl, granular layer; ml, molecular layer; pl, Purkinje cell layer; wm, white matter.
The combination of high-resolution MRI, for example, corresponding to 100 × 100 × 100 μm3 in mice and 50 × 50 × 750 μm3 in rats, with Mn2+ doses equal to or higher than 0.7 mmol/kg (109, 121) allows for a detection of cellular layers in the cerebral cortex. In particular, an increased MRI signal is observed in regions corresponding to layer II, the transition region of layers IV and V, and layer VIb, whereas layers I, III, and VIa are much less enhanced (109). This heterogeneous distribution across layers of the cerebral and piriform cortex has been exploited for an in vivo characterization of different mouse mutants (110, 126, 127). Moreover, the more pronounced shortening of T 1 in the primary visual cortex (V1) relative to the secondary visual cortex (V2) in common marmosets enabled the in vivo delineation of the V1/V2 border (114).
The underlying causes for the differential distribution of manganese in the brain are still a matter of debate. Nevertheless, some mechanisms are generally accepted to contribute to the signal pattern. A major aspect is the location of a structure relative to the ventricles. This is because Mn2+ predominantly passes the BCB with uptake across the choroid plexus for the high plasma concentrations as used in MEMRI (128). Studies using radioactive 54Mn have shown that the manganese influx in the cerebral cortex is nearly saturated for plasma concentrations of 2–7.5 μM, but the influx into the hippocampus and other regions close to the ventricular system increases with increasing plasma concentration (26). In agreement with these considerations, marmosets showed a strong enhancement in the visual cortex, which in this species is rather close to the lateral ventricles, whereas the frontal cortex due to its distance from the ventricles showed no significant enhancement (see Note 3).
A second relevant aspect is the axonal transport of manganese. For example, the distinct manganese accumulation in the globus pallidus 24 h after administration is most likely due to the anterograde transport of Mn2+ from the striatum (gp and str in Fig. 2) (111, 112). Similar evidence for anterograde transport exists for the habenular complex (lh and fr in Fig. 2) (129).
Further parameters influencing the cerebral pattern of manganese are the cell density and neuronal activity (130). For example, strong signal enhancements are observed for the mitral cell layer in the olfactory bulb and the Purkinje cell layer in the cerebellum, which possess high neuronal densities. Moreover, the degree of neuronal activity has been shown to alter the manganese accumulation (see Section 3.4). In addition, the density of voltage-gated Ca2+ channels (VGCC) may play a role. Overexpression of N-type VGCC in rats with optic neuritis was accompanied by a strong manganese-induced signal enhancement (131), which could significantly be reduced by treatment with ω-conotoxin GVIA, an N-type specific blocker (132). Furthermore, excitotoxicity in brain ischemia is characterized by enhanced Ca2+ influx. Consequently, ischemic lesions exhibited a marked signal enhancement after administration of manganese (133).
The effects supporting MEMRI are also related to the function of cGMP-gated channels (134). Comparison of dark-adapted and light-adapted rats revealed a higher uptake of manganese in the outer retina of the dark-adapted group, which is expected to develop higher cGMP levels resulting in a higher Ca2+ influx. Another factor is the presence of manganese-binding enzymes such as GS and Mn-SOD. For instance, the observation of T 1 hyperintensities after mild ischemia in rats and humans was accompanied by endogenous manganese accumulation and Mn-SOD and GS induction in reactive astrocytes (135). Moreover, in the late phase of mild hypoxic-ischemic injury and following the administration of manganese in rats, MRI revealed enhanced gray matter lesions that correlated with increased immunoactivities of GS and Mn-SOD (136). Manganese-induced signal enhancements were also found to be co-localized with high concentrations of activated microglia (137, 138). Although suggestive, it should be noted that these correlations do not represent a final proof that the MRI findings directly or exclusively reflect the accumulation of manganese-binding proteins.
Attention should also be paid to the fact that the brain uptake of manganese (and respective signal enhancements) may be modulated by other metals. For example, low iron or calcium may result in a higher manganese uptake (80, 139). Conversely, the intravenous administration of ferric hydroxide–dextran complex and a high iron intake may reduce the brain manganese level (80). Furthermore, the amount of manganese in the animal chow may influence its clearance rate, whereas a disturbance of manganese excretion by the liver may lead to manganese deposits in the brain (140). Manganese homeostasis may also be altered in animal models of human brain disorders such as schizophrenia, Alzheimer’s disease, or Parkinson’s disease (141) (see Notes 4 and 5). Finally, in humans but not in animals, a gender difference has been reported for manganese absorption (142).
3.4 MEMRI of Brain Function
3.4.1 Physiological Basis
Another application of MEMRI is the mapping of functional brain activity in response to an external stimulus. This ability is based on the fact that Mn2+ may behave similar to Ca2+, which accumulates in neurons or astrocytes in an activity-dependent manner. In contrast to other functional MRI approaches that exploit the blood oxygenation level-dependent (BOLD) effect or detect changes of cerebral blood flow (CBF) or volume (CBV), MEMRI does not rely on hemodynamic responses but activity-related changes in calcium flux.
There are three gates for Ca2+ uptake into a cell: (1) the VGCC, (2) the ligand-gated nonspecific calcium channels (e.g., the ionotropic glutamate receptors NMDA and AMPA), and (3) the receptor-activated calcium channels (RACC) for which two main types have been described, the store-operated calcium channels and the intracellular messenger-activated nonselective channels (143, 144).
Because Mn2+ and Ca2+ have the same charge and rather similar ionic radii of 89 and 114 pm, respectively, they behave similarly in many biological systems. In experiments with synaptosomes of rat brain, it was shown that Mn2+ can enter the pre-synaptic nerve endings via VGCC and even induce the release of dopamine from the depolarized nerve terminals (30). Moreover, in the absence of extracellular Ca2+, Mn2+ increased the frequency of acetylcholine release from parasympathetic nerve endings during stimulation (145). In frog, the influx of Mn2+ (and Mg2+) into neuromuscular junctions was reduced by verapamil, an L-type VGCC blocker (31). Diltiazem, another L-type VGCC blocker, attenuated the signal enhancement in several MEMRI experiments (146–148). Besides VGCC, NMDA receptors also seem to play a role in Mn2+-dependent MRI signal changes. Application of NMDA antagonists such as MK-801 resulted in signal suppression, whereas NMDA agonists such as glutamate and NMDA increased the MEMRI signal in rats. On the other hand, NBQX, an AMPA antagonist, did not influence the signal enhancement in MEMRI experiments (94).
Mn2+ may also act as a competitive substrate of calcium transporters. MnCl2 reduced the Ca2+ uptake and calcium-dependent sodium efflux of intact squid axons (149) and Mn2+ accumulated during hyperkalemic hypoxia in perfused rat myocardium via Na+/Ca2+-exchanger-mediated transport (150). The ability of Mn2+ to mimic Ca2+ has also been confirmed by the quenching of fluorescent calcium indicators following Mn2+ entry into various cell types (151).
Further evidence for the pertinency of MEMRI to measure neuronal activity comes from studies of c-fos expression. C-fos is an intermediate early gene and its mRNA and protein expression is a widely used functional marker of activated neurons in the CNS. MEMRI signals due to hypothalamic activation, which was induced by intracarotid arterial hypertonic NaCl infusion, correlated well with c-fos expression (152). However, the apparent manganese accumulation during osmotic stress may not only be due to calcium channels. For instance, the DMT1 receptor and transferrin iron transport system seem to be further involved. Furthermore, cGMP-gated channels (134) as well as other metal transporters have to be taken into consideration.
Despite their similarities, Ca2+ and Mn2+ control different biological functions and, in contrast to Ca2+, manganese can also be converted into other oxidation states. It has several similarities to iron including a similar ionic radius, oxidation states 2+ and 3+ under physiological conditions, and similar binding affinities to transferrin. It is therefore of utmost importance to further understand all factors contributing to the cellular uptake of Mn2+ before MEMRI may be used as a quantitative marker for Ca2+ fluxes (see Notes 4 and 5).
3.4.2 Short-Term Activity-Induced MEMRI
In order to map functional brain activity by MEMRI within a temporal range of seconds to minutes, MnCl2 is intravenously or intra-arterially infused, while the stimulus of interest is applied. The mechanism relies on local increases of brain activity that lead to corresponding accumulations of Mn2+, which in turn cause a signal increase in affected regions. To achieve a sufficiently high manganese level under these conditions, the BBB needs to be opened. Typically, infusion of a concentrated solution of D-mannitol (∼25%) into the bloodstream yields a temporary osmotic disruption of the BBB (92, 153). The potential drawbacks of this technique are the long persistence of manganese inside the cells and the risk of the strong hyperosmolarity of the applied mannitol solution. Thus, initial increases in activation can be visualized, but further variations or deactivations cannot be resolved.
Short-term activity-induced MEMRI is usually performed on anesthetized animals, so that the depth of anesthesia will influence the functional contrast. Deep anesthesia reduces neuronal activity, whereas light anesthesia may lead to competitive brain activity without relation to the stimulus. To control for such confounding effects, it was suggested to perform four sets of measurements (92): The first after starting MnCl2 infusion but before mannitol injection, the second after bolus injection of mannitol to estimate the Mn2+ accumulation caused by nonspecific effects, the third during functional stimulation, and the fourth after the end of MnCl2 infusion and stimulation. However, additional complications may arise from different narcotic drugs and their putative modulations of manganese uptake and transport. For example, ketamine, an NMDA receptor antagonist, can reduce the signal enhancement by manganese (94), while isoflurane depresses its transsynaptic transport (41).
So far, short-term activity-induced MEMRI has been applied for mapping activation of distinct brain areas by pharmacological substances such as KCl (154), NaCl (155), glutamate (90), amphetamines, and cocaine (148) as well as in response to electrical forepaw stimulation (148, 156) and barrel activation (157). A comparison of MEMRI, CBF, and BOLD activations due to forepaw stimulation revealed a well co-localization of the respective maps in the somatosensory cortex. Interestingly, the strongest T 1 shortening was observed in cortical layer IV exhibiting a high cell density, while BOLD MRI resulted in stronger activations near the cortical surface close to draining veins (156).
A few brain regions allow for a sufficient manganese accumulation without opening the BBB in a relatively short period of less than 3 h. In mice, these regions are adjacent to the third ventricle and include nuclei of the hypothalamus. Respective MEMRI studies have been performed on fasted and non-fasted mice as well as in response to anorexigenic agents (158, 159). Another well-accessible region is the olfactory bulb. The delivery of MnCl2 directly into the nasal cavity leads to a signal enhancement in the olfactory bulb via uptake by the nasal epithelium and axonal transport. This approach has been used to visualize odorant representation in the glomerular and mitral cell layer (146, 160).
3.4.3 Long-Term Activity-Induced MEMRI
A second approach to activity-induced MEMRI relies on the fast influx and slow efflux of manganese into the brain and utilizes the cumulative signal change over several hours or even days. The assessment of functional brain activation involves a comparison of two groups of animals, one with and the other without stimulation or treatment. Typically, a stimulus is applied over several hours and MEMRI is performed 24 h after systemic Mn2+ administration. Differences in the signal enhancement between the groups are interpreted as stimulus response. Because anesthesia is only necessary during MRI, the approach yields maps of accumulated activity from awake and behaving animals. However, the longer the time between Mn2+ injection and MEMRI, the more axonal transport may influence the results: areas with high Mn2+ uptake may lead to signal enhancements in axonally connected areas independent of their own activity (161). To reduce such transport effects, shorter stimulation periods of only 9 h have been suggested (162). Due to the low manganese accumulation, this strategy is at the expense of sensitivity, especially in areas remote from the ventricles. Therefore longer periods of stimulus exposure have also been employed (163).
Stay updated, free articles. Join our Telegram channel

Full access? Get Clinical Tree


