Fig. 1.
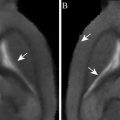
Subject preparation. (a) Preparation of the home-made mask (1), the jacket (2), the cloacal temperature probe (3) and the pneumatic sensor (4) to measure the respiration rate of the bird. (b) Anaesthesia of the bird and fixation of its head with the circular antenna (5). (c) Positioning and fixation of the Helmholtz coil (6) which includes the headphones. The tube providing the warm air blown over the bird to maintain its temperature constant is visible on the left side of panel c (7).
3.2 Data Acquisition
1.
Acquire a set of one sagittal, one horizontal and one coronal gradient echo (GE) scout image (tri-pilot sequence) and sets of horizontal, coronal and sagittal multi-slice images (piloting RARE sequence) to determine the position of the brain in the magnet.
2.
Decrease the noise of the gradients by increasing their ramp times to 600 μs.
3.
Prepare the fMRI sequence: RARE T 2-weighted sequence – effective TE, 60 ms; TR, 2000 ms; RARE factor, 8; FOV, 16 mm; matrix size, 64 × 32; slice thickness, 0.75 mm; 15 continuous slices (see Note 7).
4.
Select the auditory protocol (auditory stimuli and timing of stimulus delivery) in the presentation software (see Note 8).
5.
Run the auditory protocol and the fMRI sequence.
6.
Zero-fill the data to 64 × 64 using trapezoid interpolation.
7.
Take a first look at the results using the functional tool of ParaVision (option Processing/Functional Imaging…) (see Note 9).
8.
Run an anatomical 3D RARE T 2-weighted sequence – effective TE, 60 ms; TR, 2000 ms; RARE factor, 8; FOV, 16 mm; matrix size, 256 × 128 × 64.
9.
Zero-fill the data to 256 × 256 × 256 using trapezoid interpolation.
3.3 Data Processing
1.
Convert the data into Analyze or Nifti format.
2.
Adjust the voxel size in the heading of the files by multiplying the real voxel size by 10 (see Note 10).
3.
Realign the fMRI data.
4.
Co-register the anatomical 3D dataset to the zebra finch atlas (see Note 11). Apply the transformation matrix to the fMRI dataset.
5.
Smooth the data with a 0.5-mm width Gaussian kernel.
6.
Carry out statistical voxel-based analyses using SPM5. Model the data as a box-car (no haemodynamic response function) (see Note 12). Estimate model parameters with the classical restricted maximum likelihood algorithm. Compute the mean effect of each auditory stimulus in each subject (fixed-effect analysis) and then compute classical statistics as wished for group analyses (mixed-effect analyses).
7.
Project the parametric statistical map onto the zebra finch atlas to localize the functional activations (Fig. 2).
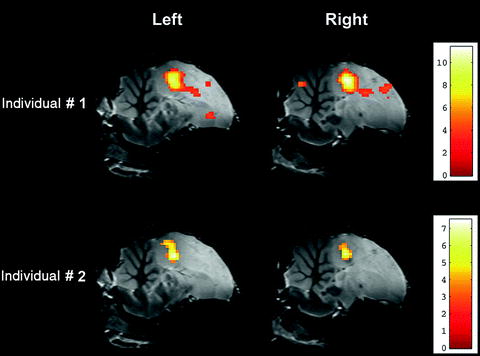
Fig. 2.
Superimposition of parametric statistical maps (unilateral t-test) coming from two individuals on the zebra finch atlas. The maps correspond to the comparison ‘ON’ vs. ‘OFF’ (i.e. ‘all stimuli’ vs. ‘rest periods’) and illustrate the bilateral activation of the equivalent of the mammalian auditory cortex in the avian brain. Only voxels in which the t-test was found significant (uncorrected p-value < 0.001) are colour-coded (the correspondence between colours and t-values is indicated by the colour bar).
4 Notes
1.
The choice of the species is of course dependent on the scientific question. However, other considerations like bird robustness to anaesthesia may also be taken into account. A safe minimal number of individuals is 15. This number takes into account the sensitivity of spin echo fMRI (see Note 7) and the natural inter-individual variability of biological phenomena measured in the experiment.
2.
 Volumetry and Other Quantitative Measurements to Assess the Rodent Brain
 MR for the Investigation of Murine Vasculature
 Analysis of Freshly Fixed and Museum Invertebrate Specimens Using High-Resolution, High-Throughput MRI
 MRI Using Intermolecular Multiple-Quantum Coherences
 MRI of CEST-Based Reporter Gene
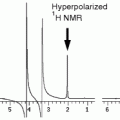 Hyperpolarized Molecules in Solution


An important requirement for good fMRI results is the immobilization of the subject head. Fixing the head is usually not enough and is commonly associated with sedation or anaesthesia. When sedation is used, several elements, when correlated to the experimental paradigm (i.e. associated to auditory stimulation) can confound the fMRI results. These include stress-inducing noise, which is very high during the whole experiment but higher during stimulation periods than during rest periods (auditory stimuli being louder than gradient noise) and also eye movements induced by auditory stimulation and consequent changing visual stimulation (due to light remaining in the bore). Because anaesthesia drastically reduces these confounding factors, we prefer to use anaesthesia instead of sedation. The choice of the anaesthetic agent is important and depends on many parameters. These parameters include (a) the scientific question: if one wants to compare fMRI results with electro-physiology results, one may want to use urethane, an anaesthetic often used for electro-physiology recordings in birds. If one wants to investigate the role of noradrenalin in auditory discrimination, medetomidine, a potent α2-adrenoreceptor agonist, should be avoided. (b) The survival of the birds: if birds need to be reused in other experiments, or simply measured repeatedly during a long time, one will choose an anaesthetic maximizing the survival rate of the birds. In this case, isoflurane is probably the best choice. In the case of gas being used, the anaesthetic needs to be mixed with nitrogen and oxygen.
Related posts:
Volumetry and Other Quantitative Measurements to Assess the Rodent Brain
MR for the Investigation of Murine Vasculature
Analysis of Freshly Fixed and Museum Invertebrate Specimens Using High-Resolution, High-Throughput MRI
Hyperpolarized Molecules in Solution
Stay updated, free articles. Join our Telegram channel
Full access? Get Clinical Tree
